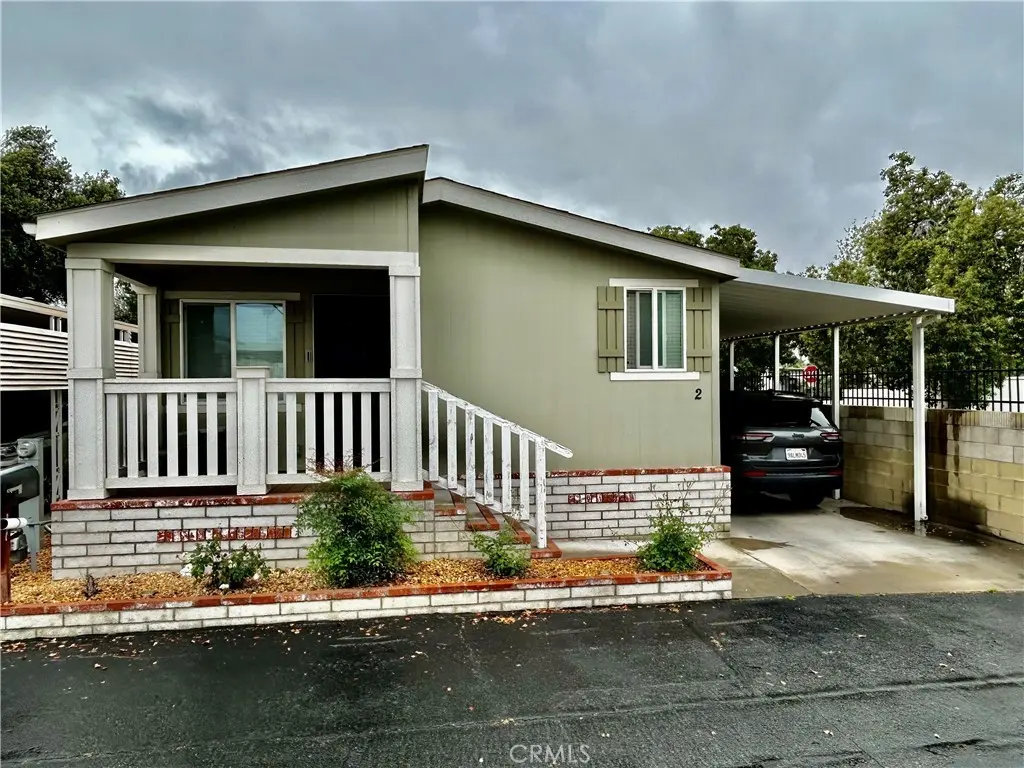
675 W Oakland Ave Unit G2 · Hemet, CA
Flood risk 1/10 · Minimal
- FEMA flood zone
- X (unshaded)
- Chance of flooding over 30 yrs
- 0.0%
- Est. flood insurance / yr
- $507 – $1,088
Fire risk 2/10 · Minimal
- Est. fire insurance / yr
- $659 – $1,223
Heat risk 7/10 · Major
- Hot days now (above 104°F)
- 6 days/yr
- Hot days in 30 yrs
- 17 days/yr
Wind risk 1/10 · Minimal
- Chance of severe wind over 30 yrs
- —
Air-quality risk 6/10 · Moderate
- Unhealthy air days now
- 12 days/yr
- Unhealthy air days in 30 yrs
- 14 days/yr
Risk factors via First Street. Map © Google.
Why this score? — see what drove the B- grade
The composite is a weighted blend of 9 inputs, each scored 0–100. Each bar is that input's sub-score; the figure is the points it added to the 100-point composite (weight × sub-score).
- Cash flow +30.0/30.0
- DSCR +10.0/10.0
- 1% rule +8.3/10.0
- ARV discount +7.5/15.0
- Rent growth +2.9/5.0
- Livability +2.6/5.0
- Schools +2.5/10.0
- Condition / age +2.2/5.0
- Appreciation +0.0/10.0
$150,000
🖨 Deal sheet 📄 Offer letter ✓ Due diligence
Listing remarks MLS
Welcome to this beautifully maintained 3 bedroom, 2 bathroom home located in a desirable gated all-ages community! This inviting home features an open floor plan that creates a seamless flow between the living, dining, and kitchen areas— perfect for entertaining and everyday living. Enjoy stylish laminate flooring throughout and ceiling fans in every room for year-round comfort. The spacious kitchen offers a center island, providing plenty of prep space and a great gathering spot for family and guests. A separate laundry room adds convenience and extra storage. Situated on a desirable corner lot, this home also features an attached carport for easy parking and accessibility. The community offers fantastic amenities including a pool, playground, clubhouse, and pool tables-perfect for relaxing and enjoying time with family and friends. This is a great opportunity to own a move-in ready home in a welcoming neighborhood. Schedule your private showing today—this one won't last!
Key facts
- Open floor plan
- Attached carport
- Community amenities
Tags
Neighborhood map
What this means for you Summary
Snapshot
- This is a 3-bed/2.0-bath manufactured listed at $150k. Condition is rated fair.
Deal economics
- At list price, monthly cash flow is $638 ($8k/yr) — positive.
- The deal already cash-flows at list — no discount required.
- Meets the 1% rule at list price ($2k rent vs $150k).
- Recommended offer: $141k (6.0% below list) — sets the bar for market timing.
- Cap rate 11.4% vs local median 4.9% in Hemet — top-decile yield for the area; either an underpriced asset or a hidden risk that comps aren't pricing in. Stress-test before assuming the spread holds.
Location & tenants
- Location reads 51/100 on livability (#1,056 in CA) — a working-class tenant base; expect higher turnover. Strengths: housing A+; Watch: crime D+, schools F, amenities F.
- Hemet Unified (suburban): math 19% / reading 41% proficiency, ranked #360 of 517 in CA (top 70%) — families likely to look elsewhere, expect single-tenant / working-renter base with shorter leases; 66% free/reduced lunch — lower-income household profile, screen leases tightly.
- Market conditions: Rents rising (+1.8%/yr); 264 active listings in the ZIP; 40 comparable units currently listed for rent nearby; rentals at typical pace (median 24d on market — plan ~3-4 weeks tenant-placement turnaround); 48% of comp listings sitting > 30 days — soft ceiling on asking rent; 9,195 units permitted in Riverside County in 2024 (1,512 in 5+ unit buildings).
- At $1,990/mo this rent would consume 48% of the median local household income ($49k/yr) (locally 2144% of renters already pay >50% of income on rent) — very limited rent-growth headroom before tenants either downsize or default.
Forward outlook
- Local home prices are declining (-3.0%/yr); year-one equity from $1k of loan paydown is wiped out by about $4k of value loss. Plan a longer hold.
- Riverside County population projected at +22% by 2050 — long-run rental-demand tailwind backs the buy-and-hold thesis.
- At projected returns (-3.0% appreciation + 1.8% rent growth), your $42k cash investment doubles in ~8 years — after that, you're playing with house money.
Negotiation context
- It's been on market 66 days — a 6% lower offer ($141k) is reasonable based on typical stale-listing flexibility.
- 2 sale attempts with the ask held roughly flat each time — persistent listings suggest the price (not the market) is what's stuck; bring a comps-based counter.
Risks & watch-outs
- Climate carrying-cost: extreme-heat days projected 6→17/yr by 2055 (HVAC capex compounding) — expect insurance premiums to compound above CPI over the hold.
Questions for the listing agent
- It's been on market 66 days. Have you received any prior offers? Is the seller open to a 6% concession, seller financing, or rate buy-down credit?
- Have any recent inspections been done? Can we get a copy of the seller's disclosures and any deferred-maintenance estimates?
- Why hasn't it sold? Are there any deal-killer items the seller is aware of (foundation, flood, title, zoning, code violations)?
- Is there a deadline driving the sale (1031 exchange, divorce, estate, relocation)? That informs how much negotiation room exists.
- Schools are F-rated, which usually means shorter tenancies and higher turnover. Who's the typical renter profile here, and what's been the actual vacancy rate?
- Crime grade is D in this area — have there been break-ins, vandalism, or insurance claims at this property in the last 3 years? What carrier currently insures it and at what premium?
- What's the average days-on-market for RENTAL listings here right now (not sales)? A rising rental-DOM trend means longer vacancies and softer asking-rent achievability than the comps imply.
- What's the recent tenant-quality profile in this submarket — average credit score on applications, eviction rate, late-payment / NSF rate, and stable-employment percentage? A property-management company in the area should have these aggregated.
- How much new for-sale + rental construction is in the pipeline within 1–3 miles? Heavy new supply typically softens prices + rents 12–24 months out; constrained supply supports both.
Investment metrics
- 1% rule
- 1.33% ✓
- Cap rate
- 11.40%
- Cash-on-cash
- 18.23%
- DSCR
- 1.81
- GRM
- 6.3
CMA / ARV
- ARV (median comp)
- $69,930
- List price
- $150,000
- Delta
- 114.50%
- Verdict
- OVERPRICED
- Comps
- 20 within 1.0 mi
Show comp detail 12 sales within ~0.75 mi
| Address | Dist | Beds/Ba | Sqft | Sold | Price | $/sf | Match |
|---|---|---|---|---|---|---|---|
| 430 N Palm #102 | 0.16mi | 2/1.5 (-1) | 1,200 (-3%) | 2mo | $45,000 | $38 | 79 |
| 675 W Oakland Ave Unit E2 | 0.00mi | 3/2.0 | 1,344 (+8%) | 10mo | $115,000 | $86 | 77 |
| 332 N Lyon Ave #67 | 0.60mi | 2/2.0 (-1) | 1,248 (+1%) | 3mo | $49,500 | $40 | 63 |
| 526 Calhoun Pl | 0.65mi | 3/2.0 | 1,264 (+2%) | 4mo | $400,000 | $316 | 63 |
| 1525 W Oakland Ave #115 | 0.58mi | 2/2.0 (-1) | 1,248 (+1%) | 6mo | $46,000 | $37 | 62 |
| 1380 Cabrillo | 0.49mi | 2/2.0 (-1) | 1,152 (-7%) | 2mo | $260,000 | $226 | 59 |
| 530 W Devonshire Ave #36 | 0.14mi | 2/3.0 (-1) | 1,056 (-15%) | 7mo | $45,000 | $43 | 53 |
| 1570 San Vicente Dr | 0.64mi | 2/2.0 (-1) | 1,296 (+4%) | 9mo | $90,000 | $69 | 50 |
| 332 N Lyon Ave #118 | 0.60mi | 2/2.0 (-1) | 1,344 (+8%) | 11mo | $42,000 | $31 | 44 |
| 542 Castille | 0.67mi | 2/2.0 (-1) | 1,392 (+12%) | 2mo | $239,000 | $172 | 42 |
| 1300 W Menlo #92 | 0.71mi | 2/2.0 (-1) | 1,344 (+8%) | 8mo | $94,000 | $70 | 41 |
| 1300 W Menlo Ave #185 | 0.71mi | 2/2.0 (-1) | 1,344 (+8%) | 8mo | $77,500 | $58 | 41 |
Match score weights: distance 35% · size 25% · config 20% · recency 20%. Top-matched comps best support the ARV.
Projected returns pro-forma
-3.0% appreciation · 1.76% rent growth · sell at horizon
- IRR
- 8.5%
- Equity multiple
- 1.33×
- Total profit
- $13,843
- Equity at exit
- $22,365
- IRR
- 16.7%
- Equity multiple
- 2.30×
- Total profit
- $54,430
- Equity at exit
- $12,969
Cash invested: $42,000 (down + closing). Projections, not guarantees.
Landlord ↔ Tenant lean methodology
- Overall (STATE)
- 18 Strongly Tenant-Friendly
- State California
- 18 Strongly Tenant-Friendly · D+13
- County
- — inherits STATE
- City
- — inherits STATE
ZIP-level market 92543
- Home prices YoY
- -26.7%
- Rents YoY
- 1.8%
- Active inventory
- 264
- Price-to-rent
- 6.3×
Monthly cashflow live
- Estimated rent
- $1,990 high interval (Pro) →
- Mortgage (P&I)
- −$787
- Tax from tax record
- −$85 /mo · $1,015/yr
- Insurance
- −$62
- HOA
- −$0
- Vacancy / Maint / Mgmt
- −$418
- Net cashflow
- $638
Break-even live
UW: 25.0% down · 7.5% · 30yr · 1.5% tax · 5.0% vac · 8.0% maint · 8.0% mgmt
Financing live
Cash to close
- Down payment
- $37,500
- Closing costs
- $4,500
- Reserves months
- —
- Total cash needed
- —
Loan-product check · same deal, 3 products live
Conventional
25% down · 7.5% · 30yr
- Down + closing
- —
- Monthly P&I
- —
- Monthly cashflow
- —
- DSCR
- —
- Eligible?
- —
Personal DTI + credit; lowest rate.
DSCR
20% down · 8.5% · 30yr
- Down + closing
- —
- Monthly P&I
- —
- Monthly cashflow
- —
- DSCR
- —
- Eligible?
- —
No personal income docs; deal must DSCR.
Hard money
10% down · 12.0% · 12mo
- Down + closing
- —
- Monthly P&I
- —
- Monthly cashflow
- —
- DSCR
- —
- Eligible?
- —
Short-term bridge; refi at stabilization.
Rent comps 40 comps
| Address | Beds | Baths | Sqft | Rent | $/sqft | DOM | Units | Dist |
|---|---|---|---|---|---|---|---|---|
| 1270 Rosalia Ave Unit 1 Hemet, CA | 2.0 | 1.0 | 900 | $1,800 | $2.00 | 43d | 1 | 0.43mi |
| 446 N Elk St Unit D Hemet, CA | 2.0 | 1.0 | 980 | $1,675 | $1.71 | 24d | 1 | 0.44mi |
| 250 N Elk St Hemet, CA | 2.0 | 1.0 | 900 | $1,625 | $1.81 | 14d | 1 | 0.51mi |
| 663 Mariposa Dr Hemet, CA | 2.0 | 2.0 | 1440 | $1,500 | $1.04 | 24d | 1 | 0.52mi |
| 1315 W Latham Ave Hemet, CA | 3.0 | 2.5 | 1340 | $2,550 | $1.90 | 43d | 1 | 0.59mi |
| 526 Greystone Ln Apt 3 Hemet, CA | 2.0 | 1.0 | 700 | $1,650 | $2.36 | 43d | 1 | 0.60mi |
| 526 Greystone Ln Hemet, CA | 2.0 | 1.0 | 700 | $1,600 | $2.29 | 18d | 1 | 0.60mi |
| 526 Greystone Ln Hemet, CA | 2.0 | 1.0 | 700 | $1,600 | $2.29 | 43d | 1 | 0.60mi |
| 646 Greystone Ln Apt 2 Hemet, CA | 3.0 | 1.0 | 750 | $1,500 | $2.00 | 44d | 1 | 0.67mi |
| 529 E Latham Ave Hemet, CA | 3.0 | 1.0 | 1226 | $1,950 | $1.59 | 20d | 1 | 0.69mi |
| 1887 Calle Amargosa Hemet, CA | 2.0 | 1.0 | 827 | $1,545 | $1.87 | 24d | 1 | 0.77mi |
| 363 S Gilbert St Unit B Hemet, CA | 3.0 | 2.0 | 1200 | $1,900 | $1.58 | 14d | 1 | 0.81mi |
| 363 S Gilbert St Hemet, CA | 3.0 | 2.0 | 1200 | $1,900 | $1.58 | 4d | 1 | 0.81mi |
| 627 Solano Dr Hemet, CA | 2.0 | 2.0 | 882 | $1,800 | $2.04 | 18d | 1 | 0.81mi |
| 1862 Pueblo Dr Hemet, CA | 2.0 | 2.0 | 977 | $1,900 | $1.94 | 43d | 1 | 0.81mi |
| 1862 Pueblo Dr Unit 1862 Hemet, CA | 2.0 | 2.0 | 977 | $1,750 | $1.79 | 24d | 1 | 0.81mi |
| 1700 Walden Ln Hemet, CA | 3.0 | 2.0 | 1430 | $2,670 | $1.87 | 24d | 1 | 0.83mi |
| 910 E Campus Way Unit 910 Hemet, CA | 2.0 | 1.0 | 940 | $1,550 | $1.65 | 43d | 1 | 0.83mi |
| 1964 W Oakland Ave Hemet, CA | 2.0 | 2.0 | 977 | $1,695 | $1.73 | 18d | 1 | 0.85mi |
| 1931 Nuevo St Hemet, CA | 2.0 | 1.0 | 820 | $1,600 | $1.95 | 43d | 1 | 0.87mi |
| 1933 Nuevo St Hemet, CA | 2.0 | 1.0 | 827 | $1,700 | $2.06 | 24d | 1 | 0.87mi |
| 930 Calhoun Pl Hemet, CA | 3.0 | 1.0 | 960 | $2,890 | $3.01 | 24d | 1 | 0.90mi |
| 2054 Avenida Olivos Hemet, CA | 2.0 | 1.0 | 820 | $1,500 | $1.83 | 43d | 1 | 0.92mi |
| 471 S Simpson Ave Unit D Hemet, CA | 2.0 | 2.0 | 900 | $1,750 | $1.94 | 43d | 1 | 0.93mi |
| 1118 E Campus Way Hemet, CA | 2.0 | 2.0 | 900 | $2,200 | $2.44 | 24d | 1 | 0.94mi |
| 341 Calle Nogales Hemet, CA | 2.0 | 1.0 | 827 | $1,395 | $1.69 | 43d | 1 | 0.96mi |
| 2120 San Bernardo Ave Hemet, CA | 2.0 | 1.0 | 827 | $2,100 | $2.54 | 43d | 1 | 0.96mi |
| 2014 Iris Way Hemet, CA | 3.0 | 2.0 | 1192 | $2,850 | $2.39 | 43d | 1 | 1.01mi |
| 528 San Marino St Hemet, CA | 2.0 | 1.0 | 827 | $1,900 | $2.30 | 43d | 1 | 1.01mi |
| 682 San Marino St Hemet, CA | 2.0 | 1.0 | 827 | $1,600 | $1.93 | 43d | 1 | 1.04mi |
| 2269 San Bernardo Ave Hemet, CA | 2.0 | 1.0 | 827 | $1,650 | $2.00 | 43d | 1 | 1.06mi |
| 1850 Amberwood Dr Hemet, CA | 2.0 | 2.0 | 1170 | $1,561 | $1.33 | 43d | 1 | 1.10mi |
| 1461 W Mayberry Ave Hemet, CA | 2.0 | 2.0 | 1044 | $1,750 | $1.68 | 43d | 1 | 1.12mi |
| 611 S Palm Ave Unit K Hemet, CA | 2.0 | 2.0 | 1254 | $1,895 | $1.51 | 7d | 1 | 1.13mi |
| 471 Whitney Dr Hemet, CA | 2.0 | 2.0 | 1085 | $1,800 | $1.66 | 5d | 1 | 1.14mi |
| 926 Griffith Way Hemet, CA | 4.0 | 2.0 | 1300 | $2,800 | $2.15 | 43d | 1 | 1.14mi |
| 2098 W Acacia Ave Hemet, CA | 1.0–3.0 | 1.0–2.0 | 895 | $2,475 | $2.77 | 1d | 1 | 1.16mi |
| 2488 San Padre Ct Hemet, CA | 2.0 | 1.0 | 827 | $1,599 | $1.93 | 14d | 1 | 1.17mi |
| 876 W Whittier Ave Unit 878 Hemet, CA | 2.0 | 2.0 | 1127 | $2,150 | $1.91 | 24d | 1 | 1.20mi |
| 2422 San Padre Ct Hemet, CA | 2.0 | 1.0 | 827 | $1,800 | $2.18 | 24d | 1 | 1.20mi |
Listing history 19 events
-
2026-06-18days on market $150,000 Active 66 DOM
-
2026-06-17days on market $150,000 Active 65 DOM
-
2026-06-16days on market $150,000 Active 64 DOM
-
2026-06-15days on market $150,000 Active 63 DOM
-
2026-06-13days on market $150,000 Active 61 DOM
-
2026-06-09days on market $150,000 Active 57 DOM
-
2026-06-08days on market $150,000 Active 56 DOM
-
2026-06-07days on market $150,000 Active 55 DOM
-
2026-06-04days on market $150,000 Active 52 DOM
-
2026-06-03days on market $150,000 Active 51 DOM
-
2026-06-02days on market $150,000 Active 50 DOM
-
2026-06-02price $150,000 Active 49 DOM
-
2026-06-01days on market $155,000 Active 49 DOM
-
2026-05-31days on market $155,000 Active 48 DOM
-
2026-04-13$155,000 Active 999-char remark
Show marketing remark (999 chars)
Welcome to this beautifully maintained 3 bedroom, 2 bathroom home located in a desirable gated all-ages community! This inviting home features an open floor plan that creates a seamless flow between the living, dining, and kitchen areas— perfect for entertaining and everyday living. Enjoy stylish laminate flooring throughout and ceiling fans in every room for year-round comfort. The spacious kitchen offers a center island, providing plenty of prep space and a great gathering spot for family and guests. A separate laundry room adds convenience and extra storage. Situated on a desirable corner lot, this home also features an attached carport for easy parking and accessibility. The community offers fantastic amenities including a pool, playground, clubhouse, and pool tables-perfect for relaxing and enjoying time with family and friends. This is a great opportunity to own a move-in ready home in a welcoming neighborhood. Schedule your private showing today—this one won't last!
-
2025-12-18historical
-
2025-10-17price $145,000
-
2025-08-04price $155,000
-
2025-06-23$160,000 Active
ⓘ Source: listings_history table (triggers on properties + properties_extension) + one-shot
backfill from property_details.listing_events for pre-trigger history.
Tax reassessment forecast CA · Resets to sale price
- Current annual tax
- $1,015 · $85/mo
- Projected year-2 tax
- $1,140 · $95/mo
- Expected delta
- +$125/yr (+$10/mo · 12.3%)
ⓘ Screening estimate from a state-policy table — verify with the county assessor before closing.
Climate risk First Street
- Flood 1/10 Low FEMA zone X (unshaded) · 0% chance over 30 yrs
- Wildfire 2/10 Low
- Heat 7/10 Severe 6 d/yr ≥104°F today · 17 d/yr by 30 yrs out
- Wind 1/10 Low
- Air quality 6/10 Major 12 unhealthy d/yr today · 14 by 30 yrs out
Nearby sold comps map
Loading sold comps map…
Walkable amenities ~0.75 mi
Loading nearby amenities…
Taxation est. · year 1
- Rental income
- $23,874
- − Mortgage interest
- −$8,402
- − Property taxes
- −$1,015
- − Insurance
- −$750
- − Repairs & maintenance
- −$1,910
- − Management
- −$1,910
- − Depreciation
- −$4,364
- Taxable income
- $5,523
- Est. tax owed @ 24.0%
- −$1,326
- After-tax cash flow
- $6,331/yr
For passive investors: Depreciation is non-cash, so a rental often shows a tax loss while cash-flowing — sheltering income. Rental losses are passive: they offset passive income freely, and up to $25,000/yr can offset ordinary (W-2) income if you actively participate and your MAGI is under $100k (phasing out to $0 by $150k); unused losses carry forward. On sale, claimed depreciation is recaptured at up to 25%, and gains may owe capital-gains tax (a 1031 exchange can defer both). Figures are a year-1 estimate at your 24.0% rate — not tax advice; consult a CPA.
Condition & rehab AI · 12 photos
This home requires moderate repairs and maintenance, with a focus on the roof and exterior siding. Simple updates like painting and replacing ceiling fans can significantly enhance its value.
Repairs flagged
- Major roof — visible wear
- Major exterior siding — moderate wear
Value-add opportunities
- Both paint interior walls — enhances curb appeal and interior aesthetics
- Both replace ceiling fans — improves air circulation and reduces energy consumption
- Both repair roof and exterior siding — extends home's lifespan and improves curb appeal
Renovation cost estimate screening
| Repair item | Severity | Est. cost |
|---|---|---|
| roof · visible wear | Major | $15,000–50,000 |
| exterior siding · moderate wear | Major | $15,000–50,000 |
| Total estimated repair cost · 2 items | $30,000–100,000 |
Value-add ROI direction
- Both paint interior walls — enhances curb appeal and interior aesthetics ↑
- Both replace ceiling fans — improves air circulation and reduces energy consumption ↑
- Both repair roof and exterior siding — extends home's lifespan and improves curb appeal ↑
ⓘ Cost ranges are severity-bucket heuristics (US national rule-of-thumb). Get contractor quotes + a written scope before underwriting a rehab budget.
Schools (NCES district)
- District
- Hemet Unified
- NCES district ID
- 0616920
- Math proficiency
- 19% ▼ -3.00%
- Reading proficiency
- 41% ▲ 4.00%
- Median HH income
- $39,962
- Composite
- 25.16/100
- National rank
- #7517
- State rank
- #360 of 517 in CA
Livability — Hemet
- Score
- 51/100
- State rank
- #1056
- US rank
- #25208
Category grades
Schools grade is shown separately in the Schools card above.
Census & demographics
- Census place
- Hemet, CA
- County
- Riverside County · 2,287,001 people
- City population
- 137,670
- Metro
- Riverside-San Bernardino-Ontario, CA
- Population (ZIP)
- 39,937
- Household income
- $49,396
- Rent vs Own
- Severe rent burden
- 2144.0
Population outlook (Riverside County) Hauer SSP2
- Today (2025)
- 2,664,475 people
- By 2030
- 2,802,692 · +5.2%
- By 2040
- 3,050,904 · +14.5%
- By 2050
- 3,256,783 · +22.2%
- By 2075
- 3,655,058 · +37.2%
- By 2100
- 3,766,594 · +41.4%
Race, ethnicity, and origin ACS 2023
- Neighborhood character
- Diverse neighborhood (Simpson 0.61)
- Race & ethnicity
- Hispanic / Latino 54% White 30% Two or more races 18% Black 10% Native American 2% Asian 2%
- Hispanic origin (detail)
- Mexican 48% Puerto Rican 1%
- Common ancestry
- Slovak 1% Romanian 1% Portuguese 1%
- Foreign-born
- 21% · Canada
- Languages at home
- 59% English-only · Spanish 38% Arabic 1% Tagalog/Filipino 1%
Political lean MEDSL · Riverside
- 2024 margin
- Toss-up / Even · D 48.0% · R 49.3% · Other 2.6%
- 2008→2024 swing
- -3.6pp toward R · 2008: 2.3pp · 2024: -1.3pp
- All cycles
- 2024: R+1.3 2020: D+8.0 2016: D+4.3 2012: R+0.4 2008: D+2.3
Not yet ingested
- Civics
- —
Market trends
- HPI YoY
- ▼ -147.46%
- Current HPI
- 405.1277
- Rent YoY
- ▲ 1.76%
- Metro
- Riverside-San Bernardino-Ontario, CA
- State GDP YoY
- ▲ 3.21%
- F500 in state
- 116
Industry mix (Fortune 500 HQ in CA)
| Industry | F500 HQs | Revenue |
|---|---|---|
| Technology | 27 | $1,492B |
|
||
| Financial Services | 3 | $174B |
|
||
| Retail | 3 | $44B |
|
||
| Insurance | 3 | $26B |
|
||
| Media / Entertainment | 2 | $115B |
|
||
| Pharmaceuticals / Biotech | 2 | $62B |
|
||
Price history
-3.1% since first listed5 events — show timeline
- 2026-04-13 Listed $155,000 CRMLS
- 2025-12-18 Listing Removed — CRMLS
- 2025-10-17 Price Changed $145,000 CRMLS
- 2025-08-04 Price Changed $155,000 CRMLS
- 2025-06-23 Listed $160,000 CRMLS
Property tax history
-0.8%/yrLatest (2025): $1,015 · +2.1% YoY. Source: county tax records.
Cash-flow waterfall
monthlySold comps — $/sqft
last 12 mo · ≤1 miLoading sold comps…