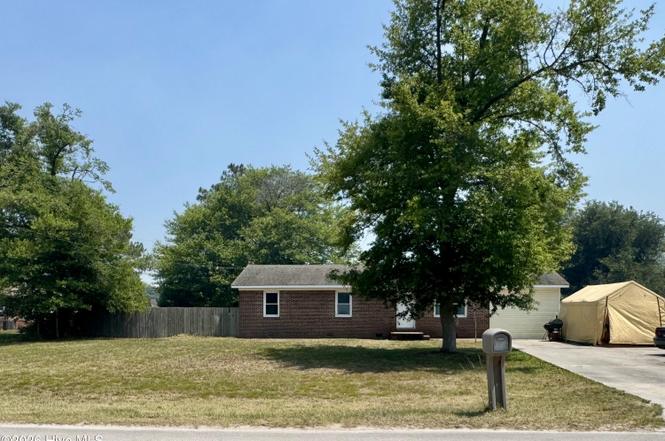
403 Oregon Trl · Swansboro, NC
Flood risk 1/10 · Minimal
- FEMA flood zone
- X (unshaded)
- Chance of flooding over 30 yrs
- 0.0%
- Est. flood insurance / yr
- $507 – $1,088
Fire risk 6/10 · Moderate
- Est. fire insurance / yr
- $906 – $1,684
Heat risk 9/10 · Severe
- Hot days now (above 105°F)
- 7 days/yr
- Hot days in 30 yrs
- 20 days/yr
Wind risk 8/10 · Major
- Chance of severe wind over 30 yrs
- 99.0%
Air-quality risk 2/10 · Minimal
- Unhealthy air days now
- 0 days/yr
- Unhealthy air days in 30 yrs
- 2 days/yr
Risk factors via First Street. Map © Google.
Why this score? — see what drove the B- grade
The composite is a weighted blend of 9 inputs, each scored 0–100. Each bar is that input's sub-score; the figure is the points it added to the 100-point composite (weight × sub-score).
- Cash flow +25.8/30.0
- ARV discount +15.0/15.0
- DSCR +8.6/10.0
- 1% rule +5.9/10.0
- Schools +3.9/10.0
- Livability +3.9/5.0
- Rent growth +3.2/5.0
- Condition / age +2.5/5.0
- Appreciation +0.0/10.0
$170,000
🖨 Deal sheet (PDF) 📄 Offer letter ✓ Due diligence
Listing remarks MLS
Check out this completely renovated 4 bedroom, 2 bathroom home located in the heart of Hubert! Upon entry you are greeted with NEW flooring (NO carpets!), FRESH paint, UPDATED fixtures and lots of natural light creating a crisp, clean and inviting feel throughout this home! Preparing meals and entertaining is a pleasure in this kitchen offering granite counter tops and NEW stainless steel appliances. Master suite offers a private bath, walk through closet, new windows & FRESH paint along with super easy access to the laundry room. Perfectly sized 2nd, 3rd & 4th bedrooms provide ample closet space, NEW flooring and FRESH paint! A second, full bath is conveniently located in the hallway, Outdoor entertaining and activities will be a blast in this LARGE yard with open deck & easy access to the backyard with a BRAND NEW sliding glass door! This home is priced to sell and will go FAST- schedule your personal tour today!
Key facts
- Fenced in backyard
- 0.47 acre lot
- Built 1970
Tags
Property features AI
Finance
- Other: Zoning: R-15; Lot is irregularly shaped and about 0.47 acres; Subdivision: Timber Ridge
- HOA & community: No association amenities
Exterior
- Parking: Paved parking
- Security: Smoke detector(s)
- Utilities: Public water; Septic tank
- Home design: Single-family residence; One-story; Entry level: 1
- Construction: Brick and stone construction; Shingle roof; Crawl space foundation; Built using materials noted in remarks
- Exterior features: Deck; Back yard fencing (chain link and wood); Has a view; Paved road access
Interior
- Kitchen: Electric cooktop; Refrigerator; Dishwasher; Microwave
- Bedrooms: 6 total rooms (includes bedrooms and living areas)
- Flooring: Tile; Vinyl
- Bathrooms: 2 full bathrooms
- Heating & cooling: Central air; Electric heating; Heat pump
- Interior features: Walk-in closet(s); Accessible full bath; Smoke detector(s)
- Laundry & utility: Laundry room; Electric water heater
Neighborhood map
What this means for you Summary
Snapshot
- This is a 3-bed/2.0-bath single-family listed at $170k.
Deal economics
- At list price, monthly cash flow is $412 ($5k/yr) — positive.
- The deal already cash-flows at list — no discount required.
- Meets the 1% rule at list price ($2k rent vs $170k).
- Cap rate 9.2% vs local median 3.5% in Swansboro — top-decile yield for the area; either an underpriced asset or a hidden risk that comps aren't pricing in. Stress-test before assuming the spread holds.
Location & tenants
- Location reads 77/100 on livability (#32 in NC, #3,124 nationally) — a middle-class / working-renter tenant base. Strengths: housing A+, health & safety A+, crime A; Watch: amenities F, commute F.
- Onslow County Schools (other): math 42% / reading 49% proficiency, ranked #84 of 178 in NC (top 47%) — families likely to look elsewhere, expect single-tenant / working-renter base with shorter leases.
- Zoned schools: Sand Ridge Elementary (math 57% / reading 54%, grade C, #293 of 1,410 statewide, top 21%, 581 students, 58% FRL); Swansboro Middle (math 52% / reading 55%, grade C+, #87 of 475 statewide, top 19%, 967 students, 43% FRL); Swansboro High (math 77% / reading 68%, grade B+, #104 of 535 statewide, top 19%, 1,115 students, 38% FRL).
- Zoned-school proficiency averages 60% at this address vs 46% district-wide (+15 pts) — the actual schools serving this property are materially stronger than the Onslow County Schools average implies; a family-tenant draw the district grade alone would hide.
- Market conditions: Rents rising (+2.6%/yr); 322 active listings in the ZIP; 6 comparable units currently listed for rent nearby; rentals at typical pace (median 22d on market — plan ~3-4 weeks tenant-placement turnaround); 1,246 units permitted in Onslow County in 2024 (0 in 5+ unit buildings).
- This rent runs 33% of the median local income ($67k/yr) — at the standard rent-burdened threshold; future hikes will face affordability resistance.
Forward outlook
- Local home prices are declining (-3.0%/yr); year-one equity from $1k of loan paydown is wiped out by about $5k of value loss. Plan a longer hold.
Negotiation context
- Only 3 days on market — expect competitive offers; lowballing is unlikely to land.
- 3 sale attempts since 9y ago with the ask held roughly flat each time — persistent listings suggest the price (not the market) is what's stuck; bring a comps-based counter.
- Current owner paid $132k; 29% above their basis — modest negotiation headroom, anchor on the comps not their cost.
Risks & watch-outs
- Climate carrying-cost: severe wind risk, 99% chance of damaging wind over 30y; major wildfire risk; extreme-heat days projected 7→20/yr by 2055 (HVAC capex compounding) — expect insurance premiums to compound above CPI over the hold.
Questions for the listing agent
- Built in 1970 — when were the roof, HVAC, electrical panel, plumbing, and water heater last replaced?
- Is there a deadline driving the sale (1031 exchange, divorce, estate, relocation)? That informs how much negotiation room exists.
- What's the average days-on-market for RENTAL listings here right now (not sales)? A rising rental-DOM trend means longer vacancies and softer asking-rent achievability than the comps imply.
- What's the recent tenant-quality profile in this submarket — average credit score on applications, eviction rate, late-payment / NSF rate, and stable-employment percentage? A property-management company in the area should have these aggregated.
- How much new for-sale + rental construction is in the pipeline within 1–3 miles? Heavy new supply typically softens prices + rents 12–24 months out; constrained supply supports both.
Investment metrics
- 1% rule
- 1.09% ✓
- Cap rate
- 9.20%
- Cash-on-cash
- 10.40%
- DSCR
- 1.46
- GRM
- 7.7
CMA / ARV
- ARV (on-the-fly)
- $246,525
- Comps found
- 12
Show comp detail 12 sales within ~0.75 mi
| Address | Dist | Beds/Ba | Sqft | Sold | Price | $/sf | Match |
|---|---|---|---|---|---|---|---|
| 142 Rosemary Ave | 0.29mi | 3/2.0 | 1,433 (+1%) | 1mo | $270,000 | $188 | 85 |
| 205 Michel Ct | 0.14mi | 3/2.0 | 1,228 (-14%) | 1mo | $265,000 | $216 | 69 |
| 56 Riegel Dr | 0.54mi | 3/1.5 | 1,428 (+0%) | 5mo | $70,000 | $49 | 68 |
| 165 Copeland Ct | 0.66mi | 3/1.5 | 1,425 (0%) | 1mo | $165,000 | $116 | 66 |
| 223 Lockwood Ct | 0.42mi | 3/2.0 | 1,291 (-9%) | 1mo | $278,000 | $215 | 64 |
| 402 Crown Point Rd | 0.54mi | 3/2.0 | 1,376 (-3%) | 7mo | $215,000 | $156 | 63 |
| 306 Foxtrace Ln | 0.75mi | 3/2.0 | 1,450 (+2%) | 3mo | $244,995 | $169 | 60 |
| 403 E Volant St | 0.61mi | 3/2.0 | 1,356 (-5%) | 6mo | $234,900 | $173 | 59 |
| 314 Dayrell Dr | 0.69mi | 3/2.0 | 1,351 (-5%) | 1mo | $275,000 | $204 | 58 |
| 625 Parsley Dr | 0.40mi | 3/2.5 | 1,589 (+12%) | 5mo | $310,000 | $195 | 56 |
| 146 Ash Ct | 0.65mi | 3/1.5 | 1,302 (-9%) | 7mo | $195,000 | $150 | 48 |
| 87 Crown Point Rd | 0.71mi | 3/1.5 | 1,274 (-11%) | 6mo | $185,000 | $145 | 42 |
Match score weights: distance 35% · size 25% · config 20% · recency 20%. Top-matched comps best support the ARV.
Projected returns pro-forma
-3.0% appreciation · 2.61% rent growth · sell at horizon
- IRR
- -1.1%
- Equity multiple
- 0.96×
- Total profit
- $-2,058
- Equity at exit
- $25,348
- IRR
- 8.1%
- Equity multiple
- 1.61×
- Total profit
- $28,880
- Equity at exit
- $14,698
Cash invested: $47,600 (down + closing). Projections, not guarantees.
Landlord ↔ Tenant lean methodology
- Overall (STATE)
- 85 Strongly Landlord-Friendly
- State North Carolina
- 85 Strongly Landlord-Friendly · R+3
- County
- — inherits STATE
- City
- — inherits STATE
ZIP-level market 28539
- Home prices YoY
- -23.9%
- Rents YoY
- 2.6%
- Active inventory
- 322
- Price-to-rent
- 7.7×
Monthly cashflow live
- Estimated rent
- $1,849 high interval (Pro) →
- Mortgage (P&I)
- −$891
- Tax from tax record
- −$86 /mo · $1,030/yr
- Insurance
- −$71
- HOA
- −$0
- Vacancy / Maint / Mgmt
- −$388
- Net cashflow
- $412
Break-even live
Sensitivity live
| Price | -10% $509 | -5% $460 | +0% $412 | +5% $364 | +10% $316 |
|---|---|---|---|---|---|
| Rent | -10% $266 | -5% $339 | +0% $412 | +5% $485 | +10% $558 |
| Rate | -1.0pp $498 | -0.5pp $456 | base $412 | +0.5pp $368 | +1.0pp $323 |
UW: 25.0% down · 7.5% · 30yr · 1.5% tax · 5.0% vac · 8.0% maint · 8.0% mgmt
Financing live
Cash to close
- Down payment
- $42,500
- Closing costs
- $5,100
- Reserves months
- —
- Total cash needed
- —
Loan-product check · same deal, 3 products live
Conventional
25% down · 7.5% · 30yr
- Down + closing
- —
- Monthly P&I
- —
- Monthly cashflow
- —
- DSCR
- —
- Eligible?
- —
Personal DTI + credit; lowest rate.
DSCR
20% down · 8.5% · 30yr
- Down + closing
- —
- Monthly P&I
- —
- Monthly cashflow
- —
- DSCR
- —
- Eligible?
- —
No personal income docs; deal must DSCR.
Hard money
10% down · 12.0% · 12mo
- Down + closing
- —
- Monthly P&I
- —
- Monthly cashflow
- —
- DSCR
- —
- Eligible?
- —
Short-term bridge; refi at stabilization.
Rent comps 6 comps
| Address | Beds | Baths | Sqft | Rent | $/sqft | DOM | Units | Dist |
|---|---|---|---|---|---|---|---|---|
| 135 Rosemary Ave Hubert, NC | 3.0 | 2.5 | 1610 | $2,100 | $1.30 | 21d | 1 | 0.27mi |
| 212 W Volant St Hubert, NC | 3.0 | 2.0 | 1223 | $1,750 | $1.43 | 21d | 1 | 0.54mi |
| 21 Crown Point Rd Hubert, NC | 4.0 | 2.5 | 1290 | $1,450 | $1.12 | 21d | 1 | 0.62mi |
| 400 Dayrell Dr Hubert, NC | 3.0 | 2.0 | 1267 | $1,800 | $1.42 | 21d | 1 | 0.67mi |
| 309 N Winchester Ln Hubert, NC | 4.0 | 2.0 | 1456 | $1,700 | $1.17 | 21d | 1 | 1.07mi |
| 136 Byrum Run Hubert, NC | 3.0 | 2.0 | 1164 | $1,800 | $1.55 | 21d | 1 | 1.47mi |
Listing history 4 events
-
2026-06-19days on market $170,000 Active 3 DOM
-
2026-06-18days on market $170,000 Active 2 DOM
-
2026-06-17remarks 228-char remark
-
2026-06-17$170,000 Active 1 DOM
ⓘ Source: listings_history table (triggers on properties + properties_extension) + one-shot
backfill from property_details.listing_events for pre-trigger history.
Tax reassessment forecast NC · Resets to sale price
- Current annual tax
- $1,030 · $86/mo
- Projected year-2 tax
- $1,394 · $116/mo
- Expected delta
- +$364/yr (+$30/mo · 35.4%)
ⓘ Screening estimate from a state-policy table — verify with the county assessor before closing.
Climate risk First Street
- Flood 1/10 Low FEMA zone X (unshaded) · 0% chance over 30 yrs
- Wildfire 6/10 Major
- Heat 9/10 Extreme 7 d/yr ≥105°F today · 20 d/yr by 30 yrs out
- Wind 8/10 Severe 99% chance of damaging wind over 30 yrs
- Air quality 2/10 Low 0 unhealthy d/yr today · 2 by 30 yrs out
Nearby sold comps map
Loading sold comps map…
Walkable amenities ~0.75 mi
Loading nearby amenities…
Taxation est. · year 1
- Rental income
- $22,185
- − Mortgage interest
- −$9,523
- − Property taxes
- −$1,030
- − Insurance
- −$850
- − Repairs & maintenance
- −$1,775
- − Management
- −$1,775
- − Depreciation
- −$4,945
- Taxable income
- $2,287
- Est. tax owed @ 24.0%
- −$549
- After-tax cash flow
- $4,399/yr
For passive investors: Depreciation is non-cash, so a rental often shows a tax loss while cash-flowing — sheltering income. Rental losses are passive: they offset passive income freely, and up to $25,000/yr can offset ordinary (W-2) income if you actively participate and your MAGI is under $100k (phasing out to $0 by $150k); unused losses carry forward. On sale, claimed depreciation is recaptured at up to 25%, and gains may owe capital-gains tax (a 1031 exchange can defer both). Figures are a year-1 estimate at your 24.0% rate — not tax advice; consult a CPA.
Schools (NCES district)
- District
- Onslow County Schools
- NCES district ID
- 3703450
- Math proficiency
- 42% ▲ 6.00%
- Reading proficiency
- 49% ▲ 5.00%
- Median HH income
- $46,076
- Composite
- 38.66/100
- National rank
- #4148
- State rank
- #84 of 178 in NC
Livability — Swansboro
- Score
- 77/100
- State rank
- #32
- US rank
- #3124
Category grades
Schools grade is shown separately in the Schools card above.
Census & demographics
- County
- Onslow County · 164,453 people
- Metro
- Jacksonville, NC
- Population (ZIP)
- 18,351
- Household income
- $66,976
- Rent vs Own
- Severe rent burden
- 602.0
Population outlook (Onslow County) Hauer SSP2
- Today (2025)
- 189,789 people
- By 2030
- 194,463 · +2.5%
- By 2040
- 193,629 · +2.0%
- By 2050
- 193,248 · +1.8%
- By 2075
- 196,995 · +3.8%
- By 2100
- 201,513 · +6.2%
Race, ethnicity, and origin ACS 2023
- Neighborhood character
- Predominantly White (82%)
- Race & ethnicity
- White 82% Two or more races 7% Hispanic / Latino 6% Black 6% Asian 1%
- Hispanic origin (detail)
- Mexican 3% Puerto Rican 2%
- Common ancestry
- Slovak 3% Romanian 3% Lithuanian 2%
- Foreign-born
- 3% · Canada
- Languages at home
- 93% English-only · Spanish 3% Other Asian/Pacific 1% Other Indo-European 1%
Political lean MEDSL · Onslow
- 2024 margin
- Solid R (+35.9) · D 31.5% · R 67.5% · Other 1.0%
- 2008→2024 swing
- -14.5pp toward R · 2008: -21.5pp · 2024: -35.9pp
- All cycles
- 2024: R+35.9 2020: R+30.2 2016: R+34.6 2012: R+27.0 2008: R+21.5
Not yet ingested
- Civics
- —
Market trends
- HPI YoY
- ▼ -58.68%
- Current HPI
- 186.871
- Rent YoY
- ▲ 2.61%
- Metro
- Jacksonville, NC
- State GDP YoY
- ▲ 3.28%
- F500 in state
- 26
Industry mix (Fortune 500 HQ in NC)
| Industry | F500 HQs | Revenue |
|---|---|---|
| Financial Services | 2 | $213B |
|
||
| Retail | 2 | $95B |
|
||
| Industrial Conglomerate | 1 | $38B |
|
||
| Metals / Steel | 1 | $35B |
|
||
| Utilities | 1 | $30B |
|
||
| Industrial Machinery | 1 | $19B |
|
||
Price history
+174.2% since first listed7 events — show timeline
- 2026-06-17 Listed $170,000 Hive MLS
- 2020-03-31 Sold (Public Records) $131,500 Public Records
- 2020-03-31 Sold (MLS) $131,500 Hive MLS
- 2019-09-09 Listed $133,000 Hive MLS
- 2018-02-16 Sold (Public Records) $45,000 Public Records
- 2018-02-15 Sold (MLS) $45,000 Hive MLS
- 2017-11-13 Listed $62,000 Hive MLS
Property tax history
+3.5%/yrLatest (2025): $1,030 · +0.0% YoY. Source: county tax records.
Cash-flow waterfall
monthlySold comps — $/sqft
last 12 mo · ≤1 miLoading sold comps…