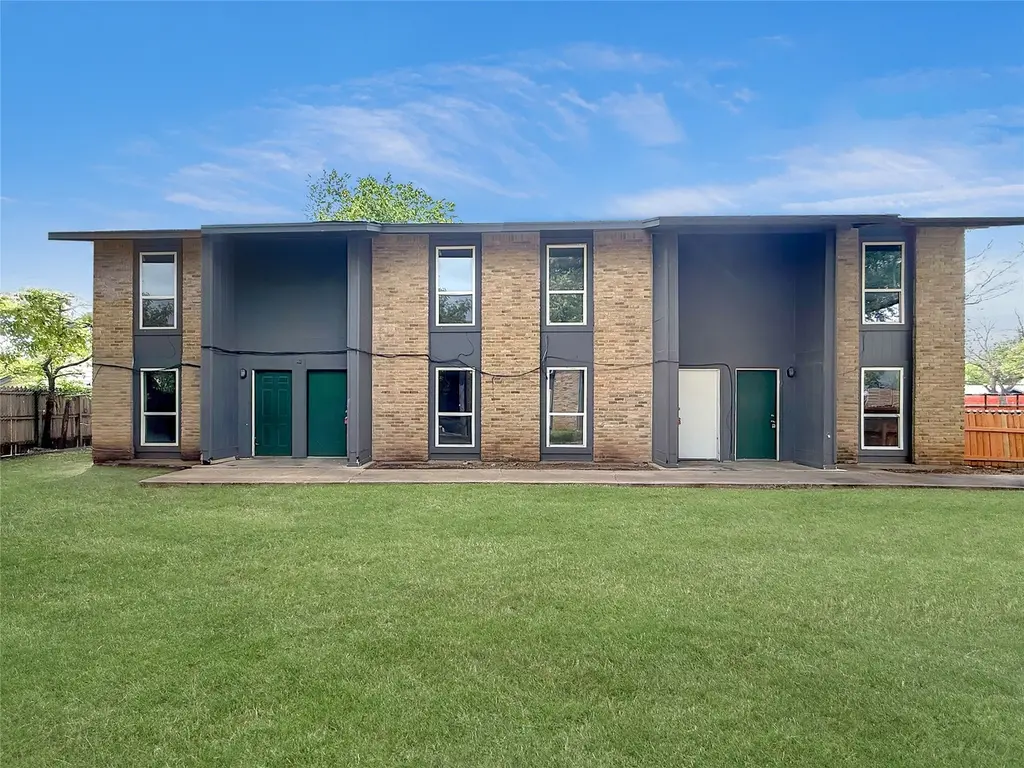
8611 Putnam Dr #101 · Austin, TX
Flood risk 1/10 · Minimal
- FEMA flood zone
- X (unshaded)
- Chance of flooding over 30 yrs
- 0.0%
- Est. flood insurance / yr
- $507 – $1,088
Fire risk 1/10 · Minimal
- Est. fire insurance / yr
- $1,222 – $2,270
Heat risk 8/10 · Major
- Hot days now (above 108°F)
- 7 days/yr
- Hot days in 30 yrs
- 23 days/yr
Wind risk 8/10 · Major
- Chance of severe wind over 30 yrs
- 80.0%
Air-quality risk 2/10 · Minimal
- Unhealthy air days now
- 1 days/yr
- Unhealthy air days in 30 yrs
- 1 days/yr
Risk factors via First Street. Map © Google.
Why this score? — see what drove the B grade
The composite is a weighted blend of 9 inputs, each scored 0–100. Each bar is that input's sub-score; the figure is the points it added to the 100-point composite (weight × sub-score).
- Cash flow +30.0/30.0
- 1% rule +10.0/10.0
- DSCR +10.0/10.0
- ARV discount +7.5/15.0
- Livability +4.1/5.0
- Schools +3.4/10.0
- Rent growth +2.8/5.0
- Condition / age +2.2/5.0
- Appreciation +0.0/10.0
$104,900
🖨 Deal sheet 📄 Offer letter ✓ Due diligence
Listing remarks MLS
Great location for this 2-bedroom condo, just minutes from vibrant nightlife, restaurants, and shopping. Don’t miss out—this one won’t last long. To help visualize this homes floor plan and to highlight its potential virtual furnishings may have been added to photos found in this listing.
Key facts
- Parking
- Built 1973
- Listed 71 days
Neighborhood map
What this means for you Summary
Snapshot
- This is a 2-bed/1.5-bath condo listed at $105k. Condition is rated fair.
Deal economics
- At list price, monthly cash flow is $545 ($7k/yr) — positive.
- The deal already cash-flows at list — no discount required.
- Meets the 1% rule at list price ($2k rent vs $105k).
- Recommended offer: $99k (6.0% below list) — sets the bar for market timing.
- Cap rate 12.5% vs local median 1.8% in Austin — top-decile yield for the area; either an underpriced asset or a hidden risk that comps aren't pricing in. Stress-test before assuming the spread holds.
Location & tenants
- Location reads 82/100 on livability (#16 in TX, #1,208 nationally) — a professional / high-income tenant draw. Strengths: amenities A+, commute A+, employment A+; Watch: cost of living D, crime F.
- Austin ISD (urban): math 33% / reading 44% proficiency, ranked #431 of 826 in TX (top 52%) — families likely to look elsewhere, expect single-tenant / working-renter base with shorter leases.
- Market conditions: Rents rising (+1.3%/yr); 206 active listings in the ZIP; 40 comparable units currently listed for rent nearby; rentals at typical pace (median 24d on market — plan ~3-4 weeks tenant-placement turnaround); solid renter incomes; 17,121 units permitted in Travis County in 2024 (11,963 in 5+ unit buildings).
Forward outlook
- Local home prices are declining (-3.0%/yr); year-one equity from $725 of loan paydown is wiped out by about $3k of value loss. Plan a longer hold.
- Travis County population projected at +60% by 2050 — long-run rental-demand tailwind backs the buy-and-hold thesis.
- At projected returns (-3.0% appreciation + 1.3% rent growth), your $29k cash investment doubles in ~7 years — after that, you're playing with house money.
Negotiation context
- It's been on market 71 days — a 6% lower offer ($99k) is reasonable based on typical stale-listing flexibility.
Risks & watch-outs
- Climate carrying-cost: severe wind risk, 80% chance of damaging wind over 30y; extreme-heat days projected 7→23/yr by 2055 (HVAC capex compounding) — expect insurance premiums to compound above CPI over the hold.
Questions for the listing agent
- It's been on market 71 days. Have you received any prior offers? Is the seller open to a 6% concession, seller financing, or rate buy-down credit?
- Have any recent inspections been done? Can we get a copy of the seller's disclosures and any deferred-maintenance estimates?
- Built in 1973 — when were the roof, HVAC, electrical panel, plumbing, and water heater last replaced?
- Any open or pending special assessments — roof, HVAC, plumbing, elevator, façade? What's the per-unit balance and payoff schedule, and is the seller paying it off at close or rolling it to the buyer?
- Why hasn't it sold? Are there any deal-killer items the seller is aware of (foundation, flood, title, zoning, code violations)?
- Is there a deadline driving the sale (1031 exchange, divorce, estate, relocation)? That informs how much negotiation room exists.
- Crime grade is F in this area — have there been break-ins, vandalism, or insurance claims at this property in the last 3 years? What carrier currently insures it and at what premium?
- What's the average days-on-market for RENTAL listings here right now (not sales)? A rising rental-DOM trend means longer vacancies and softer asking-rent achievability than the comps imply.
- What's the recent tenant-quality profile in this submarket — average credit score on applications, eviction rate, late-payment / NSF rate, and stable-employment percentage? A property-management company in the area should have these aggregated.
- How much new apartment / multifamily construction is in the pipeline within 1–3 miles? Heavy new supply (>2% of stock underway) typically softens rents 12–24 months out; light construction supports rent growth.
Investment metrics
- 1% rule
- 1.53% ✓
- Cap rate
- 12.52%
- Cash-on-cash
- 22.25%
- DSCR
- 1.99
- GRM
- 5.4
CMA / ARV
- ARV (median comp)
- $258,027
- List price
- $104,900
- Delta
- -59.35%
- Verdict
- UNDERPRICED
- Comps
- 20 within 1.0 mi
Projected returns pro-forma
-3.0% appreciation · 1.3% rent growth · sell at horizon
- IRR
- 13.1%
- Equity multiple
- 1.51×
- Total profit
- $15,013
- Equity at exit
- $15,641
- IRR
- 20.6%
- Equity multiple
- 2.60×
- Total profit
- $47,122
- Equity at exit
- $9,070
Cash invested: $29,372 (down + closing). Projections, not guarantees.
Landlord ↔ Tenant lean methodology
- Overall (STATE)
- 87 Strongly Landlord-Friendly
- State Texas
- 87 Strongly Landlord-Friendly · R+5
- County
- — inherits STATE
- City
- — inherits STATE
ZIP-level market 78757
- Rents YoY
- 1.3%
- Active inventory
- 206
- Price-to-rent
- 5.4×
Monthly cashflow live
- Estimated rent
- $1,607 high interval (Pro) →
- Mortgage (P&I)
- −$550
- Tax est. 1.5%
- −$131 /mo · $1,574/yr
- Insurance
- −$44
- HOA
- −$0
- Vacancy / Maint / Mgmt
- −$337
- Net cashflow
- $545
Break-even live
UW: 25.0% down · 7.5% · 30yr · 1.5% tax · 5.0% vac · 8.0% maint · 8.0% mgmt
Financing live
Cash to close
- Down payment
- $26,225
- Closing costs
- $3,147
- Reserves months
- —
- Total cash needed
- —
Loan-product check · same deal, 3 products live
Conventional
25% down · 7.5% · 30yr
- Down + closing
- —
- Monthly P&I
- —
- Monthly cashflow
- —
- DSCR
- —
- Eligible?
- —
Personal DTI + credit; lowest rate.
DSCR
20% down · 8.5% · 30yr
- Down + closing
- —
- Monthly P&I
- —
- Monthly cashflow
- —
- DSCR
- —
- Eligible?
- —
No personal income docs; deal must DSCR.
Hard money
10% down · 12.0% · 12mo
- Down + closing
- —
- Monthly P&I
- —
- Monthly cashflow
- —
- DSCR
- —
- Eligible?
- —
Short-term bridge; refi at stabilization.
Rent comps 40 comps
| Address | Beds | Baths | Sqft | Rent | $/sqft | DOM | Units | Dist |
|---|---|---|---|---|---|---|---|---|
| 1908 Hearthstone Dr Unit 104 Austin, TX | 2.0 | 1.5 | 1012 | $1,499 | $1.48 | 43d | 1 | 0.07mi |
| 1911 Hearthstone Dr Unit 1 Austin, TX | 2.0 | 2.0 | 1096 | $1,045 | $0.95 | 14d | 1 | 0.07mi |
| 1913 Hearthstone Dr Unit B Austin, TX | 2.0 | 1.5 | 1110 | $1,595 | $1.44 | 23d | 1 | 0.09mi |
| 1901 Joy Ln Austin, TX | 2.0 | 1.0 | 875 | $1,500 | $1.71 | 43d | 1 | 0.10mi |
| 8602 Fireside Dr Austin, TX | 3.0 | 1.0 | 875 | $1,095 | $1.25 | 43d | 1 | 0.15mi |
| 8616 Fireside Dr Unit B Austin, TX | 3.0 | 2.0 | 1042 | $1,495 | $1.43 | 4d | 1 | 0.19mi |
| 8624 Fireside Dr Austin, TX | 2.0 | 1.0 | 800 | $1,150 | $1.44 | 3d | 2 | 0.21mi |
| 1748 Ohlen Rd Austin, TX | 1.0–2.0 | 1.0–2.0 | 982 | $1,895 | $1.93 | 16d | 2 | 0.22mi |
| 8940 Research Blvd Austin, TX | 1.0 | 1.0 | 727 | $1,625 | $2.24 | 23d | 1 | 0.27mi |
| 8600 Hathaway Dr Austin, TX | 2.0 | 1.0 | 864 | $2,195 | $2.54 | 23d | 1 | 0.32mi |
| 8516 Hathaway Dr Unit 2 Austin, TX | 2.0 | 1.0 | 823 | $1,995 | $2.42 | 4d | 1 | 0.32mi |
| 9024 Northgate Blvd Austin, TX | 1.0–2.0 | 1.0–2.0 | 782 | $1,598 | $2.04 | 4d | 70 | 0.35mi |
| 1523 Weyford Dr Austin, TX | 3.0 | 2.0 | 1410 | $2,295 | $1.63 | 21d | 1 | 0.38mi |
| 1523 Weyford Dr Austin, TX | 3.0 | 2.0 | 1410 | $2,295 | $1.63 | 23d | 1 | 0.38mi |
| 1517 Weyford Dr Austin, TX | 3.0 | 2.0 | 1388 | $2,755 | $1.98 | 16d | 1 | 0.40mi |
| 1517 Weyford Dr Austin, TX | 3.0 | 2.0 | 1388 | $2,755 | $1.98 | 10d | 1 | 0.40mi |
| 9100 Metric Blvd Austin, TX | 2.0 | 1.0–2.0 | 934 | $2,841 | $3.04 | 1d | 61 | 0.45mi |
| 8530 Burnet Rd Austin, TX | 2.0 | 2.0 | 960 | $1,405 | $1.46 | 43d | 1 | 0.46mi |
| 2005 West Loop Unit D-2 Austin, TX | 2.0 | 2.0 | 1025 | $1,295 | $1.26 | 43d | 1 | 0.46mi |
| 1908 West Loop Unit A Austin, TX | 2.0 | 1.0 | 977 | $900 | $0.92 | 43d | 1 | 0.46mi |
| 2009 West Loop Unit A Austin, TX | 2.0 | 2.0 | 1013 | $1,350 | $1.33 | 23d | 1 | 0.48mi |
| 2009 West Loop Unit D Austin, TX | 2.0 | 2.0 | 1013 | $1,250 | $1.23 | 1d | 1 | 0.48mi |
| 2011 West Loop Apt C Austin, TX | 2.0 | 2.0 | 1025 | $1,125 | $1.10 | 43d | 1 | 0.49mi |
| 2212 Lanier Dr Austin, TX | 2.0 | 1.0 | 1000 | $1,695 | $1.70 | 1d | 1 | 0.49mi |
| 1902 West Loop Unit A-1 Austin, TX | 2.0 | 1.0 | 1005 | $1,100 | $1.09 | 43d | 1 | 0.49mi |
| 8528 Burnet Rd Austin, TX | 3.0 | 1.0–2.0 | 1021 | $2,602 | $2.55 | 2d | 42 | 0.49mi |
| 9209 Northgate Blvd Austin, TX | 1.0–2.0 | 1.0 | 700 | $1,099 | $1.57 | 3d | 8 | 0.50mi |
| 8621 Rockwood Ln Austin, TX | 2.0 | 2.0 | 1000 | $1,450 | $1.45 | 43d | 1 | 0.53mi |
| 8206 Exmoor Dr Unit A Austin, TX | 3.0 | 2.0 | 1251 | $2,100 | $1.68 | 43d | 1 | 0.53mi |
| 2301 Ohlen Rd Unit 112 Austin, TX | 2.0 | 1.0 | 800 | $1,050 | $1.31 | 43d | 1 | 0.53mi |
| 2301 Ohlen Rd Unit 108 Austin, TX | 3.0 | 2.0 | 1150 | $1,399 | $1.22 | 4d | 1 | 0.53mi |
| 8615 Rockwood Ln Austin, TX | 1.0–2.0 | 1.0–2.0 | 780 | $1,795 | $2.30 | 43d | 14 | 0.53mi |
| 2600 Penny Ln Austin, TX | 1.0–2.0 | 1.0–2.0 | 729 | $1,399 | $1.92 | 4d | 2 | 0.53mi |
| 2601 Penny Ln Unit ABB-1-304 Austin, TX | 1.0 | 1.0 | 750 | $1,245 | $1.66 | 43d | 1 | 0.54mi |
| 8524 Burnet Rd Austin, TX | 1.0–2.0 | 1.0–2.0 | 755 | $1,485 | $1.97 | 3d | 7 | 0.55mi |
| 2601 Penny Ln Unit 103 Austin, TX | 1.0 | 1.0 | 750 | $1,170 | $1.56 | 43d | 1 | 0.56mi |
| 2018 W Rundberg Ln Austin, TX | 2.0 | 2.5 | 1105 | $1,622 | $1.47 | 43d | 4 | 0.57mi |
| 2018 W Rundberg Ln Austin, TX | 2.0 | 2.5 | 1105 | $1,450 | $1.31 | 2d | 2 | 0.57mi |
| 1830 W Rundberg Ln Austin, TX | 2.0 | 1.0 | 600 | $1,099 | $1.83 | 4d | 65 | 0.59mi |
| 1830 W Rundberg Ln Unit 1887 Austin, TX | 2.0 | 2.0 | 750 | $1,364 | $1.82 | 12d | 1 | 0.59mi |
HOA detail condo
- Monthly dues
- $0 · $0/yr
- Assessments
- None detected in remarks — confirm with the listing agent.
Listing history 15 events
-
2026-06-18days on market $104,900 Active 71 DOM
-
2026-06-17days on market $104,900 Active 70 DOM
-
2026-06-16days on market $104,900 Active 69 DOM
-
2026-06-15days on market $104,900 Active 68 DOM
-
2026-06-13days on market $104,900 Active 66 DOM
-
2026-06-10price $104,900 Active 62 DOM
-
2026-06-09days on market $119,900 Active 62 DOM
-
2026-06-08days on market $119,900 Active 61 DOM
-
2026-06-07days on market $119,900 Active 60 DOM
-
2026-06-05days on market $119,900 Active 57 DOM
-
2026-06-03days on market $119,900 Active 56 DOM
-
2026-06-02days on market $119,900 Active 55 DOM
-
2026-06-01days on market $119,900 Active 54 DOM
-
2026-05-31days on market $119,900 Active 53 DOM
-
2026-05-11price $119,900 307-char remark
Show marketing remark (307 chars)
Great location for this 2-bedroom condo, just minutes from vibrant nightlife, restaurants, and shopping. Don’t miss out—this one won’t last long. To help visualize this homes floor plan and to highlight its potential virtual furnishings may have been added to photos found in this listing.
ⓘ Source: listings_history table (triggers on properties + properties_extension) + one-shot
backfill from property_details.listing_events for pre-trigger history.
Climate risk First Street
- Flood 1/10 Low FEMA zone X (unshaded) · 0% chance over 30 yrs
- Wildfire 1/10 Low
- Heat 8/10 Severe 7 d/yr ≥108°F today · 23 d/yr by 30 yrs out
- Wind 8/10 Severe 80% chance of damaging wind over 30 yrs
- Air quality 2/10 Low 1 unhealthy d/yr today · 1 by 30 yrs out
Nearby sold comps map
Loading sold comps map…
Walkable amenities ~0.75 mi
Loading nearby amenities…
Taxation est. · year 1
- Rental income
- $19,285
- − Mortgage interest
- −$5,876
- − Property taxes
- −$1,574
- − Insurance
- −$524
- − Repairs & maintenance
- −$1,543
- − Management
- −$1,543
- − Depreciation
- −$3,052
- Taxable income
- $5,174
- Est. tax owed @ 24.0%
- −$1,242
- After-tax cash flow
- $5,294/yr
For passive investors: Depreciation is non-cash, so a rental often shows a tax loss while cash-flowing — sheltering income. Rental losses are passive: they offset passive income freely, and up to $25,000/yr can offset ordinary (W-2) income if you actively participate and your MAGI is under $100k (phasing out to $0 by $150k); unused losses carry forward. On sale, claimed depreciation is recaptured at up to 25%, and gains may owe capital-gains tax (a 1031 exchange can defer both). Figures are a year-1 estimate at your 24.0% rate — not tax advice; consult a CPA.
Condition & rehab AI · 12 photos
This townhouse requires moderate renovations to improve its condition and increase its value. Key areas for improvement include the kitchen, bathrooms, and flooring. Upgrading these areas can significantly enhance the home's appeal and value.
Repairs flagged
- Major kitchen cabinets — Significant wear and tear.
- Major kitchen countertops — Dated and in poor condition.
- Major kitchen appliances — Old and outdated appearance.
- Major bathroom fixtures — Dated and in poor condition.
- Minor kitchen flooring — Carpet is in good condition but could be replaced for a fresh look.
Value-add opportunities
- Both Paint interior walls — Fresh paint can make a significant difference in the home's appearance and value.
- Both Replace kitchen cabinets — New cabinets can greatly enhance the kitchen's functionality and aesthetic appeal.
- Both Upgrade kitchen countertops — Modern countertops can improve the kitchen's functionality and increase its value.
- Both Replace kitchen appliances — Upgrading to new, energy-efficient appliances can improve the home's functionality and increase its value.
- Both Upgrade bathroom fixtures — New fixtures can improve the bathroom's functionality and increase its value.
- Both Replace carpet with hardwood flooring — Hardwood flooring can increase the home's value and make it more appealing to potential buyers or renters.
Renovation cost estimate screening
| Repair item | Severity | Est. cost |
|---|---|---|
| kitchen cabinets · Significant wear and tear. | Major | $15,000–50,000 |
| kitchen countertops · Dated and in poor condition. | Major | $15,000–50,000 |
| kitchen appliances · Old and outdated appearance. | Major | $15,000–50,000 |
| bathroom fixtures · Dated and in poor condition. | Major | $15,000–50,000 |
| kitchen flooring · Carpet is in good condition but could be replaced for a fresh look. | Minor | $500–3,000 |
| Total estimated repair cost · 5 items | $60,500–203,000 |
Value-add ROI direction
- Both Paint interior walls — Fresh paint can make a significant difference in the home's appearance and value. ↑
- Both Replace kitchen cabinets — New cabinets can greatly enhance the kitchen's functionality and aesthetic appeal. ↑
- Both Upgrade kitchen countertops — Modern countertops can improve the kitchen's functionality and increase its value. ↑
- Both Replace kitchen appliances — Upgrading to new, energy-efficient appliances can improve the home's functionality and increase its value. ↑
- Both Upgrade bathroom fixtures — New fixtures can improve the bathroom's functionality and increase its value. ↑
- Both Replace carpet with hardwood flooring — Hardwood flooring can increase the home's value and make it more appealing to potential buyers or renters. ↑
ⓘ Cost ranges are severity-bucket heuristics (US national rule-of-thumb). Get contractor quotes + a written scope before underwriting a rehab budget.
Schools (NCES district)
- District
- Austin ISD
- NCES district ID
- 4808940
- Math proficiency
- 33% ▼ -19.00%
- Reading proficiency
- 44% ▼ -7.00%
- Median HH income
- $54,627
- Composite
- 33.65/100
- National rank
- #5397
- State rank
- #431 of 826 in TX
Livability — Austin
- Score
- 82/100
- State rank
- #16
- US rank
- #1208
Category grades
Schools grade is shown separately in the Schools card above.
Census & demographics
- Census place
- Austin, TX
- County
- Travis County · 1,299,254 people
- City population
- 1,066,854
- Metro
- Austin-Round Rock-Georgetown, TX
- Population (ZIP)
- 23,856
- Household income
- $103,860
- Rent vs Own
- Severe rent burden
- 763.0
Population outlook (Travis County) Hauer SSP2
- Today (2025)
- 1,545,133 people
- By 2030
- 1,729,269 · +11.9%
- By 2040
- 2,097,596 · +35.8%
- By 2050
- 2,463,890 · +59.5%
- By 2075
- 3,249,374 · +110.3%
- By 2100
- 3,801,868 · +146.1%
Race, ethnicity, and origin ACS 2023
- Neighborhood character
- Predominantly White (67%)
- Race & ethnicity
- White 67% Hispanic / Latino 20% Two or more races 16% Asian 4% Black 4%
- Hispanic origin (detail)
- Mexican 16%
- Common ancestry
- Lithuanian 3% Scotch-Irish 3% Slovak 3%
- Foreign-born
- 10% · Canada, South Korea, China
- Languages at home
- 80% English-only · Spanish 15% Other Indo-European 1% Other Asian/Pacific 1%
Political lean MEDSL · Travis
- 2024 margin
- Solid D (+39.3) · D 68.8% · R 29.4% · Other 1.8%
- 2008→2024 swing
- +9.9pp toward D · 2008: 29.4pp · 2024: 39.3pp
- All cycles
- 2024: D+39.3 2020: D+45.0 2016: D+38.9 2012: D+23.9 2008: D+29.4
Not yet ingested
- Civics
- —
Market trends
- HPI YoY
- ▼ -896.70%
- Current HPI
- 242.6248
- Rent YoY
- ▲ 1.30%
- Metro
- Austin-Round Rock-Georgetown, TX
- State GDP YoY
- ▲ 3.95%
- F500 in state
- 110
Industry mix (Fortune 500 HQ in TX)
| Industry | F500 HQs | Revenue |
|---|---|---|
| Energy | 16 | $1,198B |
|
||
| Technology | 5 | $198B |
|
||
| Engineering / Construction | 4 | $72B |
|
||
| Energy Services | 3 | $60B |
|
||
| Utilities | 3 | $41B |
|
||
| Healthcare | 2 | $330B |
|
||
Price history
1 event — show timeline
- 2026-05-11 Price Changed $119,900 Unlock MLS
Cash-flow waterfall
monthlySold comps — $/sqft
last 12 mo · ≤1 miLoading sold comps…