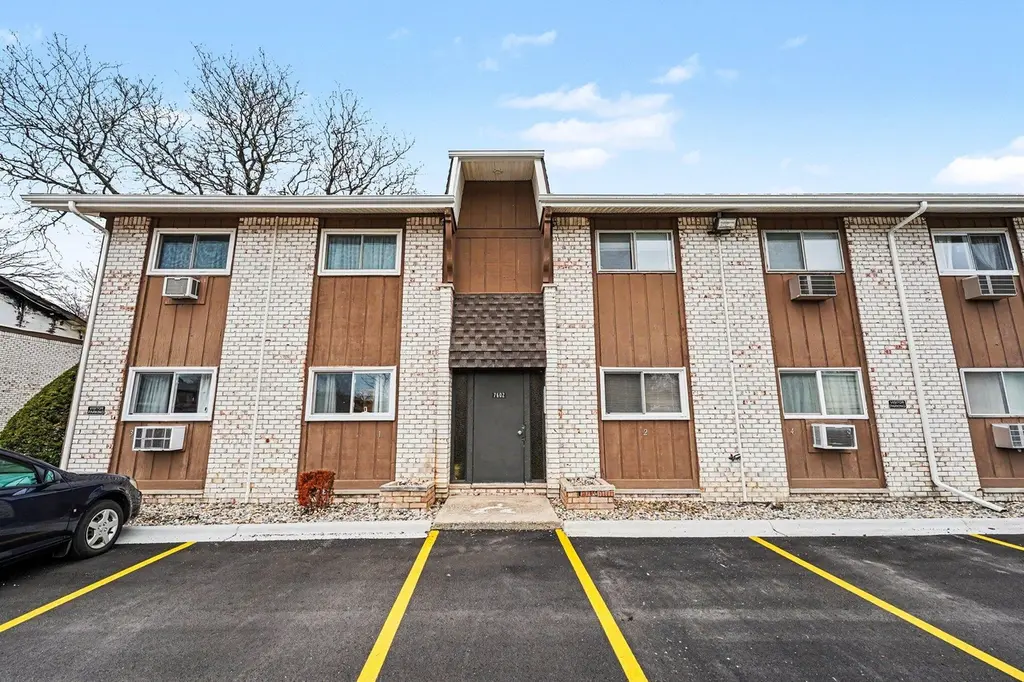
7602 Woodview St #1 · Westland, MI
Flood risk No data
- FEMA flood zone
- —
- Chance of flooding over 30 yrs
- —
- Est. flood insurance / yr
- —
Fire risk No data
- Est. fire insurance / yr
- —
Heat risk No data
- Hot days now (above threshold)
- —
- Hot days in 30 yrs
- —
Wind risk No data
- Chance of severe wind over 30 yrs
- —
Air-quality risk No data
- Unhealthy air days now
- —
- Unhealthy air days in 30 yrs
- —
Risk factors via First Street. Map © Google.
Why this score? — see what drove the D grade
The composite is a weighted blend of 9 inputs, each scored 0–100. Each bar is that input's sub-score; the figure is the points it added to the 100-point composite (weight × sub-score).
- Cash flow +10.5/30.0
- ARV discount +7.5/15.0
- 1% rule +6.4/10.0
- Schools +4.6/10.0
- Livability +3.9/5.0
- DSCR +3.0/10.0
- Rent growth +2.5/5.0
- Condition / age +2.5/5.0
- Appreciation +0.0/10.0
$120,000
🖨 Deal sheet 📄 Offer letter ✓ Due diligence
Listing remarks MLS
Move-in ready and beautifully updated, this inviting apartment features modern finishes throughout. Enjoy durable laminate flooring, a spacious living room, and an open, functional kitchen complete with new cabinets, countertops, and stainless steel appliances. The remodeled bathrooms and new insulated windows add both comfort and efficiency. Conveniently located near shopping centers, restaurants, and grocery stores, and within the Livonia school district.
Key facts
- $370 HOA
- Community pool
- Built 1970
Property features AI
Finance
- HOA & community: Monthly association fee; Association amenities include pool and tennis courts; Association fee covers water, trash, snow removal, and lawn/yard care
Exterior
- Utilities: Public water
- Home design: Residential condominium; Other architectural style
- Construction: Built in 1970; Brick and wood siding construction
- Exterior features: Corner lot; Pond on property; Paved road access
Interior
- Kitchen: Dishwasher; Microwave; Oven; Refrigerator; Kitchen (10 x 11)
- Bedrooms: Primary bedroom (12 x 18); Second bedroom (10 x 15)
- Bathrooms: Two full bathrooms; Primary bathroom (6 x 10); Second bathroom (6 x 7)
- Heating & cooling: Baseboard heating; Wall-mounted cooling unit(s)
- Interior features: Five total rooms; Basement is slab
Neighborhood map
What this means for you Summary
Snapshot
- This is a 2-bed/1.0-bath condo listed at $120k.
Deal economics
- At list price, monthly cash flow is $-62 ($-744/yr) — negative.
- To cash-flow at today's rent, offer at most $109k (9.1% below list).
- Meets the 1% rule at list price ($1k rent vs $120k).
- Recommended offer: $109k (9.1% below list) — sets the bar for cash-flow.
- Cap rate 5.7% vs local median 4.5% in Westland — meaningfully above typical; check what's discounted (condition, days-on-market, listing class) to confirm the premium yield is real.
Location & tenants
- Location reads 77/100 on livability (#124 in MI, #3,067 nationally) — a middle-class / working-renter tenant base. Strengths: commute A+, cost of living A+, housing A+; Watch: amenities C-, employment C-, crime D+.
- Livonia Public Schools School District (urban): math 46% / reading 59% proficiency, ranked #77 of 540 in MI (top 14%) — acceptable for families but not a draw, mixed tenant base, ~2y average lease.
- Market conditions: Rents flat; 161 active listings in the ZIP; 17 comparable units currently listed for rent nearby; rentals leasing fast (median 4d on market — plan ~1-2 weeks tenant-placement turnaround); 2,639 units permitted in Wayne County in 2024 (1,216 in 5+ unit buildings).
Forward outlook
- Local home prices are declining (-3.0%/yr); year-one equity from $830 of loan paydown is wiped out by about $4k of value loss. Plan a longer hold.
- Wayne County population projected at -17% by 2050 — secular population decline; favor cash flow + early exit over multi-decade hold.
Negotiation context
- It's been on market 59 days — a 3% lower offer ($116k) is reasonable based on typical stale-listing flexibility.
- 3 sale attempts with the ask held roughly flat each time — persistent listings suggest the price (not the market) is what's stuck; bring a comps-based counter.
- Current owner paid $24k; list at $120k implies a 398% gain — meaningful room to come down on a strong offer.
Risks & watch-outs
- Watch-outs: HOA is 27% of rent.
Questions for the listing agent
- What do current leases actually rent for vs. the listed asking? Can we see a recent rent roll and the last 12 months of T-12 income?
- It's been on market 59 days. Have you received any prior offers? Is the seller open to a 9% concession, seller financing, or rate buy-down credit?
- Built in 1970 — when were the roof, HVAC, electrical panel, plumbing, and water heater last replaced?
- What does the HOA fee cover, when was the last increase, and are there any pending special assessments or reserve-fund shortfalls?
- Any open or pending special assessments — roof, HVAC, plumbing, elevator, façade? What's the per-unit balance and payoff schedule, and is the seller paying it off at close or rolling it to the buyer?
- Is there a deadline driving the sale (1031 exchange, divorce, estate, relocation)? That informs how much negotiation room exists.
- Schools are D-rated, which usually means shorter tenancies and higher turnover. Who's the typical renter profile here, and what's been the actual vacancy rate?
- Crime grade is D in this area — have there been break-ins, vandalism, or insurance claims at this property in the last 3 years? What carrier currently insures it and at what premium?
- The area grade is low — what's the realistic commute time and amenity access for the typical tenant pool here? Any planned neighborhood developments (good or bad) we should know about?
- What's the average days-on-market for RENTAL listings here right now (not sales)? A rising rental-DOM trend means longer vacancies and softer asking-rent achievability than the comps imply.
- What's the recent tenant-quality profile in this submarket — average credit score on applications, eviction rate, late-payment / NSF rate, and stable-employment percentage? A property-management company in the area should have these aggregated.
- How much new apartment / multifamily construction is in the pipeline within 1–3 miles? Heavy new supply (>2% of stock underway) typically softens rents 12–24 months out; light construction supports rent growth.
Investment metrics
- 1% rule
- 1.14% ✓
- Cap rate
- 5.67%
- Cash-on-cash
- -2.21%
- DSCR
- 0.90
- GRM
- 7.3
CMA / ARV
No comps found within radius.
Projected returns pro-forma
-3.0% appreciation · 0.17% rent growth · sell at horizon
- IRR
- -24.3%
- Equity multiple
- 0.20×
- Total profit
- $-26,955
- Equity at exit
- $17,892
- IRR
- -37.8%
- Equity multiple
- -0.26×
- Total profit
- $-42,327
- Equity at exit
- $10,375
Cash invested: $33,600 (down + closing). Projections, not guarantees.
Landlord ↔ Tenant lean methodology
- Overall (STATE)
- 62 Landlord-Friendly
- State Michigan
- 62 Landlord-Friendly · EVEN
- County
- — inherits STATE
- City
- — inherits STATE
ZIP-level market 48185
- Rents YoY
- 0.2%
- Active inventory
- 161
- Price-to-rent
- 7.3×
Monthly cashflow live
- Estimated rent
- $1,362 high interval (Pro) →
- Mortgage (P&I)
- −$629
- Tax from tax record
- −$89 /mo · $1,066/yr
- Insurance
- −$50
- HOA
- −$370
- Vacancy / Maint / Mgmt
- −$286
- Net cashflow
- $-62
Break-even live
UW: 25.0% down · 7.5% · 30yr · 1.5% tax · 5.0% vac · 8.0% maint · 8.0% mgmt
Financing live
Cash to close
- Down payment
- $30,000
- Closing costs
- $3,600
- Reserves months
- —
- Total cash needed
- —
Loan-product check · same deal, 3 products live
Conventional
25% down · 7.5% · 30yr
- Down + closing
- —
- Monthly P&I
- —
- Monthly cashflow
- —
- DSCR
- —
- Eligible?
- —
Personal DTI + credit; lowest rate.
DSCR
20% down · 8.5% · 30yr
- Down + closing
- —
- Monthly P&I
- —
- Monthly cashflow
- —
- DSCR
- —
- Eligible?
- —
No personal income docs; deal must DSCR.
Hard money
10% down · 12.0% · 12mo
- Down + closing
- —
- Monthly P&I
- —
- Monthly cashflow
- —
- DSCR
- —
- Eligible?
- —
Short-term bridge; refi at stabilization.
Rent comps 17 comps
| Address | Beds | Baths | Sqft | Rent | $/sqft | DOM | Units | Dist |
|---|---|---|---|---|---|---|---|---|
| 7344 Drew Cir Westland, MI | 2.0 | 1.0 | 900 | $1,350 | $1.50 | 1d | 7 | 0.14mi |
| 7640 Woodview St #1 Westland, MI | 2.0 | 2.0 | 1037 | $1,385 | $1.34 | 24d | 1 | 0.14mi |
| 7000 Lakeview Blvd Westland, MI | 1.0–2.0 | 1.0 | 752 | $1,294 | $1.72 | 2d | 61 | 0.46mi |
| 7500 N Newburgh Rd Westland, MI | 1.0–2.0 | 1.0–2.0 | 843 | $1,868 | $2.21 | 1d | 9 | 0.47mi |
| 6930 Yale St Unit 5 Westland, MI | 1.0 | 1.0 | 600 | $950 | $1.58 | 16d | 1 | 0.59mi |
| 37410 Fountain Park Cir Westland, MI | 1.0–2.0 | 1.0–2.0 | 932 | $1,755 | $1.88 | 1d | 17 | 0.67mi |
| 6501 Yale St Westland, MI | 1.0–2.0 | 1.0 | 746 | $1,129 | $1.51 | 5d | 5 | 0.72mi |
| 6737 N Wayne Rd Westland, MI | 1.0–2.0 | 1.0–1.5 | 850 | $1,375 | $1.62 | 4d | 6 | 0.75mi |
| 8181 N Wayne Rd Westland, MI | 2.0 | 1.0 | 800 | $1,225 | $1.53 | 16d | 1 | 0.77mi |
| 8300 Woodcrest Dr Westland, MI | 1.0–2.0 | 1.0 | 900 | $1,285 | $1.43 | 5d | 10 | 0.78mi |
| 37670 Dale Dr Westland, MI | 1.0–2.0 | 1.0–1.5 | 760 | $1,460 | $1.92 | 1d | 10 | 0.86mi |
| 37830 Westwood Cir Westland, MI | 2.0 | 1.0 | 925 | $1,412 | $1.53 | 1d | 10 | 1.09mi |
| 6200 N Wayne Rd Westland, MI | 2.0 | 1.0 | 748 | $1,200 | $1.60 | 43d | 1 | 1.13mi |
| 34601 Elmwood St Westland, MI | 1.0 | 1.0 | 573 | $1,348 | $2.35 | 17d | 1 | 1.14mi |
| 5800 N Christine Westland, MI | 1.0–2.0 | 1.0–2.0 | 910 | $1,340 | $1.47 | 1d | 8 | 1.28mi |
| 5995 N Wildwood St Westland, MI | 2.0 | 1.0 | 960 | $1,084 | $1.13 | 43d | 1 | 1.34mi |
| 2024 Imperial Hwy Westland, MI | 3.0 | 1.0 | 1008 | $1,600 | $1.59 | 1d | 1 | 1.43mi |
HOA detail condo
- Monthly dues
- $370 · $4,440/yr
- Assessments
- None detected in remarks — confirm with the listing agent.
Listing history 20 events
-
2026-06-18days on market $120,000 Active 59 DOM
-
2026-06-17days on market $120,000 Active 58 DOM
-
2026-06-16days on market $120,000 Active 57 DOM
-
2026-06-15price $120,000 Active 56 DOM
-
2026-06-15days on market $124,000 Active 56 DOM
-
2026-06-13days on market $124,000 Active 54 DOM
-
2026-06-09days on market $124,000 Active 50 DOM
-
2026-06-08days on market $124,000 Active 49 DOM
-
2026-06-07days on market $124,000 Active 48 DOM
-
2026-06-04days on market $124,000 Active 45 DOM
-
2026-06-03days on market $124,000 Active 44 DOM
-
2026-06-02days on market $124,000 Active 43 DOM
-
2026-06-01days on market $124,000 Active 42 DOM
-
2026-05-31days on market $124,000 Active 41 DOM
-
2026-04-20$125,000 Active 461-char remark
Show marketing remark (461 chars)
Move-in ready and beautifully updated, this inviting apartment features modern finishes throughout. Enjoy durable laminate flooring, a spacious living room, and an open, functional kitchen complete with new cabinets, countertops, and stainless steel appliances. The remodeled bathrooms and new insulated windows add both comfort and efficiency. Conveniently located near shopping centers, restaurants, and grocery stores, and within the Livonia school district.
-
2026-04-20$125,000 Active
Show marketing remark (461 chars)
Move-in ready and beautifully updated, this inviting apartment features modern finishes throughout. Enjoy durable laminate flooring, a spacious living room, and an open, functional kitchen complete with new cabinets, countertops, and stainless steel appliances. The remodeled bathrooms and new insulated windows add both comfort and efficiency. Conveniently located near shopping centers, restaurants, and grocery stores, and within the Livonia school district.
-
2026-04-20$125,000 Active 461-char remark
Show marketing remark (461 chars)
Move-in ready and beautifully updated, this inviting apartment features modern finishes throughout. Enjoy durable laminate flooring, a spacious living room, and an open, functional kitchen complete with new cabinets, countertops, and stainless steel appliances. The remodeled bathrooms and new insulated windows add both comfort and efficiency. Conveniently located near shopping centers, restaurants, and grocery stores, and within the Livonia school district.
-
2026-04-18historical $125,000 461-char remark
Show marketing remark (461 chars)
Move-in ready and beautifully updated, this inviting apartment features modern finishes throughout. Enjoy durable laminate flooring, a spacious living room, and an open, functional kitchen complete with new cabinets, countertops, and stainless steel appliances. The remodeled bathrooms and new insulated windows add both comfort and efficiency. Conveniently located near shopping centers, restaurants, and grocery stores, and within the Livonia school district.
-
2026-04-18historical $125,000
Show marketing remark (461 chars)
Move-in ready and beautifully updated, this inviting apartment features modern finishes throughout. Enjoy durable laminate flooring, a spacious living room, and an open, functional kitchen complete with new cabinets, countertops, and stainless steel appliances. The remodeled bathrooms and new insulated windows add both comfort and efficiency. Conveniently located near shopping centers, restaurants, and grocery stores, and within the Livonia school district.
-
2016-01-28soldstatus $24,100
ⓘ Source: listings_history table (triggers on properties + properties_extension) + one-shot
backfill from property_details.listing_events for pre-trigger history.
Tax reassessment forecast MI · Partial reset (capped growth)
- Current annual tax
- $1,066 · $89/mo
- Projected year-2 tax
- $1,457 · $121/mo
- Expected delta
- +$391/yr (+$33/mo · 36.6%)
ⓘ Screening estimate from a state-policy table — verify with the county assessor before closing.
Nearby sold comps map
Loading sold comps map…
Walkable amenities ~0.75 mi
Loading nearby amenities…
Taxation est. · year 1
- Rental income
- $16,347
- − Mortgage interest
- −$6,722
- − Property taxes
- −$1,066
- − Insurance
- −$600
- − Repairs & maintenance
- −$1,308
- − Management
- −$1,308
- − HOA
- −$4,440
- − Depreciation
- −$3,491
- Taxable loss
- −$2,588
- Est. tax savings @ 24.0%
- +$621
- After-tax cash flow
- $-123/yr
For passive investors: Depreciation is non-cash, so a rental often shows a tax loss while cash-flowing — sheltering income. Rental losses are passive: they offset passive income freely, and up to $25,000/yr can offset ordinary (W-2) income if you actively participate and your MAGI is under $100k (phasing out to $0 by $150k); unused losses carry forward. On sale, claimed depreciation is recaptured at up to 25%, and gains may owe capital-gains tax (a 1031 exchange can defer both). Figures are a year-1 estimate at your 24.0% rate — not tax advice; consult a CPA.
Schools (NCES district)
- District
- Livonia Public Schools School District
- NCES district ID
- 2621840
- Math proficiency
- 46% ▼ -5.00%
- Reading proficiency
- 59% ▬ 0.00%
- Median HH income
- $65,268
- Composite
- 46.27/100
- National rank
- #2480
- State rank
- #77 of 540 in MI
Livability — Westland
- Score
- 77/100
- State rank
- #124
- US rank
- #3067
Category grades
Schools grade is shown separately in the Schools card above.
Census & demographics
- Census place
- Westland, MI
- County
- Wayne County · 1,562,939 people
- City population
- 83,633
- Metro
- Detroit-Warren-Dearborn, MI
- Population (ZIP)
- 48,530
- Household income
- $60,854
- Rent vs Own
- Severe rent burden
- 2263.0
Population outlook (Wayne County) Hauer SSP2
- Today (2025)
- 1,675,273 people
- By 2030
- 1,620,300 · -3.3%
- By 2040
- 1,502,341 · -10.3%
- By 2050
- 1,384,039 · -17.4%
- By 2075
- 1,124,592 · -32.9%
- By 2100
- 881,193 · -47.4%
Race, ethnicity, and origin ACS 2023
- Neighborhood character
- Diverse neighborhood (Simpson 0.56)
- Race & ethnicity
- White 63% Black 22% Two or more races 7% Asian 5% Hispanic / Latino 5%
- Common ancestry
- Romanian 11% Lithuanian 3% Italian 2%
- Foreign-born
- 11% · Canada, China
- Languages at home
- 87% English-only · Other Indo-European 5% Arabic 2% Spanish 2%
Political lean MEDSL · Wayne
- 2024 margin
- Strong D (+29.0) · D 62.7% · R 33.7% · Other 3.6%
- 2008→2024 swing
- -20.5pp toward R · 2008: 49.5pp · 2024: 29.0pp
- All cycles
- 2024: D+29.0 2020: D+38.1 2016: D+37.3 2012: D+46.9 2008: D+49.5
Not yet ingested
- Civics
- —
Market trends
- HPI YoY
- ▼ -265.65%
- Current HPI
- 237.7594
- Rent YoY
- ▲ 0.17%
- Metro
- Detroit-Warren-Dearborn, MI
- State GDP YoY
- ▲ 1.37%
- F500 in state
- 28
Industry mix (Fortune 500 HQ in MI)
| Industry | F500 HQs | Revenue |
|---|---|---|
| Automotive Parts | 3 | $48B |
|
||
| Automotive | 2 | $372B |
|
||
| Chemicals | 1 | $45B |
|
||
| Automotive Retail | 1 | $29B |
|
||
| Healthcare / Medical Devices | 1 | $23B |
|
||
| Automotive Technology | 1 | $20B |
|
||
Price history
+418.7% since first listed6 events — show timeline
- 2026-04-20 Listed $125,000 REALCOMP
- 2026-04-20 Listed $125,000 SW Michigan MLS
- 2026-04-20 Listed $125,000 MiRealSource-MiMLS
- 2026-04-18 Coming Soon $125,000 MiRealSource-MiMLS
- 2026-04-18 Coming Soon $125,000 SW Michigan MLS
- 2016-01-28 Sold (Public Records) $24,100 Public Records
Property tax history
+3.3%/yrLatest (2025): $1,066 · -13.9% YoY. Source: county tax records.
Cash-flow waterfall
monthlySold comps — $/sqft
last 12 mo · ≤1 miLoading sold comps…