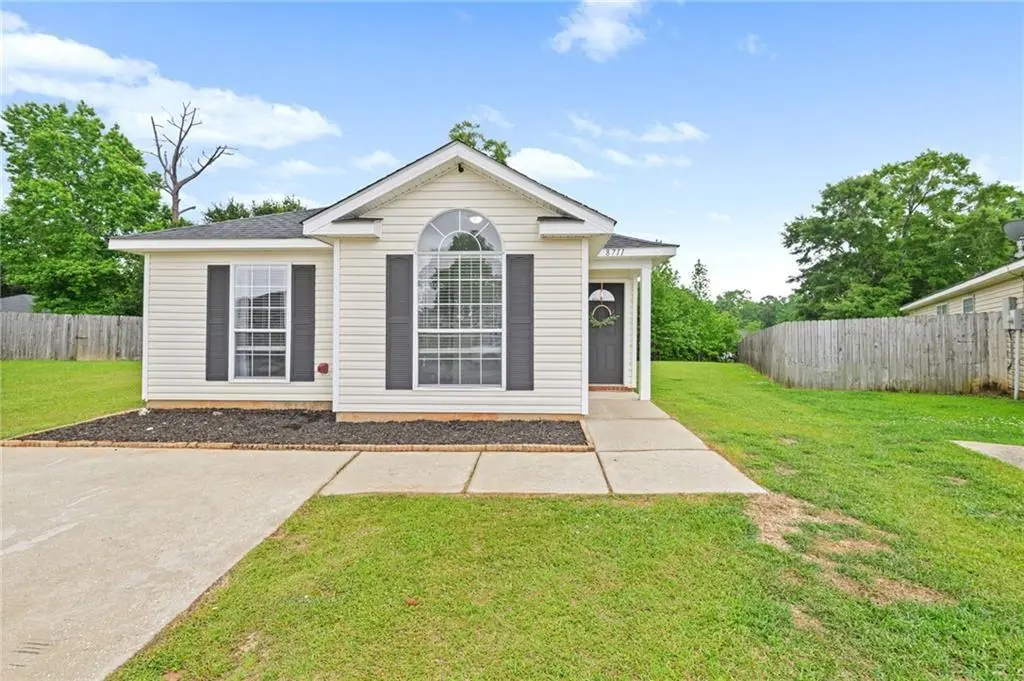
8711 Londonderry Ct · Mobile, AL
Flood risk 1/10 · Minimal
- FEMA flood zone
- X (unshaded)
- Chance of flooding over 30 yrs
- 0.0%
- Est. flood insurance / yr
- $507 – $1,088
Fire risk 3/10 · Minor
- Est. fire insurance / yr
- $916 – $1,700
Heat risk 9/10 · Severe
- Hot days now (above 105°F)
- 7 days/yr
- Hot days in 30 yrs
- 21 days/yr
Wind risk 9/10 · Severe
- Chance of severe wind over 30 yrs
- 99.0%
Air-quality risk 1/10 · Minimal
- Unhealthy air days now
- 0 days/yr
- Unhealthy air days in 30 yrs
- 0 days/yr
Risk factors via First Street. Map © Google.
Why this score? — see what drove the D+ grade
The composite is a weighted blend of 9 inputs, each scored 0–100. Each bar is that input's sub-score; the figure is the points it added to the 100-point composite (weight × sub-score).
- Cash flow +18.0/30.0
- ARV discount +10.7/15.0
- DSCR +5.6/10.0
- 1% rule +3.8/10.0
- Livability +3.8/5.0
- Condition / age +2.5/5.0
- Rent growth +2.4/5.0
- Schools +2.3/10.0
- Appreciation +0.0/10.0
$199,210
🖨 Deal sheet 📄 Offer letter ✓ Due diligence
Listing remarks MLS
MOVE IN READY, CLEAN, FRESH PAINT THROUGHOUT AND BRAND NEW ARCHITECTURAL SHINGLE ROOF. Come and enjoy this three bedroom, two bath home. ALL kitchen appliances including refrigerator to remain! This home offers a split floor plan, so the master has exclusive privacy. The master closet is large and oversized and the living room is spacious. This home is located in a cul de sac, so no drive by traffic! This neighborhood is located off Airport Blvd-- easy access to West Mobile or into town! Home features small back patio for outdoor enjoyment. Come make this your cozy home!
Key facts
- 7,771 sq ft lot
- 2 parking spots
- Built 2006
Property features AI
Finance
- HOA & community: Community association with a $15 monthly fee
Exterior
- Parking: Driveway; Parking for 2 vehicles
- Utilities: Electricity available; Public sewer; Water available
- Home design: Single family residence; Residential property; Located in Hamilton Bridges subdivision
- Construction: Vinyl siding; Built in 2006; Slab foundation; Composition/shingle roof
- Exterior features: Back yard fencing; Other exterior features; Has a view; No pool or spa; No other structures; Not waterfront
Interior
- Kitchen: Dishwasher; Electric range; Microwave; Refrigerator; Breakfast bar; Additional cabinets; Eat-in kitchen; Pantry; Solid surface counters
- Bedrooms: 3 bedrooms
- Flooring: Carpet
- Bathrooms: 2 full bathrooms
- Heating & cooling: Central heating; Central air; Ceiling fans
- Interior features: Entrance foyer; Walk-in closets; No fireplace; Basement: none; Dining room with other features
- Laundry & utility: No specific laundry appliances listed
Neighborhood map
What this means for you Summary
Snapshot
- This is a 3-bed/2.0-bath single-family listed at $199k.
Deal economics
- At list price, monthly cash flow is $170 ($2k/yr) — positive.
- The deal already cash-flows at list — no discount required.
- To meet the 1% rule (rent ≥ 1% of price), the offer needs to be $175k (12.2% below list).
- Recommended offer: $175k (12.2% below list) — sets the bar for 1% rule.
- Cap rate 7.3% vs local median 4.9% in Mobile — top-decile yield for the area; either an underpriced asset or a hidden risk that comps aren't pricing in. Stress-test before assuming the spread holds.
Location & tenants
- Location reads 75/100 on livability (#20 in AL, #4,262 nationally) — a middle-class / working-renter tenant base. Strengths: commute A+, cost of living A+, housing A+; Watch: crime F, employment D-.
- Mobile County (urban): math 15% / reading 39% proficiency, ranked #81 of 129 in AL (top 63%) — low school quality limits family demand, transient renter base, plan for 1-2y turnover; 67% free/reduced lunch — lower-income household profile, screen leases tightly.
- Zoned schools: Baker High School (math 25% / reading 28%, grade F, #107 of 305 statewide, top 36%, 2,491 students, 42% FRL) — zoned schools average 42% FRL vs 67% district-wide (26 pts lower); this property's tenant base skews higher-income than the district average.
- Market conditions: Rents soft (-0.4%/yr); 551 active listings in the ZIP; 9 comparable units currently listed for rent nearby; rentals leasing fast (median 14d on market — plan ~1-2 weeks tenant-placement turnaround); 44% of comp listings sitting > 30 days — soft ceiling on asking rent; solid renter incomes; 1,678 units permitted in Mobile County in 2024 (264 in 5+ unit buildings).
Forward outlook
- Local home prices are declining (-3.0%/yr); year-one equity from $1k of loan paydown is wiped out by about $6k of value loss. Plan a longer hold.
- Mobile County population projected to shrink 8% by 2050 — rents likely to lag national; underwrite the cash flow, not the appreciation.
Negotiation context
- Only 5 days on market — expect competitive offers; lowballing is unlikely to land.
- Current owner paid $172k; 16% above their basis — modest negotiation headroom, anchor on the comps not their cost.
Risks & watch-outs
- Climate carrying-cost: severe wind risk, 99% chance of damaging wind over 30y; extreme-heat days projected 7→21/yr by 2055 (HVAC capex compounding) — expect insurance premiums to compound above CPI over the hold.
Questions for the listing agent
- What does the HOA fee cover, when was the last increase, and are there any pending special assessments or reserve-fund shortfalls?
- Is there a deadline driving the sale (1031 exchange, divorce, estate, relocation)? That informs how much negotiation room exists.
- Schools are D-rated, which usually means shorter tenancies and higher turnover. Who's the typical renter profile here, and what's been the actual vacancy rate?
- Crime grade is F in this area — have there been break-ins, vandalism, or insurance claims at this property in the last 3 years? What carrier currently insures it and at what premium?
- The area grade is low — what's the realistic commute time and amenity access for the typical tenant pool here? Any planned neighborhood developments (good or bad) we should know about?
- What's the average days-on-market for RENTAL listings here right now (not sales)? A rising rental-DOM trend means longer vacancies and softer asking-rent achievability than the comps imply.
- What's the recent tenant-quality profile in this submarket — average credit score on applications, eviction rate, late-payment / NSF rate, and stable-employment percentage? A property-management company in the area should have these aggregated.
- How much new for-sale + rental construction is in the pipeline within 1–3 miles? Heavy new supply typically softens prices + rents 12–24 months out; constrained supply supports both.
Investment metrics
- 1% rule
- 0.88% ✗
- Cap rate
- 7.32%
- Cash-on-cash
- 3.66%
- DSCR
- 1.16
- GRM
- 9.5
CMA / ARV
- ARV (median comp)
- $214,591
- List price
- $199,210
- Delta
- -7.17%
- Verdict
- FAIR
- Comps
- 20 within 1.0 mi
Show comp detail 12 sales within ~0.75 mi
| Address | Dist | Beds/Ba | Sqft | Sold | Price | $/sf | Match |
|---|---|---|---|---|---|---|---|
| 8710 Londonderry Ct | 0.01mi | 3/2.5 | 1,319 (+2%) | 4mo | $204,900 | $155 | 92 |
| 960 Hamilton Bridges Dr W | 0.05mi | 3/2.0 | 1,295 (-0%) | 12mo | $205,000 | $158 | 88 |
| 1010 E Hamilton Bridges Dr | 0.07mi | 3/2.0 | 1,246 (-4%) | 8mo | $215,000 | $173 | 84 |
| 919 Parliament Ct | 0.14mi | 3/2.0 | 1,265 (-2%) | 11mo | $200,000 | $158 | 81 |
| 8671 Hamilton Bridges Dr S | 0.13mi | 3/2.0 | 1,275 (-2%) | 13mo | $199,950 | $157 | 80 |
| 8702 Three Dean Way | 0.09mi | 3/2.0 | 1,378 (+6%) | 7mo | $239,000 | $173 | 80 |
| 8535 Gatwick Ct | 0.22mi | 3/2.0 | 1,332 (+3%) | 8mo | $237,000 | $178 | 79 |
| 8721 Hamilton Bridges Dr S | 0.13mi | 3/2.0 | 1,308 (+1%) | 18mo | $205,000 | $157 | 78 |
| 911 Parliament Ct | 0.14mi | 3/2.0 | 1,361 (+5%) | 10mo | $208,000 | $153 | 77 |
| 8772 Fangorn Rd | 0.17mi | 3/2.0 | 1,385 (+7%) | 16mo | $214,000 | $155 | 68 |
| 8542 Three Dean Way | 0.25mi | 3/2.0 | 1,424 (+10%) | 11mo | $245,000 | $172 | 63 |
| 930 Abilene Dr E | 0.75mi | 3/2.0 | 1,385 (+7%) | 15mo | $199,900 | $144 | 41 |
Match score weights: distance 35% · size 25% · config 20% · recency 20%. Top-matched comps best support the ARV.
Projected returns pro-forma
-3.0% appreciation · 0.0% rent growth · sell at horizon
- IRR
- -13.7%
- Equity multiple
- 0.52×
- Total profit
- $-26,659
- Equity at exit
- $29,703
- IRR
- -9.8%
- Equity multiple
- 0.47×
- Total profit
- $-29,390
- Equity at exit
- $17,224
Cash invested: $55,779 (down + closing). Projections, not guarantees.
Landlord ↔ Tenant lean methodology
- Overall (STATE)
- 90 Strongly Landlord-Friendly
- State Alabama
- 90 Strongly Landlord-Friendly · R+15
- County
- — inherits STATE
- City
- — inherits STATE
ZIP-level market 36695
- Home prices YoY
- -30.9%
- Rents YoY
- -0.4%
- Active inventory
- 551
- Price-to-rent
- 9.5×
Monthly cashflow live
- Estimated rent
- $1,749 high interval (Pro) →
- Mortgage (P&I)
- −$1,045
- Tax from tax record
- −$69 /mo · $825/yr
- Insurance
- −$83
- HOA
- −$15
- Vacancy / Maint / Mgmt
- −$367
- Net cashflow
- $170
Break-even live
UW: 25.0% down · 7.5% · 30yr · 1.5% tax · 5.0% vac · 8.0% maint · 8.0% mgmt
Financing live
Cash to close
- Down payment
- $49,802
- Closing costs
- $5,976
- Reserves months
- —
- Total cash needed
- —
Loan-product check · same deal, 3 products live
Conventional
25% down · 7.5% · 30yr
- Down + closing
- —
- Monthly P&I
- —
- Monthly cashflow
- —
- DSCR
- —
- Eligible?
- —
Personal DTI + credit; lowest rate.
DSCR
20% down · 8.5% · 30yr
- Down + closing
- —
- Monthly P&I
- —
- Monthly cashflow
- —
- DSCR
- —
- Eligible?
- —
No personal income docs; deal must DSCR.
Hard money
10% down · 12.0% · 12mo
- Down + closing
- —
- Monthly P&I
- —
- Monthly cashflow
- —
- DSCR
- —
- Eligible?
- —
Short-term bridge; refi at stabilization.
Rent comps 9 comps
| Address | Beds | Baths | Sqft | Rent | $/sqft | DOM | Units | Dist |
|---|---|---|---|---|---|---|---|---|
| 1345 Baker Ct Mobile, AL | 3.0 | 2.0 | 1252 | $1,500 | $1.20 | 44d | 1 | 0.86mi |
| 791 Copperfield Dr E Mobile, AL | 3.0 | 2.0 | 1256 | $1,495 | $1.19 | 44d | 1 | 0.97mi |
| 725 Copperfield Dr E Mobile, AL | 3.0 | 2.0 | 1454 | $1,500 | $1.03 | 13d | 1 | 1.00mi |
| 700 Bonneville Dr Mobile, AL | 3.0 | 2.0 | 1196 | $1,600 | $1.34 | 13d | 1 | 1.08mi |
| 9490 Cinder Dr Mobile, AL | 3.0 | 3.0 | 1783 | $1,800 | $1.01 | 13d | 1 | 1.10mi |
| 1718 Calgary Dr W Mobile, AL | 4.0 | 2.0 | 1830 | $2,200 | $1.20 | 44d | 1 | 1.12mi |
| 9650 Trailwood Dr S Mobile, AL | 3.0 | 2.0 | 1118 | $1,275 | $1.14 | 13d | 1 | 1.36mi |
| 1313 Schillinger Rd S Mobile, AL | 1.0–3.0 | 1.0–2.0 | 1022 | $1,651 | $1.62 | 13d | 7 | 1.47mi |
| 945 Schillinger Rd S Mobile, AL | 2.0–3.0 | 2.0–2.5 | 1809 | $2,300 | $1.27 | 44d | 1 | 1.48mi |
HOA detail
- Monthly dues
- $15 · $180/yr
Listing history 6 events
-
2026-05-12status Pending 1996-char remark
-
2026-05-07$199,210 Active 1996-char remark
-
2026-04-24historical $199,210 1996-char remark
-
2022-04-11soldstatus $172,000
-
2022-03-09soldstatus $172,000 577-char remark
Show marketing remark (577 chars)
MOVE IN READY, CLEAN, FRESH PAINT THROUGHOUT AND BRAND NEW ARCHITECTURAL SHINGLE ROOF. Come and enjoy this three bedroom, two bath home. ALL kitchen appliances including refrigerator to remain! This home offers a split floor plan, so the master has exclusive privacy. The master closet is large and oversized and the living room is spacious. This home is located in a cul de sac, so no drive by traffic! This neighborhood is located off Airport Blvd-- easy access to West Mobile or into town! Home features small back patio for outdoor enjoyment. Come make this your cozy home!
-
2005-11-14soldstatus $106,000
ⓘ Source: listings_history table (triggers on properties + properties_extension) + one-shot
backfill from property_details.listing_events for pre-trigger history.
Tax reassessment forecast AL · Resets to sale price
- Current annual tax
- $825 · $69/mo
- Projected year-2 tax
- $825 · $69/mo
- Expected delta
- $0/yr ($0/mo · 0.0%)
ⓘ Screening estimate from a state-policy table — verify with the county assessor before closing.
Climate risk First Street
- Flood 1/10 Low FEMA zone X (unshaded) · 0% chance over 30 yrs
- Wildfire 3/10 Moderate
- Heat 9/10 Extreme 7 d/yr ≥105°F today · 21 d/yr by 30 yrs out
- Wind 9/10 Extreme 99% chance of damaging wind over 30 yrs
- Air quality 1/10 Low 0 unhealthy d/yr today · 0 by 30 yrs out
Nearby sold comps map
Loading sold comps map…
Walkable amenities ~0.75 mi
Loading nearby amenities…
Taxation est. · year 1
- Rental income
- $20,983
- − Mortgage interest
- −$11,159
- − Property taxes
- −$825
- − Insurance
- −$996
- − Repairs & maintenance
- −$1,679
- − Management
- −$1,679
- − HOA
- −$180
- − Depreciation
- −$5,795
- Taxable loss
- −$1,330
- Est. tax savings @ 24.0%
- +$319
- After-tax cash flow
- $2,358/yr
For passive investors: Depreciation is non-cash, so a rental often shows a tax loss while cash-flowing — sheltering income. Rental losses are passive: they offset passive income freely, and up to $25,000/yr can offset ordinary (W-2) income if you actively participate and your MAGI is under $100k (phasing out to $0 by $150k); unused losses carry forward. On sale, claimed depreciation is recaptured at up to 25%, and gains may owe capital-gains tax (a 1031 exchange can defer both). Figures are a year-1 estimate at your 24.0% rate — not tax advice; consult a CPA.
Schools (NCES district)
- District
- Mobile County
- NCES district ID
- 0102370
- Math proficiency
- 15% ▼ -28.00%
- Reading proficiency
- 39% ▬ 0.00%
- Median HH income
- $42,455
- Composite
- 22.9/100
- National rank
- #8002
- State rank
- #81 of 129 in AL
Livability — Mobile
- Score
- 75/100
- State rank
- #20
- US rank
- #4262
Category grades
Schools grade is shown separately in the Schools card above.
Census & demographics
- County
- Mobile County · 246,577 people
- City population
- 205,729
- Metro
- Mobile, AL
- Population (ZIP)
- 52,690
- Household income
- $76,040
- Rent vs Own
- Severe rent burden
- 1619.0
Population outlook (Mobile County) Hauer SSP2
- Today (2025)
- 415,303 people
- By 2030
- 411,755 · -0.9%
- By 2040
- 399,670 · -3.8%
- By 2050
- 382,616 · -7.9%
- By 2075
- 337,353 · -18.8%
- By 2100
- 283,391 · -31.8%
Race, ethnicity, and origin ACS 2023
- Neighborhood character
- Predominantly White (67%)
- Race & ethnicity
- White 67% Black 23% Two or more races 5% Hispanic / Latino 5% Asian 2%
- Common ancestry
- Lithuanian 3% Italian 2% Slovak 1%
- Foreign-born
- 5% · Canada, Vietnam, China
- Languages at home
- 94% English-only · Spanish 2% Vietnamese 1% Arabic 1%
Political lean MEDSL · Mobile
- 2024 margin
- R (+16.4) · D 41.3% · R 57.7%
- 2008→2024 swing
- -7.7pp toward R · 2008: -8.7pp · 2024: -16.4pp
- All cycles
- 2024: R+16.4 2020: R+11.9 2016: R+13.9 2012: R+9.3 2008: R+8.7
Not yet ingested
- Civics
- —
Market trends
- HPI YoY
- ▼ -86.28%
- Current HPI
- 193.1651
- Rent YoY
- ▼ -0.41%
- Metro
- Mobile, AL
- State GDP YoY
- ▲ 2.94%
- F500 in state
- 4
Industry mix (Fortune 500 HQ in AL)
| Industry | F500 HQs | Revenue |
|---|---|---|
| Financial Services | 1 | $8B |
|
||
| Healthcare | 1 | $5B |
|
||
Price history
+87.9% since first listed6 events — show timeline
- 2026-05-12 Pending — GCMLS AL
- 2026-05-07 Listed $199,210 GCMLS AL
- 2026-04-24 Coming Soon $199,210 GCMLS AL
- 2022-04-11 Sold (Public Records) $172,000 Public Records
- 2022-03-09 Sold (MLS) $172,000 GCMLS AL
- 2005-11-14 Sold (Public Records) $106,000 Public Records
Property tax history
-2.4%/yrLatest (2025): $825 · -1.0% YoY. Source: county tax records.
Cash-flow waterfall
monthlySold comps — $/sqft
last 12 mo · ≤1 miLoading sold comps…