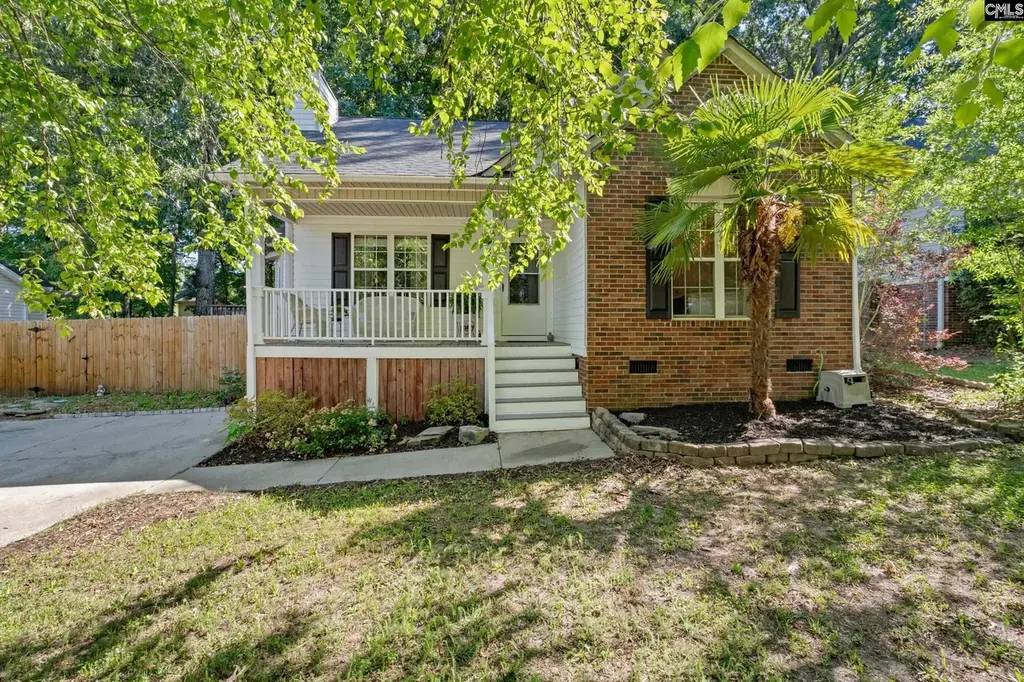
209 Caddis Creek Rd · Columbia, SC
Flood risk 1/10 · Minimal
- FEMA flood zone
- X (unshaded)
- Chance of flooding over 30 yrs
- 0.0%
- Est. flood insurance / yr
- $507 – $1,088
Fire risk 3/10 · Minor
- Est. fire insurance / yr
- $783 – $1,453
Heat risk 6/10 · Moderate
- Hot days now (above 108°F)
- 7 days/yr
- Hot days in 30 yrs
- 16 days/yr
Wind risk 6/10 · Moderate
- Chance of severe wind over 30 yrs
- 59.0%
Air-quality risk 3/10 · Minor
- Unhealthy air days now
- 3 days/yr
- Unhealthy air days in 30 yrs
- 3 days/yr
Risk factors via First Street. Map © Google.
Why this score? — see what drove the D+ grade
The composite is a weighted blend of 9 inputs, each scored 0–100. Each bar is that input's sub-score; the figure is the points it added to the 100-point composite (weight × sub-score).
- Cash flow +18.9/30.0
- DSCR +5.9/10.0
- ARV discount +5.4/15.0
- Schools +4.5/10.0
- 1% rule +4.2/10.0
- Livability +3.9/5.0
- Rent growth +2.7/5.0
- Condition / age +2.5/5.0
- Appreciation +0.0/10.0
$220,000
🖨 Deal sheet 📄 Offer letter ✓ Due diligence
Listing remarks
Welcome home to this Irmo cutie with the front porch everyone wants and the updates buyers actually care about. Step inside to an open layout with easy-flow living spaces, hardwood floors, cathedral ceiling and a cozy wood-burning fireplace that makes the whole house feel inviting. The kitchen opens right into the living and dining areas and features updated countertops, upgraded appliances, and pantry storage — because nobody has ever said, “I wish I had less counter space. ” The renovated primary suite is the real showstopper with tile floors, a gorgeous vanity and an oversized tiled walk-in shower that feels like it is straight out of a boutique hotel. Out back, the wr
Key facts
- Front porch
- Open layout
- Updated countertops
Tags
Property features AI
Finance
- Other: Cable TV available
- HOA & community: Homeowners association present; Association maintains common areas and green spaces
Exterior
- Parking: 4 parking spaces
- Utilities: Public water; Public sewer; Storm doors and thermopane windows
- Home design: Single-story home
- Construction: Partial brick above foundation with vinyl siding; Crawlspace foundation
- Exterior features: Covered front porch; Covered back porch; Deck; Shed; Full gutters; Privacy wood fence in rear
Interior
- Kitchen: Eat-in kitchen with pantry; Solid-surface countertops; Tiled floor and tiled backsplash; Painted cabinets; Smooth-surface range; Microwave above stove; Dishwasher; Disposal
- Bedrooms: Main-level primary bedroom with private bath, ceiling fan, private closet, tile floors and spa/multiple-head shower; Two additional main-level bedrooms with ceiling fans, private closets and hardwood floors (shared baths, tub/shower)
- Flooring: Hardwood floors in main living areas and bedrooms; Tile floors in primary bedroom and kitchen
- Bathrooms: Two full bathrooms
- Heating & cooling: Central heating; Central air conditioning
- Interior features: Ceiling fans throughout; Smoke detector; Pull-down access attic; Wood-burning fireplace with cathedral ceilings and hardwood floors in living area
- Laundry & utility: Main-level laundry in closet off kitchen; Electric water heater
Neighborhood map
What this means for you Summary
Snapshot
- This is a 3-bed/2.0-bath single-family listed at $220k.
Deal economics
- At list price, monthly cash flow is $225 ($3k/yr) — positive.
- The deal already cash-flows at list — no discount required.
- To meet the 1% rule (rent ≥ 1% of price), the offer needs to be $203k (7.9% below list).
- Recommended offer: $203k (7.9% below list) — sets the bar for 1% rule.
- Cap rate 7.5% vs local median 5.0% in Columbia — top-decile yield for the area; either an underpriced asset or a hidden risk that comps aren't pricing in. Stress-test before assuming the spread holds.
Location & tenants
- Location reads 78/100 on livability (#18 in SC, #2,436 nationally) — a middle-class / working-renter tenant base. Strengths: amenities A+, commute A+, cost of living A+; Watch: employment D, crime F.
- Lexington 05 (suburban): math 47% / reading 55% proficiency, ranked #5 of 80 in SC (top 6%) — acceptable for families but not a draw, mixed tenant base, ~2y average lease.
- Zoned schools: Dutch Fork Elementary (math 32% / reading 37%, grade F, #344 of 597 statewide, top 60%, 475 students, 82% FRL); Dutch Fork High (math 54% / reading 86%, grade B+, #58 of 196 statewide, top 30%, 1,726 students, 52% FRL) — zoned schools average 67% FRL vs 27% district-wide (40 pts higher); higher-poverty schools than district average — tighter screening recommended.
- Market conditions: Rents flat; 315 active listings in the ZIP; 37 comparable units currently listed for rent nearby; rentals leasing fast (median 3d on market — plan ~1-2 weeks tenant-placement turnaround); solid renter incomes; 3,472 units permitted in Richland County in 2024 (1,096 in 5+ unit buildings).
Forward outlook
- Local home prices are declining (-3.0%/yr); year-one equity from $2k of loan paydown is wiped out by about $7k of value loss. Plan a longer hold.
- Richland County population projected at +30% by 2050 — long-run rental-demand tailwind backs the buy-and-hold thesis.
Negotiation context
- It's been on market 18 days — a 2% lower offer ($217k) is reasonable based on typical stale-listing flexibility.
- 2 sale attempts since 5y ago with the ask held roughly flat each time — persistent listings suggest the price (not the market) is what's stuck; bring a comps-based counter.
- Current owner paid $190k; 16% above their basis — modest negotiation headroom, anchor on the comps not their cost.
Risks & watch-outs
- Climate carrying-cost: major wind risk, 59% chance of damaging wind over 30y; extreme-heat days projected 7→16/yr by 2055 (HVAC capex compounding) — expect insurance premiums to compound above CPI over the hold.
Questions for the listing agent
- What does the HOA fee cover, when was the last increase, and are there any pending special assessments or reserve-fund shortfalls?
- Is there a deadline driving the sale (1031 exchange, divorce, estate, relocation)? That informs how much negotiation room exists.
- Schools are D-rated, which usually means shorter tenancies and higher turnover. Who's the typical renter profile here, and what's been the actual vacancy rate?
- Crime grade is F in this area — have there been break-ins, vandalism, or insurance claims at this property in the last 3 years? What carrier currently insures it and at what premium?
- The area grade is low — what's the realistic commute time and amenity access for the typical tenant pool here? Any planned neighborhood developments (good or bad) we should know about?
- What's the average days-on-market for RENTAL listings here right now (not sales)? A rising rental-DOM trend means longer vacancies and softer asking-rent achievability than the comps imply.
- What's the recent tenant-quality profile in this submarket — average credit score on applications, eviction rate, late-payment / NSF rate, and stable-employment percentage? A property-management company in the area should have these aggregated.
- How much new for-sale + rental construction is in the pipeline within 1–3 miles? Heavy new supply typically softens prices + rents 12–24 months out; constrained supply supports both.
Investment metrics
- 1% rule
- 0.92% ✗
- Cap rate
- 7.52%
- Cash-on-cash
- 4.38%
- DSCR
- 1.19
- GRM
- 9.0
CMA / ARV
- ARV (on-the-fly)
- $210,392
- Comps found
- 1
Show comp detail 1 sale within ~0.75 mi
| Address | Dist | Beds/Ba | Sqft | Sold | Price | $/sf | Match |
|---|---|---|---|---|---|---|---|
| 1003 Riverwalk Way | 0.12mi | 3/2.0 | 1,318 (+14%) | 15mo | $239,900 | $182 | 58 |
Match score weights: distance 35% · size 25% · config 20% · recency 20%. Top-matched comps best support the ARV.
Projected returns pro-forma
-3.0% appreciation · 0.78% rent growth · sell at horizon
- IRR
- -11.8%
- Equity multiple
- 0.58×
- Total profit
- $-25,818
- Equity at exit
- $32,803
- IRR
- -6.0%
- Equity multiple
- 0.65×
- Total profit
- $-21,662
- Equity at exit
- $19,022
Cash invested: $61,600 (down + closing). Projections, not guarantees.
Landlord ↔ Tenant lean methodology
- Overall (STATE)
- 90 Strongly Landlord-Friendly
- State South Carolina
- 90 Strongly Landlord-Friendly · R+6
- County
- — inherits STATE
- City
- — inherits STATE
ZIP-level market 29063
- Rents YoY
- 0.8%
- Active inventory
- 315
- Price-to-rent
- 9.0×
Monthly cashflow live
- Estimated rent
- $2,027 high interval (Pro) →
- Mortgage (P&I)
- −$1,154
- Tax from tax record
- −$117 /mo · $1,403/yr
- Insurance
- −$92
- HOA
- −$14
- Vacancy / Maint / Mgmt
- −$426
- Net cashflow
- $225
Break-even live
UW: 25.0% down · 7.5% · 30yr · 1.5% tax · 5.0% vac · 8.0% maint · 8.0% mgmt
Financing live
Cash to close
- Down payment
- $55,000
- Closing costs
- $6,600
- Reserves months
- —
- Total cash needed
- —
Loan-product check · same deal, 3 products live
Conventional
25% down · 7.5% · 30yr
- Down + closing
- —
- Monthly P&I
- —
- Monthly cashflow
- —
- DSCR
- —
- Eligible?
- —
Personal DTI + credit; lowest rate.
DSCR
20% down · 8.5% · 30yr
- Down + closing
- —
- Monthly P&I
- —
- Monthly cashflow
- —
- DSCR
- —
- Eligible?
- —
No personal income docs; deal must DSCR.
Hard money
10% down · 12.0% · 12mo
- Down + closing
- —
- Monthly P&I
- —
- Monthly cashflow
- —
- DSCR
- —
- Eligible?
- —
Short-term bridge; refi at stabilization.
Rent comps 37 comps
| Address | Beds | Baths | Sqft | Rent | $/sqft | DOM | Units | Dist |
|---|---|---|---|---|---|---|---|---|
| 316 Stamport Cir Irmo, SC | 3.0 | 2.5 | 1500 | $1,575 | $1.05 | 3d | 1 | 0.20mi |
| 101 Riverwalk Way Irmo, SC | 3.0 | 2.0 | 1300 | $1,750 | $1.35 | 14d | 1 | 1.03mi |
| 174 Winding Chestnut Dr Columbia, SC | 3.0 | 2.5 | 1335 | $1,875 | $1.40 | 23d | 1 | 1.29mi |
| 356 Lake Murray Blvd Irmo, SC | 1.0–3.0 | 1.0–2.0 | 1020 | $2,537 | $2.49 | 3d | 23 | 1.31mi |
| 185 Winding Chestnut Dr Columbia, SC | 3.0 | 2.5 | 1335 | $1,975 | $1.48 | 23d | 1 | 1.39mi |
| 193 Winding Chestnut Dr Columbia, SC | 3.0 | 2.5 | 1335 | $1,975 | $1.48 | 23d | 1 | 1.41mi |
| 197 Winding Chestnut Dr Columbia, SC | 3.0 | 2.5 | 1335 | $1,875 | $1.40 | 23d | 1 | 1.41mi |
| 201 Winding Chestnut Dr Columbia, SC | 3.0 | 2.5 | 1335 | $1,975 | $1.48 | 23d | 1 | 1.42mi |
| 200 Winding Chestnut Dr Columbia, SC | 3.0 | 2.5 | 1335 | $1,975 | $1.48 | 23d | 1 | 1.43mi |
| 204 Winding Chestnut Dr Columbia, SC | 3.0 | 2.5 | 1335 | $1,875 | $1.40 | 23d | 1 | 1.43mi |
| 209 Winding Chestnut Dr Columbia, SC | 3.0 | 2.5 | 1335 | $2,125 | $1.59 | 2d | 1 | 1.44mi |
| 208 Winding Chestnut Dr Columbia, SC | 3.0 | 2.5 | 1335 | $2,125 | $1.59 | 2d | 1 | 1.44mi |
| 211 Winding Chestnut Dr Columbia, SC | 3.0 | 2.5 | 1335 | $2,025 | $1.52 | 2d | 1 | 1.45mi |
| 210 Winding Chestnut Dr Columbia, SC | 3.0 | 2.5 | 1335 | $2,025 | $1.52 | 2d | 1 | 1.45mi |
| 213 Winding Chestnut Dr Columbia, SC | 3.0 | 2.5 | 1335 | $2,025 | $1.52 | 2d | 1 | 1.45mi |
| 212 Winding Chestnut Dr Columbia, SC | 3.0 | 2.5 | 1335 | $2,025 | $1.52 | 2d | 1 | 1.45mi |
| 215 Winding Chestnut Dr Columbia, SC | 3.0 | 2.5 | 1335 | $2,125 | $1.59 | 2d | 1 | 1.45mi |
| 214 Winding Chestnut Dr Columbia, SC | 3.0 | 2.5 | 1335 | $2,125 | $1.59 | 2d | 1 | 1.45mi |
| 217 Winding Chestnut Dr Columbia, SC | 3.0 | 2.5 | 1335 | $2,125 | $1.59 | 2d | 1 | 1.46mi |
| 220 Winding Chestnut Dr Columbia, SC | 3.0 | 2.5 | 1335 | $2,125 | $1.59 | 2d | 1 | 1.46mi |
| 219 Winding Chestnut Dr Columbia, SC | 3.0 | 2.5 | 1335 | $2,025 | $1.52 | 2d | 1 | 1.46mi |
| 100 Walden Heights Dr Irmo, SC | 1.0–3.0 | 1.0–2.0 | 1030 | $1,880 | $1.83 | 3d | 23 | 1.47mi |
| 222 Winding Chestnut Dr Columbia, SC | 3.0 | 2.5 | 1335 | $2,025 | $1.52 | 2d | 1 | 1.47mi |
| 221 Winding Chestnut Dr Columbia, SC | 3.0 | 2.5 | 1335 | $2,025 | $1.52 | 2d | 1 | 1.47mi |
| 223 Winding Chestnut Dr Columbia, SC | 3.0 | 2.5 | 1335 | $2,125 | $1.59 | 2d | 1 | 1.47mi |
| 224 Winding Chestnut Dr Columbia, SC | 3.0 | 2.5 | 1335 | $2,025 | $1.52 | 2d | 1 | 1.47mi |
| 225 Winding Chestnut Dr Columbia, SC | 3.0 | 2.5 | 1335 | $2,125 | $1.59 | 2d | 1 | 1.48mi |
| 226 Winding Chestnut Dr Columbia, SC | 3.0 | 2.5 | 1335 | $2,125 | $1.59 | 2d | 1 | 1.48mi |
| 227 Winding Chestnut Dr Columbia, SC | 3.0 | 2.5 | 1335 | $2,025 | $1.52 | 2d | 1 | 1.48mi |
| 228 Winding Chestnut Dr Columbia, SC | 3.0 | 2.5 | 1335 | $2,125 | $1.59 | 2d | 1 | 1.48mi |
| 229 Winding Chestnut Dr Columbia, SC | 3.0 | 2.5 | 1335 | $2,025 | $1.52 | 2d | 1 | 1.48mi |
| 230 Winding Chestnut Dr Columbia, SC | 3.0 | 2.5 | 1335 | $2,025 | $1.52 | 2d | 1 | 1.49mi |
| 231 Winding Chestnut Dr Columbia, SC | 3.0 | 2.5 | 1335 | $2,125 | $1.59 | 2d | 1 | 1.49mi |
| 232 Winding Chestnut Dr Columbia, SC | 3.0 | 2.5 | 1335 | $2,025 | $1.52 | 2d | 1 | 1.49mi |
| 233 Winding Chestnut Dr Columbia, SC | 3.0 | 2.5 | 1335 | $2,125 | $1.59 | 2d | 1 | 1.49mi |
| 234 Winding Chestnut Dr Columbia, SC | 3.0 | 2.5 | 1335 | $2,125 | $1.59 | 2d | 1 | 1.49mi |
| 235 Winding Chestnut Dr Columbia, SC | 3.0 | 2.5 | 1335 | $2,025 | $1.52 | 2d | 1 | 1.50mi |
HOA detail
- Monthly dues
- $14 · $168/yr
Listing history 15 events
-
2026-06-03statusdays on market $220,000 Pending 18 DOM
-
2026-06-03days on market $220,000 Active - Contingent 17 DOM
-
2026-06-01days on market $220,000 Active - Contingent 16 DOM
-
2026-05-31days on market $220,000 Active - Contingent 15 DOM
-
2026-05-20historical Active - Contingent
-
2026-05-16$220,000 Active
-
2021-12-30soldstatus $190,000
-
2021-11-16historical
-
2021-11-12$165,000 Active
-
2015-08-31soldstatus $113,500
-
2011-11-09soldstatus $114,500
-
2005-08-31soldstatus $107,000
-
2000-02-29soldstatus $94,500
-
1998-05-27soldstatus $38,400
-
1998-03-10soldstatus $17,000
ⓘ Source: listings_history table (triggers on properties + properties_extension) + one-shot
backfill from property_details.listing_events for pre-trigger history.
Tax reassessment forecast SC · Resets to sale price
- Current annual tax
- $1,403 · $117/mo
- Projected year-2 tax
- $1,403 · $117/mo
- Expected delta
- $0/yr ($0/mo · 0.0%)
ⓘ Screening estimate from a state-policy table — verify with the county assessor before closing.
Climate risk First Street
- Flood 1/10 Low FEMA zone X (unshaded) · 0% chance over 30 yrs
- Wildfire 3/10 Moderate
- Heat 6/10 Major 7 d/yr ≥108°F today · 16 d/yr by 30 yrs out
- Wind 6/10 Major 59% chance of damaging wind over 30 yrs
- Air quality 3/10 Moderate 3 unhealthy d/yr today · 3 by 30 yrs out
Nearby sold comps map
Loading sold comps map…
Walkable amenities ~0.75 mi
Loading nearby amenities…
Taxation est. · year 1
- Rental income
- $24,321
- − Mortgage interest
- −$12,323
- − Property taxes
- −$1,403
- − Insurance
- −$1,100
- − Repairs & maintenance
- −$1,946
- − Management
- −$1,946
- − HOA
- −$168
- − Depreciation
- −$6,400
- Taxable loss
- −$965
- Est. tax savings @ 24.0%
- +$232
- After-tax cash flow
- $2,929/yr
For passive investors: Depreciation is non-cash, so a rental often shows a tax loss while cash-flowing — sheltering income. Rental losses are passive: they offset passive income freely, and up to $25,000/yr can offset ordinary (W-2) income if you actively participate and your MAGI is under $100k (phasing out to $0 by $150k); unused losses carry forward. On sale, claimed depreciation is recaptured at up to 25%, and gains may owe capital-gains tax (a 1031 exchange can defer both). Figures are a year-1 estimate at your 24.0% rate — not tax advice; consult a CPA.
Schools (NCES district)
- District
- Lexington 05
- NCES district ID
- 4502820
- Math proficiency
- 47% ▼ -7.00%
- Reading proficiency
- 55% ▼ -4.00%
- Median HH income
- $67,732
- Composite
- 45.28/100
- National rank
- #2656
- State rank
- #5 of 80 in SC
Livability — Columbia
- Score
- 78/100
- State rank
- #18
- US rank
- #2436
Category grades
Schools grade is shown separately in the Schools card above.
Census & demographics
- County
- Richland County · 389,530 people
- City population
- 335,994
- Metro
- Columbia, SC
- Population (ZIP)
- 38,201
- Household income
- $91,973
- Rent vs Own
- Severe rent burden
- 962.0
Population outlook (Richland County) Hauer SSP2
- Today (2025)
- 459,667 people
- By 2030
- 487,524 · +6.1%
- By 2040
- 542,035 · +17.9%
- By 2050
- 595,371 · +29.5%
- By 2075
- 732,998 · +59.5%
- By 2100
- 820,415 · +78.5%
Race, ethnicity, and origin ACS 2023
- Neighborhood character
- Majority White (65%)
- Race & ethnicity
- White 65% Black 26% Two or more races 5% Hispanic / Latino 3% Asian 2%
- Common ancestry
- Romanian 4% Slovak 4% Serbian 3%
- Foreign-born
- 4% · Canada
- Languages at home
- 95% English-only · Spanish 2% Russian/Polish/Slavic 1% Other Indo-European 1%
Political lean MEDSL · Richland
- 2024 margin
- Solid D (+34.6) · D 66.4% · R 31.8% · Other 1.8%
- 2008→2024 swing
- +5.7pp toward D · 2008: 28.9pp · 2024: 34.6pp
- All cycles
- 2024: D+34.6 2020: D+38.3 2016: D+32.9 2012: D+33.3 2008: D+28.9
Not yet ingested
- Civics
- —
Market trends
- HPI YoY
- ▼ -130.57%
- Current HPI
- 204.0147
- Rent YoY
- ▲ 0.78%
- Metro
- Columbia, SC
- State GDP YoY
- ▲ 4.51%
- F500 in state
- 2
Industry mix (Fortune 500 HQ in SC)
| Industry | F500 HQs | Revenue |
|---|---|---|
| Packaging | 1 | $7B |
|
||
Price history
+1194.1% since first listed11 events — show timeline
- 2026-05-20 Contingent — Consolidated MLS
- 2026-05-16 Listed $220,000 Consolidated MLS
- 2021-12-30 Sold (Public Records) $190,000 Public Records
- 2021-11-16 Delisted — Consolidated MLS
- 2021-11-12 Listed $165,000 Consolidated MLS
- 2015-08-31 Sold (Public Records) $113,500 Public Records
- 2011-11-09 Sold (Public Records) $114,500 Public Records
- 2005-08-31 Sold (Public Records) $107,000 Public Records
- 2000-02-29 Sold (Public Records) $94,500 Public Records
- 1998-05-27 Sold (Public Records) $38,400 Public Records
- 1998-03-10 Sold (Public Records) $17,000 Public Records
Property tax history
+3.4%/yrLatest (2025): $1,403 · -74.6% YoY. Source: county tax records.
Cash-flow waterfall
monthlySold comps — $/sqft
last 12 mo · ≤1 miLoading sold comps…