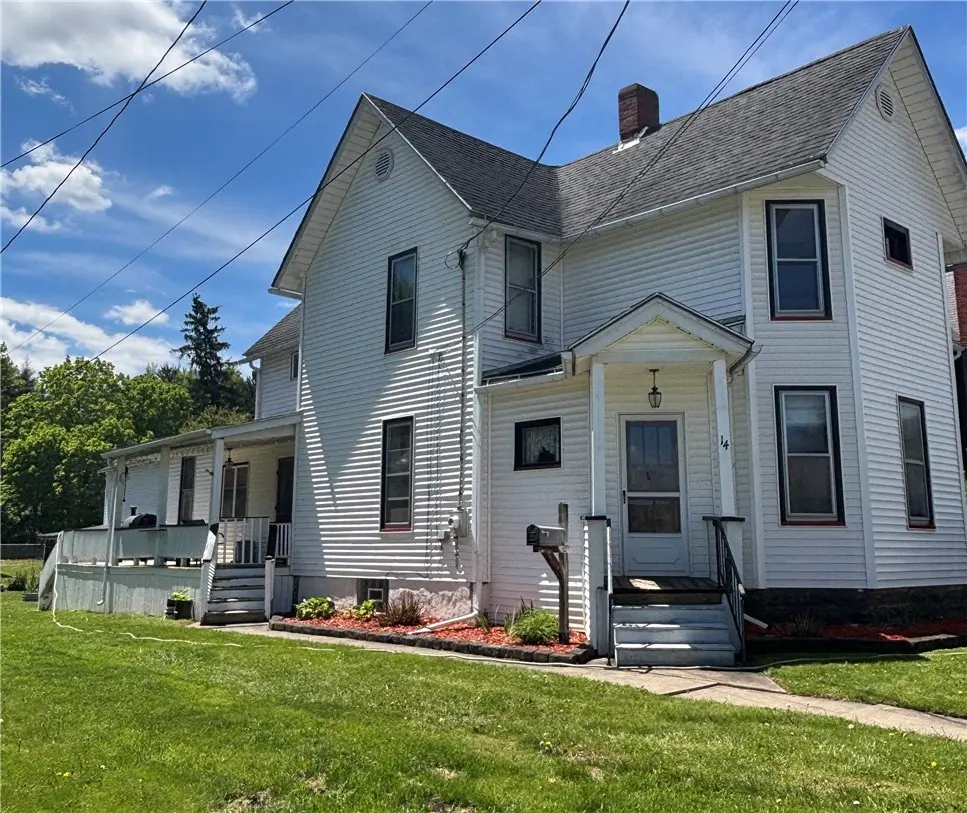
14 W Pine St · Hornell, NY
Flood risk 1/10 · Minimal
- FEMA flood zone
- X
- Chance of flooding over 30 yrs
- 0.0%
- Est. flood insurance / yr
- $473 – $860
Fire risk 3/10 · Minor
- Est. fire insurance / yr
- $691 – $1,283
Heat risk 3/10 · Minor
- Hot days now (above 92°F)
- 8 days/yr
- Hot days in 30 yrs
- 19 days/yr
Wind risk 1/10 · Minimal
- Chance of severe wind over 30 yrs
- —
Air-quality risk 1/10 · Minimal
- Unhealthy air days now
- 0 days/yr
- Unhealthy air days in 30 yrs
- 0 days/yr
Risk factors via First Street. Map © Google.
Why this score? — see what drove the B grade
The composite is a weighted blend of 9 inputs, each scored 0–100. Each bar is that input's sub-score; the figure is the points it added to the 100-point composite (weight × sub-score).
- Cash flow +29.3/30.0
- DSCR +10.0/10.0
- 1% rule +7.8/10.0
- Appreciation +7.0/10.0
- ARV discount +4.9/15.0
- Livability +3.5/5.0
- Schools +3.4/10.0
- Rent growth +2.5/5.0
- Condition / age +2.5/5.0
$159,900
🖨 Deal sheet 📄 Offer letter ✓ Due diligence
Listing remarks
Spacious and well-maintained home with farmhouse charm is waiting just for you! This property offers ample natural light, wood floors, and a low maintenance exterior. The home boasts Central AC and tankless on-demand hot water. The covered side porch and formal dining room greet you followed by the kitchen with breakfast area--entertain with ease. Living room, powder room (plumbed for W/ D or shower), and first floor bedroom finish out the main floor. Upstairs you'll find three bedrooms and the main bath, which is delightfully large and bright. Full walk-up attic and basement for your expansion or storage needs. 2-story barn with covered patio offers extra space for whatever you'd like. So
Key facts
- Central ac
- Wood floors
- Natural light
Tags
Property features AI
Exterior
- Parking: Detached garage; One garage space
- Utilities: Public water connected; Sewer connected; Electric service (standard)
- Home design: Two-story existing home; Resale property
- Construction: Vinyl siding; Architectural shingle roof; Stone foundation; Attic/crawl hatchway(s) insulated
- Exterior features: Dirt driveway; Rectangular residential lot; City street frontage
Interior
- Kitchen: Gas oven; Gas range; Dishwasher; Refrigerator; Appliances negotiable
- Bedrooms: One main-level bedroom
- Flooring: Carpet; Hardwood; Laminate; Resilient flooring; Varied flooring
- Bathrooms: One full bathroom; One half bathroom; One main-level bathroom
- Heating & cooling: Gas forced-air heating; Central air conditioning
- Interior features: Breakfast area; Separate/formal dining room; Bedroom on main level; Full basement
- Laundry & utility: Washer; Dryer; Laundry on upper level; Gas water heater; Tankless water heater
Neighborhood map
What this means for you Summary
Snapshot
- This is a 4-bed/1.5-bath single-family listed at $160k.
Deal economics
- At list price, monthly cash flow is $560 ($7k/yr) — positive.
- The deal already cash-flows at list — no discount required.
- Meets the 1% rule at list price ($2k rent vs $160k).
- Recommended offer: $158k (1.5% below list) — sets the bar for market timing.
- Cap rate 10.5% vs local median 13.3% in Hornell — below-typical yield; the buyer is paying a premium for something (appreciation thesis, condition, location) that the cap rate doesn't capture.
Location & tenants
- Location reads 70/100 on livability (#451 in NY) — a middle-class / working-renter tenant base. Strengths: cost of living A+, housing A+, health & safety A+; Watch: amenities C-, schools D, crime F.
- Hornell City School District (town): math 33% / reading 49% proficiency, ranked #519 of 590 in NY (top 88%) — families likely to look elsewhere, expect single-tenant / working-renter base with shorter leases.
- Market conditions: 59 active listings in the ZIP; 3 comparable units currently listed for rent nearby; rentals lingering (median 44d on market — plan ~5-8 weeks vacancy on turnover, expect pricing pressure); 100% of comp listings sitting > 30 days — soft ceiling on asking rent; 196 units permitted in Steuben County in 2024 (0 in 5+ unit buildings).
- This rent runs 42% of the median local income ($58k/yr) — at the standard rent-burdened threshold; future hikes will face affordability resistance.
Forward outlook
- In year one you build about $7k of equity ($1k loan paydown + $6k appreciation (4.0% local appreciation)).
- Steuben County population projected at -20% by 2050 — secular population decline; favor cash flow + early exit over multi-decade hold.
- At projected returns (4.0% appreciation + 3.0% rent growth), your $45k cash investment doubles in ~3 years — after that, you're playing with house money.
- By year 5, paydown + projected appreciation supports a ~$32k cash-out refi (75% LTV) — recoverable capital for the next deal without selling this one.
Negotiation context
- It's been on market 25 days — a 2% lower offer ($158k) is reasonable based on typical stale-listing flexibility.
- Current owner paid $60k; list at $160k implies a 169% gain — meaningful room to come down on a strong offer.
Risks & watch-outs
- Watch-outs: built in 1900 — expect roof / HVAC / electrical / plumbing capex.
Questions for the listing agent
- Built in 1900 — when were the roof, HVAC, electrical panel, plumbing, and water heater last replaced?
- Is there a deadline driving the sale (1031 exchange, divorce, estate, relocation)? That informs how much negotiation room exists.
- Schools are D-rated, which usually means shorter tenancies and higher turnover. Who's the typical renter profile here, and what's been the actual vacancy rate?
- Crime grade is F in this area — have there been break-ins, vandalism, or insurance claims at this property in the last 3 years? What carrier currently insures it and at what premium?
- What's the average days-on-market for RENTAL listings here right now (not sales)? A rising rental-DOM trend means longer vacancies and softer asking-rent achievability than the comps imply.
- What's the recent tenant-quality profile in this submarket — average credit score on applications, eviction rate, late-payment / NSF rate, and stable-employment percentage? A property-management company in the area should have these aggregated.
- How much new for-sale + rental construction is in the pipeline within 1–3 miles? Heavy new supply typically softens prices + rents 12–24 months out; constrained supply supports both.
Investment metrics
- 1% rule
- 1.28% ✓
- Cap rate
- 10.50%
- Cash-on-cash
- 15.02%
- DSCR
- 1.67
- GRM
- 6.5
CMA / ARV
- ARV (on-the-fly)
- $151,074
- Comps found
- 12
Show comp detail 12 sales within ~0.75 mi
| Address | Dist | Beds/Ba | Sqft | Sold | Price | $/sf | Match |
|---|---|---|---|---|---|---|---|
| 384 Canisteo St | 0.17mi | 4/2.0 | 1,962 (0%) | 13mo | $172,000 | $88 | 79 |
| 313 Arlington Pl | 0.24mi | 3/2.0 (-1) | 1,896 (-3%) | 4mo | $72,000 | $38 | 73 |
| 33 E Vanscoter St | 0.37mi | 3/2.0 (-1) | 2,002 (+2%) | 10mo | $73,000 | $36 | 64 |
| 44 Spruce St | 0.32mi | 4/2.5 | 1,799 (-8%) | 5mo | $170,000 | $94 | 63 |
| 54 Scott St | 0.27mi | 3/1.5 (-1) | 1,838 (-6%) | 19mo | $155,000 | $84 | 56 |
| 45 Oak St | 0.53mi | 5/1.5 (+1) | 1,886 (-4%) | 11mo | $95,000 | $50 | 54 |
| 151 Canisteo Ave | 0.64mi | 3/2.0 (-1) | 1,972 (+0%) | 10mo | $130,000 | $66 | 54 |
| 67 Oak St | 0.47mi | 3/1.5 (-1) | 1,822 (-7%) | 12mo | $50,000 | $27 | 51 |
| 45 Jane St | 0.48mi | 4/2.5 | 2,212 (+13%) | 7mo | $185,000 | $84 | 46 |
| 106 Crosby St | 0.32mi | 4/1.5 | 1,672 (-15%) | 18mo | $139,000 | $83 | 46 |
| 258 High St | 0.17mi | 3/3.0 (-1) | 1,682 (-14%) | 14mo | $130,000 | $77 | 46 |
| 99 Hill St | 0.47mi | 3/2.0 (-1) | 1,756 (-10%) | 10mo | $31,000 | $18 | 45 |
Match score weights: distance 35% · size 25% · config 20% · recency 20%. Top-matched comps best support the ARV.
Projected returns pro-forma
3.95% appreciation · 3.0% rent growth · sell at horizon
- IRR
- 23.6%
- Equity multiple
- 2.41×
- Total profit
- $63,116
- Equity at exit
- $80,584
- IRR
- 23.7%
- Equity multiple
- 4.69×
- Total profit
- $165,000
- Equity at exit
- $131,415
Cash invested: $44,772 (down + closing). Projections, not guarantees.
Landlord ↔ Tenant lean methodology
- Overall (STATE)
- 15 Strongly Tenant-Friendly
- State New York
- 15 Strongly Tenant-Friendly · D+10
- County
- — inherits STATE
- City
- — inherits STATE
ZIP-level market 14843
- Home prices YoY
- 1.9%
- Active inventory
- 59
- Price-to-rent
- 6.5×
Monthly cashflow live
- Estimated rent
- $2,042 medium interval (Pro) →
- Mortgage (P&I)
- −$839
- Tax from tax record
- −$148 /mo · $1,772/yr
- Insurance
- −$67
- HOA
- −$0
- Vacancy / Maint / Mgmt
- −$429
- Net cashflow
- $560
Break-even live
UW: 25.0% down · 7.5% · 30yr · 1.5% tax · 5.0% vac · 8.0% maint · 8.0% mgmt
Financing live
Cash to close
- Down payment
- $39,975
- Closing costs
- $4,797
- Reserves months
- —
- Total cash needed
- —
Loan-product check · same deal, 3 products live
Conventional
25% down · 7.5% · 30yr
- Down + closing
- —
- Monthly P&I
- —
- Monthly cashflow
- —
- DSCR
- —
- Eligible?
- —
Personal DTI + credit; lowest rate.
DSCR
20% down · 8.5% · 30yr
- Down + closing
- —
- Monthly P&I
- —
- Monthly cashflow
- —
- DSCR
- —
- Eligible?
- —
No personal income docs; deal must DSCR.
Hard money
10% down · 12.0% · 12mo
- Down + closing
- —
- Monthly P&I
- —
- Monthly cashflow
- —
- DSCR
- —
- Eligible?
- —
Short-term bridge; refi at stabilization.
Rent comps 3 comps
| Address | Beds | Baths | Sqft | Rent | $/sqft | DOM | Units | Dist |
|---|---|---|---|---|---|---|---|---|
| 58 Elm St Hornell, NY | 4.0 | 2.0 | 1600 | $2,495 | $1.56 | 43d | 1 | 0.57mi |
| 15 Hakes Ave Unit 102 Hornell, NY | 4.0 | 2.0 | 2000 | $2,195 | $1.10 | 43d | 1 | 0.76mi |
| 14 Willow Pl Hornell, NY | 4.0 | 2.0 | 1726 | $2,000 | $1.16 | 43d | 1 | 0.98mi |
Listing history 14 events
-
2026-06-13status $159,900 Pending 25 DOM
-
2026-06-12days on market $159,900 Active Under Contract 25 DOM
-
2026-06-09days on market $159,900 Active Under Contract 22 DOM
-
2026-06-08days on market $159,900 Active Under Contract 21 DOM
-
2026-06-07days on market $159,900 Active Under Contract 20 DOM
-
2026-06-07days on market $159,900 Active Under Contract 19 DOM
-
2026-06-03days on market $159,900 Active Under Contract 16 DOM
-
2026-06-02days on market $159,900 Active Under Contract 15 DOM
-
2026-06-01days on market $159,900 Active Under Contract 14 DOM
-
2026-05-31days on market $159,900 Active Under Contract 13 DOM
-
2026-05-30days on market $159,900 Active Under Contract 12 DOM
-
2026-05-18$159,900 Active
-
2006-12-07soldstatus $59,500
-
2006-03-09soldstatus $25,000
ⓘ Source: listings_history table (triggers on properties + properties_extension) + one-shot
backfill from property_details.listing_events for pre-trigger history.
Tax reassessment forecast NY · Partial reset (capped growth)
- Current annual tax
- $1,772 · $148/mo
- Projected year-2 tax
- $2,237 · $186/mo
- Expected delta
- +$465/yr (+$39/mo · 26.3%)
ⓘ Screening estimate from a state-policy table — verify with the county assessor before closing.
Climate risk First Street
- Flood 1/10 Low FEMA zone X · 0% chance over 30 yrs
- Wildfire 3/10 Moderate
- Heat 3/10 Moderate 8 d/yr ≥92°F today · 19 d/yr by 30 yrs out
- Wind 1/10 Low
- Air quality 1/10 Low 0 unhealthy d/yr today · 0 by 30 yrs out
Nearby sold comps map
Loading sold comps map…
Walkable amenities ~0.75 mi
Loading nearby amenities…
Taxation est. · year 1
- Rental income
- $24,504
- − Mortgage interest
- −$8,957
- − Property taxes
- −$1,772
- − Insurance
- −$800
- − Repairs & maintenance
- −$1,960
- − Management
- −$1,960
- − Depreciation
- −$4,652
- Taxable income
- $4,403
- Est. tax owed @ 24.0%
- −$1,057
- After-tax cash flow
- $5,668/yr
For passive investors: Depreciation is non-cash, so a rental often shows a tax loss while cash-flowing — sheltering income. Rental losses are passive: they offset passive income freely, and up to $25,000/yr can offset ordinary (W-2) income if you actively participate and your MAGI is under $100k (phasing out to $0 by $150k); unused losses carry forward. On sale, claimed depreciation is recaptured at up to 25%, and gains may owe capital-gains tax (a 1031 exchange can defer both). Figures are a year-1 estimate at your 24.0% rate — not tax advice; consult a CPA.
Schools (NCES district)
- District
- Hornell City School District
- NCES district ID
- 3614820
- Math proficiency
- 33% ▼ -8.00%
- Reading proficiency
- 49% ▲ 6.00%
- Median HH income
- $40,251
- Composite
- 34.33/100
- National rank
- #5234
- State rank
- #519 of 590 in NY
Livability — Hornell
- Score
- 70/100
- State rank
- #451
- US rank
- #7888
Category grades
Schools grade is shown separately in the Schools card above.
Census & demographics
- Census place
- Hornell, NY
- County
- Steuben County · 41,193 people
- City population
- 12,383
- Metro
- Corning, NY
- Population (ZIP)
- 12,383
- Household income
- $57,874
- Rent vs Own
- Severe rent burden
- 415.0
Population outlook (Steuben County) Hauer SSP2
- Today (2025)
- 93,062 people
- By 2030
- 89,793 · -3.5%
- By 2040
- 82,353 · -11.5%
- By 2050
- 74,286 · -20.2%
- By 2075
- 55,589 · -40.3%
- By 2100
- 37,587 · -59.6%
Race, ethnicity, and origin ACS 2023
- Neighborhood character
- Predominantly White (92%)
- Race & ethnicity
- White 92% Two or more races 3% Hispanic / Latino 3% Black 2%
- Common ancestry
- Lithuanian 3% Romanian 2% Iranian 2%
- Foreign-born
- 4% · Canada
- Languages at home
- 95% English-only · French/Haitian/Cajun 2% Arabic 1% Spanish 1%
Political lean MEDSL · Steuben
- 2024 margin
- Solid R (+31.8) · D 34.1% · R 65.9%
- 2008→2024 swing
- -15.0pp toward R · 2008: -16.8pp · 2024: -31.8pp
- All cycles
- 2024: R+31.8 2020: R+29.6 2016: R+36.2 2012: R+16.4 2008: R+16.8
Not yet ingested
- Civics
- —
Market trends
- HPI YoY
- ▲ 3.95%
- Current HPI
- 210.1986
- Rent YoY
- —
- Metro
- Corning, NY
- State GDP YoY
- ▲ 2.60%
- F500 in state
- 92
Industry mix (Fortune 500 HQ in NY)
| Industry | F500 HQs | Revenue |
|---|---|---|
| Financial Services | 10 | $950B |
|
||
| Consumer Goods | 9 | $162B |
|
||
| Insurance | 4 | $225B |
|
||
| Telecommunications | 2 | $144B |
|
||
| Pharmaceuticals | 2 | $112B |
|
||
| Media / Entertainment | 2 | $69B |
|
||
Price history
+539.6% since first listed3 events — show timeline
- 2026-05-18 Listed $159,900 UNYREIS
- 2006-12-07 Sold (Public Records) $59,500 Public Records
- 2006-03-09 Sold (Public Records) $25,000 Public Records
Property tax history
-0.4%/yrLatest (2025): $1,772 · -0.5% YoY. Source: county tax records.
Cash-flow waterfall
monthlySold comps — $/sqft
last 12 mo · ≤1 miLoading sold comps…