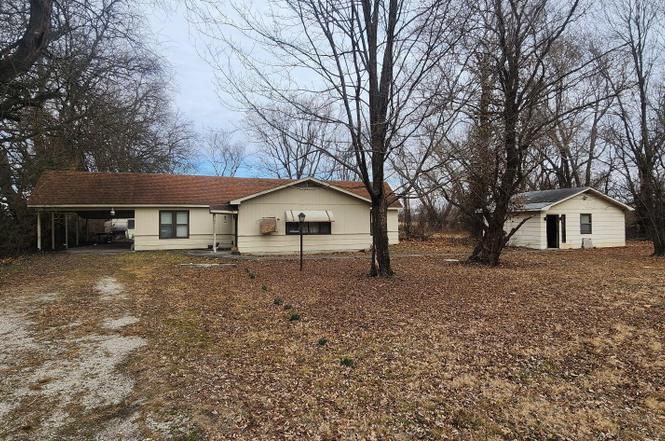
6251 SE Varck Rd · Riverton, KS
Flood risk 1/10 · Minimal
- FEMA flood zone
- A
- Chance of flooding over 30 yrs
- 0.0%
- Est. flood insurance / yr
- $1,009 – $1,996
Fire risk 4/10 · Minor
- Est. fire insurance / yr
- $1,154 – $2,142
Heat risk 5/10 · Moderate
- Hot days now (above 108°F)
- 7 days/yr
- Hot days in 30 yrs
- 20 days/yr
Wind risk 2/10 · Minimal
- Chance of severe wind over 30 yrs
- 2.0%
Air-quality risk 2/10 · Minimal
- Unhealthy air days now
- 1 days/yr
- Unhealthy air days in 30 yrs
- 1 days/yr
Risk factors via First Street. Map © Google.
Why this score? — see what drove the B grade
The composite is a weighted blend of 9 inputs, each scored 0–100. Each bar is that input's sub-score; the figure is the points it added to the 100-point composite (weight × sub-score).
- Cash flow +30.0/30.0
- DSCR +10.0/10.0
- 1% rule +9.9/10.0
- ARV discount +7.5/15.0
- Appreciation +7.3/10.0
- Livability +3.1/5.0
- Rent growth +2.5/5.0
- Condition / age +2.5/5.0
- Schools +2.2/10.0
$75,000
🖨 Deal sheet 📄 Offer letter ✓ Due diligence
Key facts
- Breezeway area
- Rural water
- Great location
Tags
Property features AI
Exterior
- Parking: Has carport; 1 carport space; 2-car attached carport
- Utilities: Septic tank
- Home design: Single family residence (freestanding); Residential property
- Construction: Wood siding
- Exterior features: Composition roof; Level topography; Storage structure on property
Interior
- Bedrooms: 7 total rooms (includes bedrooms and living spaces)
- Flooring: Carpet
- Bathrooms: 1 full bathroom
- Heating & cooling: Has heating; Ceiling fan(s); Window unit(s)
- Interior features: Ceiling fan(s); No fireplace
Neighborhood map
What this means for you Summary
Snapshot
- This is a 3-bed/1.5-bath single-family listed at $75k.
Deal economics
- At list price, monthly cash flow is $212 ($3k/yr) — positive.
- The deal already cash-flows at list — no discount required.
- Meets the 1% rule at list price ($1k rent vs $75k).
- Recommended offer: $66k (12.0% below list) — sets the bar for market timing.
Location & tenants
- Location reads 61/100 on livability (#398 in KS) — a middle-class / working-renter tenant base. Strengths: cost of living A+, housing A+; Watch: employment D+, crime F, amenities F.
- Riverton (town): math 19% / reading 32% proficiency, ranked #133 of 169 in KS (top 79%) — low school quality limits family demand, transient renter base, plan for 1-2y turnover.
- Zoned schools: Riverton Elem (math 22% / reading 37%, grade F, #463 of 684 statewide, top 73%, 311 students, 57% FRL); Riverton Middle (math 12% / reading 27%, grade F, #152 of 219 statewide, top 72%, 170 students, 57% FRL).
- Market conditions: 9 active listings in the ZIP; 17 units permitted in Cherokee County in 2024 (0 in 5+ unit buildings).
Forward outlook
- In year one you build about $4k of equity ($519 loan paydown + $3k appreciation (4.5% local appreciation)).
- Cherokee County population projected at -26% by 2050 — secular population decline; favor cash flow + early exit over multi-decade hold.
- At projected returns (4.5% appreciation + 3.0% rent growth), your $21k cash investment doubles in ~4 years — after that, you're playing with house money.
- By year 9, paydown + projected appreciation supports a ~$34k cash-out refi (75% LTV) — recoverable capital for the next deal without selling this one.
Negotiation context
- It's been on market 122 days — a 12% lower offer ($66k) is reasonable based on typical stale-listing flexibility.
Risks & watch-outs
- Watch-outs: flood insurance adds $125/mo; built in 1910 — expect roof / HVAC / electrical / plumbing capex.
- Climate carrying-cost: in FEMA flood zone A (mandatory federal flood insurance); extreme-heat days projected 7→20/yr by 2055 (HVAC capex compounding) — expect insurance premiums to compound above CPI over the hold.
Questions for the listing agent
- It's been on market 122 days. Have you received any prior offers? Is the seller open to a 12% concession, seller financing, or rate buy-down credit?
- Built in 1910 — when were the roof, HVAC, electrical panel, plumbing, and water heater last replaced?
- What's the actual annual flood-insurance premium (NFIP or private), and is the property in a SFHA with mandatory coverage?
- Why hasn't it sold? Are there any deal-killer items the seller is aware of (foundation, flood, title, zoning, code violations)?
- Is there a deadline driving the sale (1031 exchange, divorce, estate, relocation)? That informs how much negotiation room exists.
- Schools are D-rated, which usually means shorter tenancies and higher turnover. Who's the typical renter profile here, and what's been the actual vacancy rate?
- Crime grade is F in this area — have there been break-ins, vandalism, or insurance claims at this property in the last 3 years? What carrier currently insures it and at what premium?
- What's the average days-on-market for RENTAL listings here right now (not sales)? A rising rental-DOM trend means longer vacancies and softer asking-rent achievability than the comps imply.
- What's the recent tenant-quality profile in this submarket — average credit score on applications, eviction rate, late-payment / NSF rate, and stable-employment percentage? A property-management company in the area should have these aggregated.
- How much new for-sale + rental construction is in the pipeline within 1–3 miles? Heavy new supply typically softens prices + rents 12–24 months out; constrained supply supports both.
Investment metrics
- 1% rule
- 1.49% ✓
- Cap rate
- 11.68%
- Cash-on-cash
- 19.24%
- DSCR
- 1.86
- GRM
- 5.6
CMA / ARV
No comps found within radius.
Projected returns pro-forma
4.54% appreciation · 3.0% rent growth · sell at horizon
- IRR
- 22.4%
- Equity multiple
- 2.38×
- Total profit
- $28,907
- Equity at exit
- $40,409
- IRR
- 22.2%
- Equity multiple
- 4.66×
- Total profit
- $76,944
- Equity at exit
- $68,068
Cash invested: $21,000 (down + closing). Projections, not guarantees.
Landlord ↔ Tenant lean methodology
- Overall (STATE)
- 83 Strongly Landlord-Friendly
- State Kansas
- 83 Strongly Landlord-Friendly · R+10
- County
- — inherits STATE
- City
- — inherits STATE
ZIP-level market 66770
- Home prices YoY
- 2.3%
- Active inventory
- 9
- Price-to-rent
- 5.6×
Monthly cashflow live
- Estimated rent
- $1,120 medium interval (Pro) →
- Mortgage (P&I)
- −$393
- Tax from tax record
- −$123 /mo · $1,478/yr
- Insurance
- −$31
- Flood insurance flood zone
- −$125 /mo · $1,502/yr
- HOA
- −$0
- Vacancy / Maint / Mgmt
- −$235
- Net cashflow
- $212
Break-even live
UW: 25.0% down · 7.5% · 30yr · 1.5% tax · 5.0% vac · 8.0% maint · 8.0% mgmt
Financing live
Cash to close
- Down payment
- $18,750
- Closing costs
- $2,250
- Reserves months
- —
- Total cash needed
- —
Loan-product check · same deal, 3 products live
Conventional
25% down · 7.5% · 30yr
- Down + closing
- —
- Monthly P&I
- —
- Monthly cashflow
- —
- DSCR
- —
- Eligible?
- —
Personal DTI + credit; lowest rate.
DSCR
20% down · 8.5% · 30yr
- Down + closing
- —
- Monthly P&I
- —
- Monthly cashflow
- —
- DSCR
- —
- Eligible?
- —
No personal income docs; deal must DSCR.
Hard money
10% down · 12.0% · 12mo
- Down + closing
- —
- Monthly P&I
- —
- Monthly cashflow
- —
- DSCR
- —
- Eligible?
- —
Short-term bridge; refi at stabilization.
Listing history 16 events
-
2026-06-15status $75,000 Pending 122 DOM
-
2026-06-15days on market $75,000 Active 122 DOM
-
2026-06-14days on market $75,000 Active 120 DOM
-
2026-06-13days on market $75,000 Active 119 DOM
-
2026-06-10days on market $75,000 Active 117 DOM
-
2026-06-09days on market $75,000 Active 116 DOM
-
2026-06-08days on market $75,000 Active 115 DOM
-
2026-06-07days on market $75,000 Active 114 DOM
-
2026-06-05days on market $75,000 Active 111 DOM
-
2026-06-02days on market $75,000 Active 109 DOM
-
2026-06-01days on market $75,000 Active 108 DOM
-
2026-05-31days on market $75,000 Active 107 DOM
-
2026-05-30days on market $75,000 Active 106 DOM
-
2026-05-19price $75,000
-
2026-03-28price $85,000
-
2026-02-13$100,000 Active
ⓘ Source: listings_history table (triggers on properties + properties_extension) + one-shot
backfill from property_details.listing_events for pre-trigger history.
Tax reassessment forecast KS · Resets to sale price
- Current annual tax
- $1,478 · $123/mo
- Projected year-2 tax
- $1,478 · $123/mo
- Expected delta
- $0/yr ($0/mo · 0.0%)
ⓘ Screening estimate from a state-policy table — verify with the county assessor before closing.
Climate risk First Street
- Flood 1/10 Low FEMA zone A · 0% chance over 30 yrs
- Wildfire 4/10 Moderate
- Heat 5/10 Major 7 d/yr ≥108°F today · 20 d/yr by 30 yrs out
- Wind 2/10 Low 2% chance of damaging wind over 30 yrs
- Air quality 2/10 Low 1 unhealthy d/yr today · 1 by 30 yrs out
Nearby sold comps map
Loading sold comps map…
Walkable amenities ~0.75 mi
Loading nearby amenities…
Taxation est. · year 1
- Rental income
- $13,435
- − Mortgage interest
- −$4,201
- − Property taxes
- −$1,478
- − Insurance
- −$1,877
- − Repairs & maintenance
- −$1,075
- − Management
- −$1,075
- − Depreciation
- −$2,182
- Taxable income
- $1,547
- Est. tax owed @ 24.0%
- −$371
- After-tax cash flow
- $2,168/yr
For passive investors: Depreciation is non-cash, so a rental often shows a tax loss while cash-flowing — sheltering income. Rental losses are passive: they offset passive income freely, and up to $25,000/yr can offset ordinary (W-2) income if you actively participate and your MAGI is under $100k (phasing out to $0 by $150k); unused losses carry forward. On sale, claimed depreciation is recaptured at up to 25%, and gains may owe capital-gains tax (a 1031 exchange can defer both). Figures are a year-1 estimate at your 24.0% rate — not tax advice; consult a CPA.
Schools (NCES district)
- District
- Riverton
- NCES district ID
- 2011130
- Math proficiency
- 19% ▼ -2.00%
- Reading proficiency
- 32% ▲ 2.00%
- Median HH income
- $47,071
- Composite
- 22.14/100
- National rank
- #8172
- State rank
- #133 of 169 in KS
Livability — Riverton
- Score
- 61/100
- State rank
- #398
- US rank
- #17560
Category grades
Schools grade is shown separately in the Schools card above.
Census & demographics
- Census place
- Riverton, KS
- Population (ZIP)
- 860
Population outlook (Cherokee County) Hauer SSP2
- Today (2025)
- 18,848 people
- By 2030
- 17,862 · -5.2%
- By 2040
- 15,850 · -15.9%
- By 2050
- 13,915 · -26.2%
- By 2075
- 10,102 · -46.4%
- By 2100
- 6,977 · -63.0%
Race, ethnicity, and origin ACS 2023
- Neighborhood character
- Predominantly White (96%)
- Race & ethnicity
- White 96% Two or more races 3% Native American 1%
- Common ancestry
- Italian 10% Iranian 5% Lithuanian 3%
- Foreign-born
- 2%
- Languages at home
- 95% English-only · French/Haitian/Cajun 5%
Political lean MEDSL · Cherokee
- 2024 margin
- Solid R (+52.9) · D 22.6% · R 75.5% · Other 1.9%
- 2008→2024 swing
- -29.2pp toward R · 2008: -23.7pp · 2024: -52.9pp
- All cycles
- 2024: R+52.9 2020: R+49.9 2016: R+48.4 2012: R+29.5 2008: R+23.7
Not yet ingested
- Civics
- —
Market trends
- HPI YoY
- ▲ 4.54%
- Current HPI
- 201.4548
- Rent YoY
- —
- Metro
- —
- State GDP YoY
- —
- F500 in state
- 0
Price history
-25.0% since first listed3 events — show timeline
- 2026-05-19 Price Changed $75,000 OGAR
- 2026-03-28 Price Changed $85,000 OGAR
- 2026-02-13 Listed $100,000 OGAR
Property tax history
+7.2%/yrLatest (2025): $1,478 · +11.4% YoY. Source: county tax records.
Cash-flow waterfall
monthlySold comps — $/sqft
last 12 mo · ≤1 miLoading sold comps…