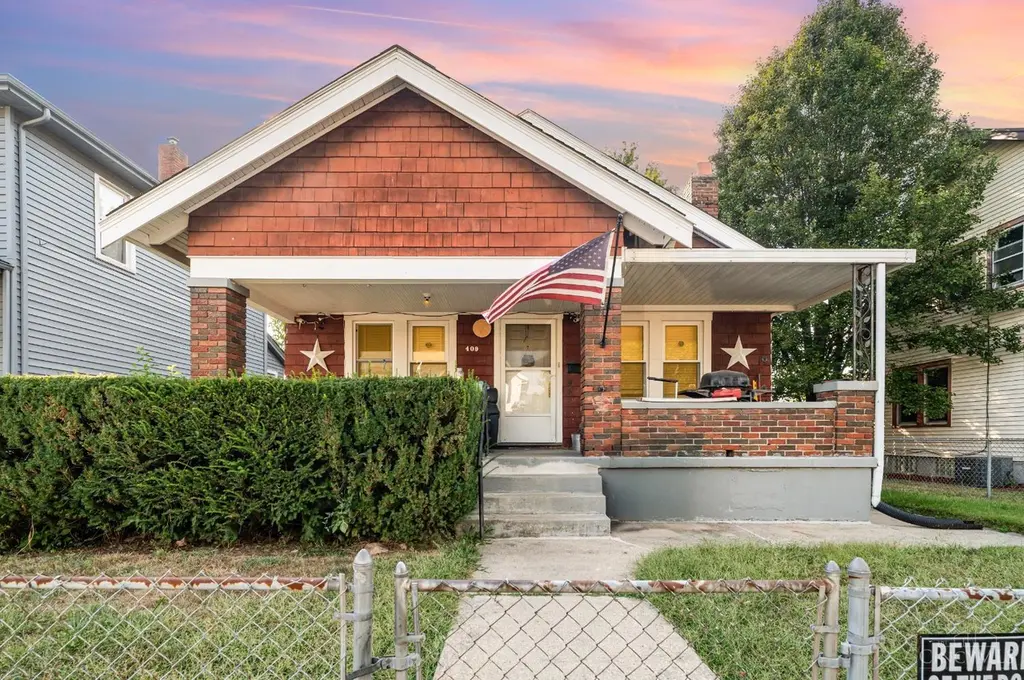
409 N E St · Hamilton, OH
Flood risk 1/10 · Minimal
- FEMA flood zone
- X (unshaded)
- Chance of flooding over 30 yrs
- 0.0%
- Est. flood insurance / yr
- $507 – $1,088
Fire risk 1/10 · Minimal
- Est. fire insurance / yr
- $713 – $1,323
Heat risk 4/10 · Minor
- Hot days now (above 104°F)
- 7 days/yr
- Hot days in 30 yrs
- 19 days/yr
Wind risk 2/10 · Minimal
- Chance of severe wind over 30 yrs
- 1.0%
Air-quality risk 3/10 · Minor
- Unhealthy air days now
- 2 days/yr
- Unhealthy air days in 30 yrs
- 3 days/yr
Risk factors via First Street. Map © Google.
Why this score? — see what drove the C grade
The composite is a weighted blend of 9 inputs, each scored 0–100. Each bar is that input's sub-score; the figure is the points it added to the 100-point composite (weight × sub-score).
- Cash flow +20.9/30.0
- ARV discount +12.9/15.0
- DSCR +6.6/10.0
- 1% rule +5.1/10.0
- Livability +3.7/5.0
- Schools +3.6/10.0
- Rent growth +3.4/5.0
- Condition / age +2.5/5.0
- Appreciation +0.0/10.0
$189,900
🖨 Deal sheet 📄 Offer letter ✓ Due diligence
Listing remarks MLS
Fantastic opportunity in a quiet, up-and-coming Hamilton neighborhood! This brick and wood-sided ranch/bungalow offers 3 bedrooms on the main level, a possible 4th bedroom in the finished lower level, and 1,183 sq ft of above-grade living space. Features include hardwood floors, a full bath on the main floor, and a half bath in the lower level. The flexible floor plan provides great potential for renovation, value-add updates, and instant equity growth. A two-car detached garage adds extra storage, parking, or workshop spaceperfect for today's buyers. Located in a walkable community just steps from schools, parks, shops, dining, and public transportation, this home is ideal for those seeking convenience, neighborhood charm, and long-term upside. Whether you're an investor, a first-time homebuyer, or a DIY renovator, this property offers incredible potential and tons of curb appeal. Bring your vision and make this home your next success story!
Key facts
- Brick and wood-sided
- Flexible floor plan
- Walkable community
Tags
Neighborhood map
What this means for you Summary
Snapshot
- This is a 3-bed/1.5-bath single-family listed at $190k.
Deal economics
- At list price, monthly cash flow is $264 ($3k/yr) — positive.
- The deal already cash-flows at list — no discount required.
- Meets the 1% rule at list price ($2k rent vs $190k).
- Recommended offer: $167k (12.0% below list) — sets the bar for market timing.
- Cap rate 8.0% vs local median 4.6% in Hamilton — top-decile yield for the area; either an underpriced asset or a hidden risk that comps aren't pricing in. Stress-test before assuming the spread holds.
Location & tenants
- Location reads 73/100 on livability (#332 in OH) — a middle-class / working-renter tenant base. Strengths: cost of living A+, housing A+, schools B; Watch: crime C-, amenities C-, employment D.
- Hamilton City (suburban): math 42% / reading 45% proficiency, ranked #517 of 656 in OH (top 79%) — families likely to look elsewhere, expect single-tenant / working-renter base with shorter leases; 63% free/reduced lunch — lower-income household profile, screen leases tightly.
- Market conditions: Rents rising (+3.7%/yr); 127 active listings in the ZIP; 8 comparable units currently listed for rent nearby; rentals at typical pace (median 24d on market — plan ~3-4 weeks tenant-placement turnaround); 1,163 units permitted in Butler County in 2024 (356 in 5+ unit buildings).
- This rent runs 31% of the median local income ($74k/yr) — at the standard rent-burdened threshold; future hikes will face affordability resistance.
Forward outlook
- Local home prices are declining (-3.0%/yr); year-one equity from $1k of loan paydown is wiped out by about $6k of value loss. Plan a longer hold.
Negotiation context
- It's been on market 216 days — a 12% lower offer ($167k) is reasonable based on typical stale-listing flexibility.
- Current owner paid $45k; list at $190k implies a 322% gain — meaningful room to come down on a strong offer.
Risks & watch-outs
- Watch-outs: built in 1929 — expect roof / HVAC / electrical / plumbing capex.
Questions for the listing agent
- It's been on market 216 days. Have you received any prior offers? Is the seller open to a 12% concession, seller financing, or rate buy-down credit?
- Built in 1929 — when were the roof, HVAC, electrical panel, plumbing, and water heater last replaced?
- Why hasn't it sold? Are there any deal-killer items the seller is aware of (foundation, flood, title, zoning, code violations)?
- Is there a deadline driving the sale (1031 exchange, divorce, estate, relocation)? That informs how much negotiation room exists.
- Schools are B-rated — typically a magnet for longer-tenancy family renters. What's the average tenant stay here, and is there a school-zone premium baked into asking?
- What's the average days-on-market for RENTAL listings here right now (not sales)? A rising rental-DOM trend means longer vacancies and softer asking-rent achievability than the comps imply.
- What's the recent tenant-quality profile in this submarket — average credit score on applications, eviction rate, late-payment / NSF rate, and stable-employment percentage? A property-management company in the area should have these aggregated.
- How much new for-sale + rental construction is in the pipeline within 1–3 miles? Heavy new supply typically softens prices + rents 12–24 months out; constrained supply supports both.
Investment metrics
- 1% rule
- 1.01% ✓
- Cap rate
- 7.96%
- Cash-on-cash
- 5.95%
- DSCR
- 1.26
- GRM
- 8.3
CMA / ARV
- ARV (median comp)
- $215,674
- List price
- $189,900
- Delta
- -11.95%
- Verdict
- UNDERPRICED
- Comps
- 20 within 1.0 mi
Show comp detail 12 sales within ~0.75 mi
| Address | Dist | Beds/Ba | Sqft | Sold | Price | $/sf | Match |
|---|---|---|---|---|---|---|---|
| 430 Elvin Ave | 0.09mi | 4/2.5 (+1) | 2,090 (+3%) | 5mo | $315,000 | $151 | 78 |
| 501 Prytania Ave | 0.20mi | 3/1.5 | 1,874 (-8%) | 7mo | $190,000 | $101 | 72 |
| 834 Ross Ave | 0.51mi | 3/1.5 | 2,032 (+0%) | 6mo | $100,000 | $49 | 71 |
| 1156 Cleveland Ave | 0.74mi | 3/1.0 | 2,083 (+3%) | 0mo | $255,000 | $122 | 59 |
| 500 Marcia Ave | 0.46mi | 2/1.5 (-1) | 1,885 (-7%) | 7mo | $397,500 | $211 | 56 |
| 677 Franklin St | 0.48mi | 3/2.0 | 1,820 (-10%) | 4mo | $126,000 | $69 | 55 |
| 317 Main St | 0.38mi | 4/2.0 (+1) | 1,732 (-15%) | 4mo | $317,000 | $183 | 47 |
| 114 Milville Ave | 0.44mi | 3/2.0 | 1,729 (-15%) | 7mo | $240,000 | $139 | 47 |
| 802 Lawn Ave | 0.62mi | 2/2.0 (-1) | 1,872 (-8%) | 10mo | $290,000 | $155 | 42 |
| 225 Millville Ave | 0.51mi | 4/1.5 (+1) | 2,322 (+14%) | 6mo | $285,000 | $123 | 42 |
| 222 Millikin St | 0.74mi | 3/2.5 | 1,790 (-12%) | 1mo | $285,000 | $159 | 42 |
| 610 Armo Ave | 0.71mi | 3/2.0 | 1,770 (-13%) | 6mo | $275,000 | $155 | 39 |
Match score weights: distance 35% · size 25% · config 20% · recency 20%. Top-matched comps best support the ARV.
Projected returns pro-forma
-3.0% appreciation · 3.69% rent growth · sell at horizon
- IRR
- -6.4%
- Equity multiple
- 0.76×
- Total profit
- $-12,647
- Equity at exit
- $28,315
- IRR
- 4.0%
- Equity multiple
- 1.30×
- Total profit
- $16,154
- Equity at exit
- $16,419
Cash invested: $53,172 (down + closing). Projections, not guarantees.
Landlord ↔ Tenant lean methodology
- Overall (STATE)
- 73 Landlord-Friendly
- State Ohio
- 73 Landlord-Friendly · R+6
- County
- — inherits STATE
- City
- — inherits STATE
ZIP-level market 45013
- Rents YoY
- 3.7%
- Active inventory
- 127
- Price-to-rent
- 8.3×
Monthly cashflow live
- Estimated rent
- $1,917 high interval (Pro) →
- Mortgage (P&I)
- −$996
- Tax from tax record
- −$176 /mo · $2,114/yr
- Insurance
- −$79
- HOA
- −$0
- Vacancy / Maint / Mgmt
- −$403
- Net cashflow
- $264
Break-even live
UW: 25.0% down · 7.5% · 30yr · 1.5% tax · 5.0% vac · 8.0% maint · 8.0% mgmt
Financing live
Cash to close
- Down payment
- $47,475
- Closing costs
- $5,697
- Reserves months
- —
- Total cash needed
- —
Loan-product check · same deal, 3 products live
Conventional
25% down · 7.5% · 30yr
- Down + closing
- —
- Monthly P&I
- —
- Monthly cashflow
- —
- DSCR
- —
- Eligible?
- —
Personal DTI + credit; lowest rate.
DSCR
20% down · 8.5% · 30yr
- Down + closing
- —
- Monthly P&I
- —
- Monthly cashflow
- —
- DSCR
- —
- Eligible?
- —
No personal income docs; deal must DSCR.
Hard money
10% down · 12.0% · 12mo
- Down + closing
- —
- Monthly P&I
- —
- Monthly cashflow
- —
- DSCR
- —
- Eligible?
- —
Short-term bridge; refi at stabilization.
Rent comps 8 comps
| Address | Beds | Baths | Sqft | Rent | $/sqft | DOM | Units | Dist |
|---|---|---|---|---|---|---|---|---|
| 307 N E St Hamilton, OH | 4.0 | 1.5 | 1466 | $1,450 | $0.99 | 43d | 1 | 0.15mi |
| 547 Rhea Ave Hamilton, OH | 3.0 | 2.5 | 1412 | $2,300 | $1.63 | 43d | 1 | 0.16mi |
| 501 Prytania Ave Hamilton, OH | 3.0 | 1.5 | 1874 | $2,275 | $1.21 | 1d | 1 | 0.18mi |
| 157 Sherman Ave Hamilton, OH | 4.0 | 2.0 | 1498 | $2,100 | $1.40 | 7d | 1 | 0.20mi |
| 121 Gordon Ave Hamilton, OH | 4.0 | 2.0 | 1880 | $1,975 | $1.05 | 16d | 1 | 0.50mi |
| 401 Hyde Park Dr Hamilton, OH | 3.0 | 2.0 | 1929 | $1,750 | $0.91 | 14d | 1 | 0.90mi |
| 306 N 6th St Hamilton, OH | 3.0 | 1.5 | 1776 | $1,975 | $1.11 | 43d | 1 | 1.00mi |
| 1025 Heaton St Hamilton, OH | 2.0 | 1.0 | 1436 | $1,025 | $0.71 | 23d | 1 | 1.33mi |
Listing history 15 events
-
2026-06-18days on market $189,900 Active 216 DOM
-
2026-06-17days on market $189,900 Active 215 DOM
-
2026-06-16days on market $189,900 Active 214 DOM
-
2026-06-15days on market $189,900 Active 213 DOM
-
2026-06-13days on market $189,900 Active 211 DOM
-
2026-06-13days on market $189,900 Active 210 DOM
-
2026-06-09days on market $189,900 Active 207 DOM
-
2026-06-08days on market $189,900 Active 206 DOM
-
2026-06-07days on market $189,900 Active 205 DOM
-
2026-06-03days on market $189,900 Active 201 DOM
-
2026-06-02days on market $189,900 Active 200 DOM
-
2026-06-01days on market $189,900 Active 199 DOM
-
2026-05-31days on market $189,900 Active 198 DOM
-
2025-11-14$189,900 Active 965-char remark
Show marketing remark (965 chars)
Fantastic opportunity in a quiet, up-and-coming Hamilton neighborhood! This brick and wood-sided ranch/bungalow offers 3 bedrooms on the main level, a possible 4th bedroom in the finished lower level, and 1,183 sq ft of above-grade living space. Features include hardwood floors, a full bath on the main floor, and a half bath in the lower level. The flexible floor plan provides great potential for renovation, value-add updates, and instant equity growth. A two-car detached garage adds extra storage, parking, or workshop spaceperfect for today's buyers. Located in a walkable community just steps from schools, parks, shops, dining, and public transportation, this home is ideal for those seeking convenience, neighborhood charm, and long-term upside. Whether you're an investor, a first-time homebuyer, or a DIY renovator, this property offers incredible potential and tons of curb appeal. Bring your vision and make this home your next success story!
-
1985-04-01soldstatus $45,000
ⓘ Source: listings_history table (triggers on properties + properties_extension) + one-shot
backfill from property_details.listing_events for pre-trigger history.
Tax reassessment forecast OH · Partial reset (capped growth)
- Current annual tax
- $2,114 · $176/mo
- Projected year-2 tax
- $2,538 · $212/mo
- Expected delta
- +$424/yr (+$35/mo · 20.1%)
ⓘ Screening estimate from a state-policy table — verify with the county assessor before closing.
Climate risk First Street
- Flood 1/10 Low FEMA zone X (unshaded) · 0% chance over 30 yrs
- Wildfire 1/10 Low
- Heat 4/10 Moderate 7 d/yr ≥104°F today · 19 d/yr by 30 yrs out
- Wind 2/10 Low 100% chance of damaging wind over 30 yrs
- Air quality 3/10 Moderate 2 unhealthy d/yr today · 3 by 30 yrs out
Nearby sold comps map
Loading sold comps map…
Walkable amenities ~0.75 mi
Loading nearby amenities…
Taxation est. · year 1
- Rental income
- $23,010
- − Mortgage interest
- −$10,637
- − Property taxes
- −$2,114
- − Insurance
- −$950
- − Repairs & maintenance
- −$1,841
- − Management
- −$1,841
- − Depreciation
- −$5,524
- Taxable income
- $103
- Est. tax owed @ 24.0%
- −$25
- After-tax cash flow
- $3,139/yr
For passive investors: Depreciation is non-cash, so a rental often shows a tax loss while cash-flowing — sheltering income. Rental losses are passive: they offset passive income freely, and up to $25,000/yr can offset ordinary (W-2) income if you actively participate and your MAGI is under $100k (phasing out to $0 by $150k); unused losses carry forward. On sale, claimed depreciation is recaptured at up to 25%, and gains may owe capital-gains tax (a 1031 exchange can defer both). Figures are a year-1 estimate at your 24.0% rate — not tax advice; consult a CPA.
Schools (NCES district)
- District
- Hamilton City
- NCES district ID
- 3904410
- Math proficiency
- 42% ▼ -13.00%
- Reading proficiency
- 45% ▼ -10.00%
- Median HH income
- $40,488
- Composite
- 36.48/100
- National rank
- #4656
- State rank
- #517 of 656 in OH
Livability — Hamilton
- Score
- 73/100
- State rank
- #332
- US rank
- #5467
Category grades
Schools grade is shown separately in the Schools card above.
Census & demographics
- Census place
- Hamilton, OH
- County
- Butler County · 381,674 people
- City population
- 140,900
- Metro
- Cincinnati, OH-KY-IN
- Population (ZIP)
- 53,998
- Household income
- $73,633
- Rent vs Own
- Severe rent burden
- 1047.0
Population outlook (Butler County) Hauer SSP2
- Today (2025)
- 387,706 people
- By 2030
- 392,028 · +1.1%
- By 2040
- 395,307 · +2.0%
- By 2050
- 391,116 · +0.9%
- By 2075
- 378,642 · -2.3%
- By 2100
- 343,248 · -11.5%
Race, ethnicity, and origin ACS 2023
- Neighborhood character
- Predominantly White (88%)
- Race & ethnicity
- White 88% Two or more races 6% Hispanic / Latino 4% Black 3%
- Common ancestry
- Lithuanian 2% Romanian 2% Slovak 2%
- Foreign-born
- 2% · Canada
- Languages at home
- 97% English-only · Spanish 2%
Political lean MEDSL · Butler
- 2024 margin
- Strong R (+26.3) · D 36.4% · R 62.7%
- 2008→2024 swing
- -3.6pp toward R · 2008: -22.6pp · 2024: -26.3pp
- All cycles
- 2024: R+26.3 2020: R+24.0 2016: R+28.3 2012: R+26.2 2008: R+22.6
Not yet ingested
- Civics
- —
Market trends
- HPI YoY
- ▼ -210.85%
- Current HPI
- 237.0239
- Rent YoY
- ▲ 3.69%
- Metro
- Cincinnati, OH-KY-IN
- State GDP YoY
- ▲ 1.98%
- F500 in state
- 48
Industry mix (Fortune 500 HQ in OH)
| Industry | F500 HQs | Revenue |
|---|---|---|
| Insurance | 3 | $145B |
|
||
| Industrial Machinery | 3 | $49B |
|
||
| Financial Services | 3 | $24B |
|
||
| Consumer Goods | 2 | $93B |
|
||
| Aerospace / Defense | 2 | $47B |
|
||
| Utilities | 2 | $33B |
|
||
Price history
+322.0% since first listed2 events — show timeline
- 2025-11-14 Listed $189,900 Cincy MLS
- 1985-04-01 Sold (Public Records) $45,000 Public Records
Property tax history
+4.8%/yrLatest (2025): $2,114 · +0.5% YoY. Source: county tax records.
Cash-flow waterfall
monthlySold comps — $/sqft
last 12 mo · ≤1 miLoading sold comps…