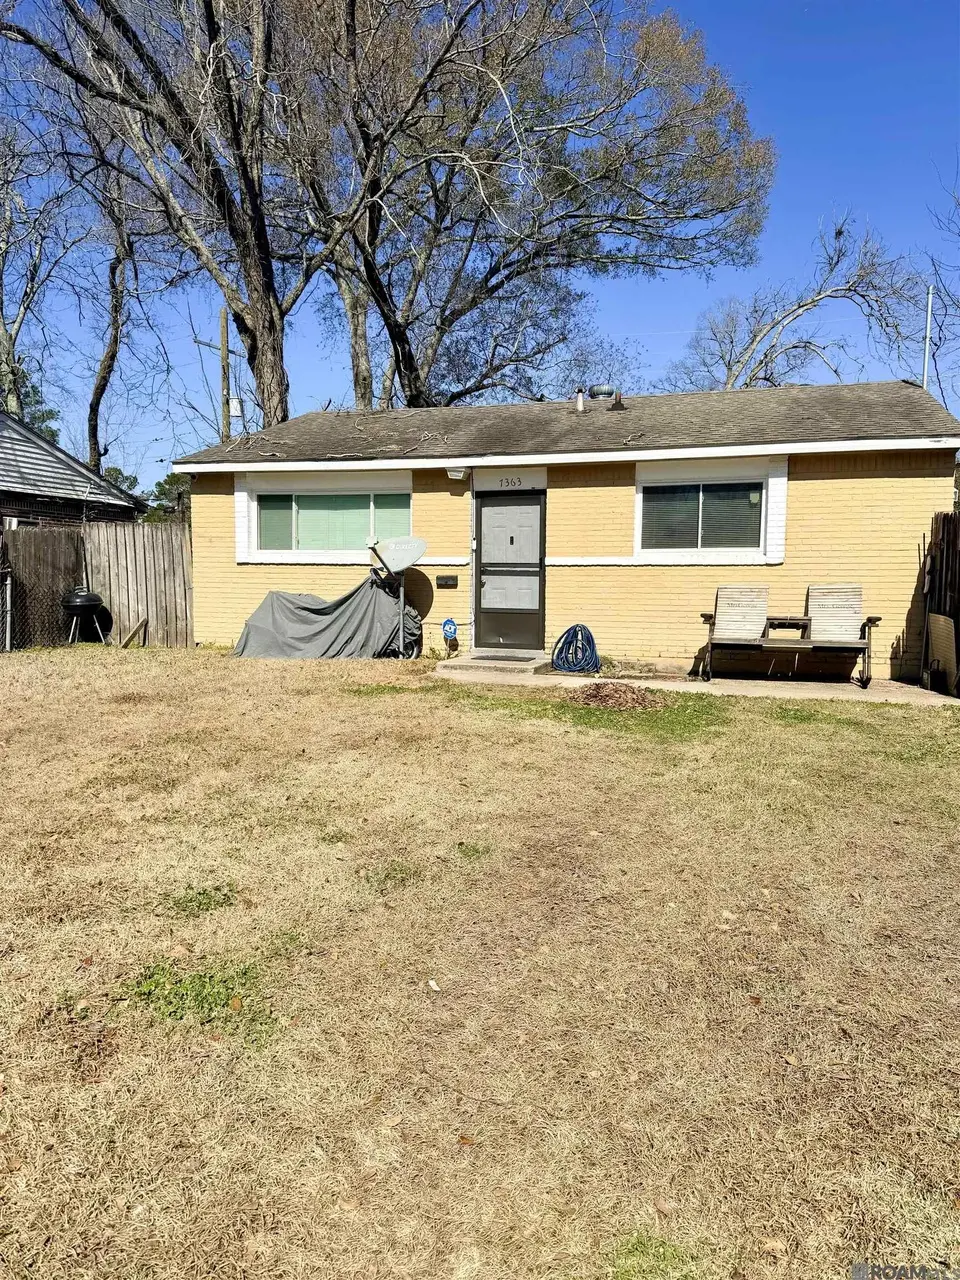
7363 Richey Dr · Merrydale, LA
Flood risk 1/10 · Minimal
- FEMA flood zone
- X (shaded)
- Chance of flooding over 30 yrs
- 0.0%
- Est. flood insurance / yr
- $507 – $1,088
Fire risk 1/10 · Minimal
- Est. fire insurance / yr
- $1,269 – $2,357
Heat risk 8/10 · Major
- Hot days now (above 108°F)
- 7 days/yr
- Hot days in 30 yrs
- 20 days/yr
Wind risk 9/10 · Severe
- Chance of severe wind over 30 yrs
- 99.0%
Air-quality risk 3/10 · Minor
- Unhealthy air days now
- 3 days/yr
- Unhealthy air days in 30 yrs
- 4 days/yr
Risk factors via First Street. Map © Google.
Why this score? — see what drove the C+ grade
The composite is a weighted blend of 9 inputs, each scored 0–100. Each bar is that input's sub-score; the figure is the points it added to the 100-point composite (weight × sub-score).
- Cash flow +25.5/30.0
- DSCR +8.5/10.0
- Appreciation +8.0/10.0
- 1% rule +6.1/10.0
- Livability +2.9/5.0
- Rent growth +2.5/5.0
- Condition / age +2.5/5.0
- ARV discount +2.4/15.0
- Schools +2.4/10.0
$79,000
🖨 Deal sheet 📄 Offer letter ✓ Due diligence
Listing remarks MLS
Whether you're looking to expand your investment portfolio or purchase your first home, this 3-bedroom brick home offers a solid opportunity. The home sits on a slab foundation and features prior interior updates including flooring throughout, interior paint, windows, panel-raised doors, gas hot water heater, and light fixtures. Property is currently tenant occupied, providing immediate rental income potential for investors, while also offering an affordable option for owner occupants seeking a well-maintained home.
Key facts
- Slab foundation
- Well maintained home
- Brick home
Tags
Neighborhood map
What this means for you Summary
Snapshot
- This is a 3-bed/1.0-bath single-family listed at $79k.
Deal economics
- At list price, monthly cash flow is $185 ($2k/yr) — positive.
- The deal already cash-flows at list — no discount required.
- Meets the 1% rule at list price ($879 rent vs $79k).
- Recommended offer: $74k (6.0% below list) — sets the bar for market timing.
Location & tenants
- Location reads 58/100 on livability (#301 in LA) — a working-class tenant base; expect higher turnover. Strengths: cost of living A+, housing A; Watch: schools C-, crime F, amenities F.
- East Baton Rouge Parish (urban): math 22% / reading 34% proficiency, ranked #47 of 98 in LA (top 48%) — low school quality limits family demand, transient renter base, plan for 1-2y turnover; 77% free/reduced lunch — lower-income household profile, screen leases tightly.
- Market conditions: 39 active listings in the ZIP; 8 comparable units currently listed for rent nearby; rentals lingering (median 44d on market — plan ~5-8 weeks vacancy on turnover, expect pricing pressure); 50% of comp listings sitting > 30 days — soft ceiling on asking rent; 2,252 units permitted in East Baton Rouge Parish in 2024 (440 in 5+ unit buildings).
Forward outlook
- In year one you build about $5k of equity ($546 loan paydown + $5k appreciation (5.9% local appreciation)).
- East Baton Rouge County population projected at +4% by 2050 — modest demand growth; plan on rents tracking national, not racing it.
- At projected returns (5.9% appreciation + 3.0% rent growth), your $22k cash investment doubles in ~3 years — after that, you're playing with house money.
- By year 7, paydown + projected appreciation supports a ~$34k cash-out refi (75% LTV) — recoverable capital for the next deal without selling this one.
Negotiation context
- It's been on market 87 days — a 6% lower offer ($74k) is reasonable based on typical stale-listing flexibility.
- 18 sale attempts since 26y ago; this cycle's ask has dropped $6k (7%) from the opening price — seller is motivated, your offer sets the floor, not the list.
- Current owner paid $45k; list at $79k implies a 76% gain — meaningful room to come down on a strong offer.
Risks & watch-outs
- Climate carrying-cost: severe wind risk, 99% chance of damaging wind over 30y; extreme-heat days projected 7→20/yr by 2055 (HVAC capex compounding) — expect insurance premiums to compound above CPI over the hold.
Questions for the listing agent
- It's been on market 87 days. Have you received any prior offers? Is the seller open to a 6% concession, seller financing, or rate buy-down credit?
- Built in 1974 — when were the roof, HVAC, electrical panel, plumbing, and water heater last replaced?
- Why hasn't it sold? Are there any deal-killer items the seller is aware of (foundation, flood, title, zoning, code violations)?
- Is there a deadline driving the sale (1031 exchange, divorce, estate, relocation)? That informs how much negotiation room exists.
- Crime grade is F in this area — have there been break-ins, vandalism, or insurance claims at this property in the last 3 years? What carrier currently insures it and at what premium?
- What's the average days-on-market for RENTAL listings here right now (not sales)? A rising rental-DOM trend means longer vacancies and softer asking-rent achievability than the comps imply.
- What's the recent tenant-quality profile in this submarket — average credit score on applications, eviction rate, late-payment / NSF rate, and stable-employment percentage? A property-management company in the area should have these aggregated.
- How much new for-sale + rental construction is in the pipeline within 1–3 miles? Heavy new supply typically softens prices + rents 12–24 months out; constrained supply supports both.
Investment metrics
- 1% rule
- 1.11% ✓
- Cap rate
- 9.10%
- Cash-on-cash
- 10.04%
- DSCR
- 1.45
- GRM
- 7.5
CMA / ARV
- ARV (median comp)
- $70,987
- List price
- $79,000
- Delta
- 11.29%
- Verdict
- OVERPRICED
- Comps
- 20 within 1.0 mi
Show comp detail 6 sales within ~0.75 mi
| Address | Dist | Beds/Ba | Sqft | Sold | Price | $/sf | Match |
|---|---|---|---|---|---|---|---|
| 5726 Matthews St | 0.09mi | 3/1.0 | 825 (+3%) | 2mo | $44,900 | $54 | 89 |
| 5667 Denova St | 0.08mi | 3/1.0 | 802 (+0%) | 10mo | $70,000 | $87 | 88 |
| 5851 Denova St | 0.14mi | 3/1.0 | 800 (0%) | 10mo | $50,000 | $63 | 85 |
| 6131 Matthews St | 0.29mi | 3/1.0 | 786 (-2%) | 6mo | $105,000 | $134 | 78 |
| 6155 Pontotoc St | 0.33mi | 3/1.0 | 860 (+8%) | 2mo | $95,900 | $112 | 70 |
| 6219 Pontotoc St | 0.37mi | 3/1.0 | 750 (-6%) | 11mo | $45,000 | $60 | 63 |
Match score weights: distance 35% · size 25% · config 20% · recency 20%. Top-matched comps best support the ARV.
Projected returns pro-forma
5.93% appreciation · 3.0% rent growth · sell at horizon
- IRR
- 23.5%
- Equity multiple
- 2.55×
- Total profit
- $34,256
- Equity at exit
- $49,313
- IRR
- 22.3%
- Equity multiple
- 5.14×
- Total profit
- $91,603
- Equity at exit
- $89,127
Cash invested: $22,120 (down + closing). Projections, not guarantees.
Landlord ↔ Tenant lean methodology
- Overall (STATE)
- 90 Strongly Landlord-Friendly
- State Louisiana
- 90 Strongly Landlord-Friendly · R+12
- County
- — inherits STATE
- City
- — inherits STATE
ZIP-level market 70812
- Home prices YoY
- 3.5%
- Active inventory
- 39
- Price-to-rent
- 7.5×
Monthly cashflow live
- Estimated rent
- $879 high interval (Pro) →
- Mortgage (P&I)
- −$414
- Tax from tax record
- −$62 /mo · $748/yr
- Insurance
- −$33
- HOA
- −$0
- Vacancy / Maint / Mgmt
- −$185
- Net cashflow
- $185
Break-even live
UW: 25.0% down · 7.5% · 30yr · 1.5% tax · 5.0% vac · 8.0% maint · 8.0% mgmt
Financing live
Cash to close
- Down payment
- $19,750
- Closing costs
- $2,370
- Reserves months
- —
- Total cash needed
- —
Loan-product check · same deal, 3 products live
Conventional
25% down · 7.5% · 30yr
- Down + closing
- —
- Monthly P&I
- —
- Monthly cashflow
- —
- DSCR
- —
- Eligible?
- —
Personal DTI + credit; lowest rate.
DSCR
20% down · 8.5% · 30yr
- Down + closing
- —
- Monthly P&I
- —
- Monthly cashflow
- —
- DSCR
- —
- Eligible?
- —
No personal income docs; deal must DSCR.
Hard money
10% down · 12.0% · 12mo
- Down + closing
- —
- Monthly P&I
- —
- Monthly cashflow
- —
- DSCR
- —
- Eligible?
- —
Short-term bridge; refi at stabilization.
Rent comps 8 comps
| Address | Beds | Baths | Sqft | Rent | $/sqft | DOM | Units | Dist |
|---|---|---|---|---|---|---|---|---|
| 5665 McClelland Dr Apt 220 Baton Rouge, LA | 3.0 | 1.5 | 870 | $950 | $1.09 | 14d | 1 | 1.18mi |
| 5665 McClelland Dr Apt 201 Baton Rouge, LA | 3.0 | 1.5 | 870 | $1,050 | $1.21 | 44d | 1 | 1.18mi |
| 5665 McClelland Dr Apt 133 Baton Rouge, LA | 2.0 | 1.0 | 775 | $825 | $1.06 | 44d | 1 | 1.18mi |
| 5665 McClelland Dr Unit 245 Baton Rouge, LA | 2.0 | 1.5 | 765 | $800 | $1.05 | 44d | 1 | 1.18mi |
| 5665 McClelland Dr Baton Rouge, LA | 2.0 | 1.0 | 775 | $825 | $1.06 | 23d | 1 | 1.21mi |
| 4189 W Brookstown Dr Baton Rouge, LA | 1.0–2.0 | 1.0 | 695 | $825 | $1.19 | 14d | 20 | 1.44mi |
| 5350 Clayton Dr Baton Rouge, LA | 3.0 | 1.0 | 1050 | $850 | $0.81 | 44d | 1 | 1.47mi |
| 5617 Prescott Rd Baton Rouge, LA | 1.0–2.0 | 1.0 | 687 | $900 | $1.31 | 23d | 26 | 1.47mi |
Listing history 32 events
-
2026-05-07status Pending 521-char remark
Show marketing remark (527 chars)
Whether you’re looking to expand your investment portfolio or purchase your first home, this 3-bedroom brick home offers a solid opportunity. The home sits on a slab foundation and features prior interior updates including flooring throughout, interior paint, windows, panel-raised doors, gas hot water heater, and light fixtures. Property is currently tenant occupied, providing immediate rental income potential for investors, while also offering an affordable option for owner occupants seeking a well-maintained home.
-
2026-05-07status Pending 527-char remark
Show marketing remark (527 chars)
Whether you’re looking to expand your investment portfolio or purchase your first home, this 3-bedroom brick home offers a solid opportunity. The home sits on a slab foundation and features prior interior updates including flooring throughout, interior paint, windows, panel-raised doors, gas hot water heater, and light fixtures. Property is currently tenant occupied, providing immediate rental income potential for investors, while also offering an affordable option for owner occupants seeking a well-maintained home.
-
2026-04-16price $79,000 521-char remark
Show marketing remark (527 chars)
Whether you’re looking to expand your investment portfolio or purchase your first home, this 3-bedroom brick home offers a solid opportunity. The home sits on a slab foundation and features prior interior updates including flooring throughout, interior paint, windows, panel-raised doors, gas hot water heater, and light fixtures. Property is currently tenant occupied, providing immediate rental income potential for investors, while also offering an affordable option for owner occupants seeking a well-maintained home.
-
2026-04-16price $79,000 527-char remark
Show marketing remark (527 chars)
Whether you’re looking to expand your investment portfolio or purchase your first home, this 3-bedroom brick home offers a solid opportunity. The home sits on a slab foundation and features prior interior updates including flooring throughout, interior paint, windows, panel-raised doors, gas hot water heater, and light fixtures. Property is currently tenant occupied, providing immediate rental income potential for investors, while also offering an affordable option for owner occupants seeking a well-maintained home.
-
2026-02-09$85,000 Active 527-char remark
Show marketing remark (521 chars)
Whether you're looking to expand your investment portfolio or purchase your first home, this 3-bedroom brick home offers a solid opportunity. The home sits on a slab foundation and features prior interior updates including flooring throughout, interior paint, windows, panel-raised doors, gas hot water heater, and light fixtures. Property is currently tenant occupied, providing immediate rental income potential for investors, while also offering an affordable option for owner occupants seeking a well-maintained home.
-
2026-02-09$85,000 Active 521-char remark
Show marketing remark (521 chars)
Whether you're looking to expand your investment portfolio or purchase your first home, this 3-bedroom brick home offers a solid opportunity. The home sits on a slab foundation and features prior interior updates including flooring throughout, interior paint, windows, panel-raised doors, gas hot water heater, and light fixtures. Property is currently tenant occupied, providing immediate rental income potential for investors, while also offering an affordable option for owner occupants seeking a well-maintained home.
-
2024-10-02historical
-
2024-07-30$95,000 Active
-
2024-07-30$95,000
-
2018-10-12soldstatus $45,000
-
2018-10-11soldstatus Sold
-
2018-09-24status Pending
-
2018-09-07status Active
-
2018-09-02status Pending
-
2018-08-08$50,000 Active
-
2018-08-08$50,000
-
2012-11-19soldstatus $37,000
-
2012-11-16soldstatus
-
2007-12-04$38,900
-
2007-12-04$38,900
-
2004-03-25soldstatus
-
2004-01-28$39,000
-
2004-01-28$39,000
-
2003-03-31$39,900
-
2003-03-31$39,900
-
2002-10-12soldstatus
-
2001-10-31$38,900
-
2001-10-31$38,900
-
2001-08-02soldstatus
-
2001-07-17$19,900
-
2001-07-17$19,900
-
2000-10-12$33,000
ⓘ Source: listings_history table (triggers on properties + properties_extension) + one-shot
backfill from property_details.listing_events for pre-trigger history.
Tax reassessment forecast LA · Resets to sale price
- Current annual tax
- $748 · $62/mo
- Projected year-2 tax
- $748 · $62/mo
- Expected delta
- $0/yr ($0/mo · 0.0%)
ⓘ Screening estimate from a state-policy table — verify with the county assessor before closing.
Climate risk First Street
- Flood 1/10 Low FEMA zone X (shaded) · 0% chance over 30 yrs
- Wildfire 1/10 Low
- Heat 8/10 Severe 7 d/yr ≥108°F today · 20 d/yr by 30 yrs out
- Wind 9/10 Extreme 99% chance of damaging wind over 30 yrs
- Air quality 3/10 Moderate 3 unhealthy d/yr today · 4 by 30 yrs out
Nearby sold comps map
Loading sold comps map…
Walkable amenities ~0.75 mi
Loading nearby amenities…
Taxation est. · year 1
- Rental income
- $10,551
- − Mortgage interest
- −$4,425
- − Property taxes
- −$748
- − Insurance
- −$395
- − Repairs & maintenance
- −$844
- − Management
- −$844
- − Depreciation
- −$2,298
- Taxable income
- $996
- Est. tax owed @ 24.0%
- −$239
- After-tax cash flow
- $1,981/yr
For passive investors: Depreciation is non-cash, so a rental often shows a tax loss while cash-flowing — sheltering income. Rental losses are passive: they offset passive income freely, and up to $25,000/yr can offset ordinary (W-2) income if you actively participate and your MAGI is under $100k (phasing out to $0 by $150k); unused losses carry forward. On sale, claimed depreciation is recaptured at up to 25%, and gains may owe capital-gains tax (a 1031 exchange can defer both). Figures are a year-1 estimate at your 24.0% rate — not tax advice; consult a CPA.
Schools (NCES district)
- District
- East Baton Rouge Parish
- NCES district ID
- 2200540
- Math proficiency
- 22% ▼ -36.00%
- Reading proficiency
- 34% ▼ -31.00%
- Median HH income
- $46,263
- Composite
- 24.14/100
- National rank
- #7745
- State rank
- #47 of 98 in LA
Livability — Merrydale
- Score
- 58/100
- State rank
- #301
- US rank
- #21115
Category grades
Schools grade is shown separately in the Schools card above.
Census & demographics
- Census place
- Merrydale, LA
- City population
- 11,124
- Population (ZIP)
- 11,124
Population outlook (East Baton Rouge County) Hauer SSP2
- Today (2025)
- 464,810 people
- By 2030
- 472,137 · +1.6%
- By 2040
- 480,243 · +3.3%
- By 2050
- 484,422 · +4.2%
- By 2075
- 492,069 · +5.9%
- By 2100
- 476,347 · +2.5%
Race, ethnicity, and origin ACS 2023
- Neighborhood character
- Predominantly Black (97%)
- Race & ethnicity
- Black 97% Hispanic / Latino 2% White 1%
- Foreign-born
- 1% · Canada
- Languages at home
- 99% English-only · Spanish 1%
Political lean MEDSL · East Baton Rouge
- 2024 margin
- D (+11.1) · D 54.5% · R 43.4% · Other 2.1%
- 2008→2024 swing
- +8.9pp toward D · 2008: 2.2pp · 2024: 11.1pp
- All cycles
- 2024: D+11.1 2020: D+13.1 2016: D+9.2 2012: D+5.2 2008: D+2.2
Not yet ingested
- Civics
- —
Market trends
- HPI YoY
- ▲ 5.93%
- Current HPI
- 174.6882
- Rent YoY
- —
- Metro
- —
- State GDP YoY
- ▲ 3.29%
- F500 in state
- 10
Industry mix (Fortune 500 HQ in LA)
| Industry | F500 HQs | Revenue |
|---|---|---|
| Telecommunications | 2 | $23B |
|
||
| Utilities | 1 | $12B |
|
||
| Wholesale / Distribution | 1 | $5B |
|
||
| Advertising | 1 | $2B |
|
||
Price history
+139.4% since first listed32 events — show timeline
- 2026-05-07 Pending — AcadianaMLS
- 2026-05-07 Pending — GBRMLS
- 2026-04-16 Price Changed $79,000 AcadianaMLS
- 2026-04-16 Price Changed $79,000 GBRMLS
- 2026-02-09 Listed $85,000 GBRMLS
- 2026-02-09 Listed $85,000 AcadianaMLS
- 2024-10-02 Delisted — GBRMLS
- 2024-07-30 Listed $95,000 AcadianaMLS
- 2024-07-30 Listed $95,000 GBRMLS
- 2018-10-12 Sold (Public Records) $45,000 Public Records
- 2018-10-11 Sold (MLS) — GBRMLS
- 2018-09-24 Pending — GBRMLS
- 2018-09-07 Relisted — GBRMLS
- 2018-09-02 Pending — GBRMLS
- 2018-08-08 Listed $50,000 AcadianaMLS
- 2018-08-08 Listed $50,000 GBRMLS
- 2012-11-19 Sold (Public Records) $37,000 Public Records
- 2012-11-16 Sold (MLS) — GBRMLS
- 2007-12-04 Listed $38,900 AcadianaMLS
- 2007-12-04 Listed $38,900 GBRMLS
- 2004-03-25 Sold (MLS) — GBRMLS
- 2004-01-28 Listed $39,000 GBRMLS
- 2004-01-28 Listed $39,000 AcadianaMLS
- 2003-03-31 Listed $39,900 AcadianaMLS
- 2003-03-31 Listed $39,900 GBRMLS
- 2002-10-12 Sold (MLS) — GBRMLS
- 2001-10-31 Listed $38,900 AcadianaMLS
- 2001-10-31 Listed $38,900 GBRMLS
- 2001-08-02 Sold (MLS) — GBRMLS
- 2001-07-17 Listed $19,900 AcadianaMLS
- 2001-07-17 Listed $19,900 GBRMLS
- 2000-10-12 Listed $33,000 AcadianaMLS
Property tax history
+2.9%/yrLatest (2025): $748 · -0.4% YoY. Source: county tax records.
Cash-flow waterfall
monthlySold comps — $/sqft
last 12 mo · ≤1 miLoading sold comps…