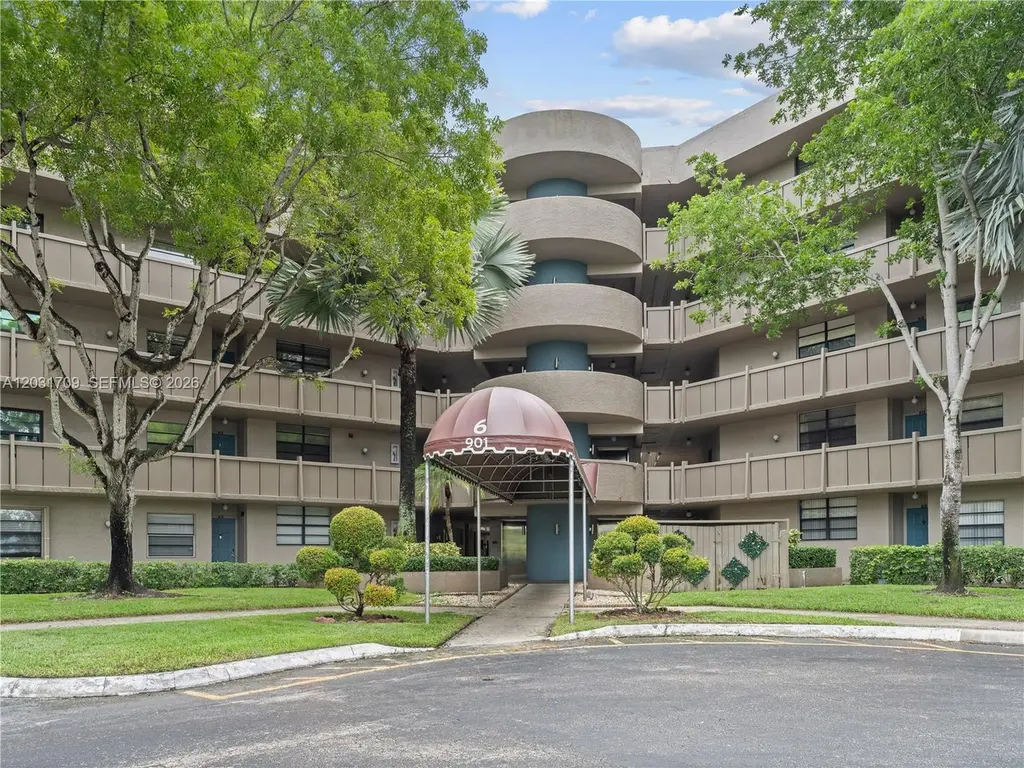
901 Colony Point Cir #112 · Pembroke Pines, FL
Flood risk 1/10 · Minimal
- FEMA flood zone
- X (shaded)
- Chance of flooding over 30 yrs
- 0.0%
- Est. flood insurance / yr
- $507 – $1,088
Fire risk 1/10 · Minimal
- Est. fire insurance / yr
- $947 – $1,759
Heat risk 9/10 · Severe
- Hot days now (above 105°F)
- 7 days/yr
- Hot days in 30 yrs
- 27 days/yr
Wind risk 10/10 · Severe
- Chance of severe wind over 30 yrs
- 99.0%
Air-quality risk 2/10 · Minimal
- Unhealthy air days now
- 2 days/yr
- Unhealthy air days in 30 yrs
- 2 days/yr
Risk factors via First Street. Map © Google.
Why this score? — see what drove the C- grade
The composite is a weighted blend of 9 inputs, each scored 0–100. Each bar is that input's sub-score; the figure is the points it added to the 100-point composite (weight × sub-score).
- Cash flow +17.1/30.0
- 1% rule +10.0/10.0
- ARV discount +7.5/15.0
- DSCR +5.3/10.0
- Livability +4.2/5.0
- Schools +4.1/10.0
- Rent growth +2.9/5.0
- Condition / age +2.5/5.0
- Appreciation +0.0/10.0
$179,999
🖨 Deal sheet (PDF) 📄 Offer letter ✓ Due diligence
Listing remarks MLS
SOUGHT AFTER 1ST FLOOR LAKE VIEW HOME IS BRIGHT & FEATURES TITLE THROUGHOUT, NEW AC 2015, WASHER/DRYER IN UNIT, LARGE MASTER BEDROOM W WALK-IN CLOSET & HURRICANE IMPACT WINDOW, SCREENED IN PATIO W AMAZING VIEWS. ADULT COMMUNITY W RESORT STYLE LIVING & MANY AMENITIES SUCH AS CLUB HOUSE, POOL, JACUZZI, SAUNA, GYM, BUS SERVICE, JOG PATH, MOVIES, RACQUET BALL, TENNIS, CRAFT, CARD & CHESS ROOM, BILLIARDS, BINGO, MOVIES, LIBRARY IN PRIME LOCATION NEAR FREEWAYS, MEMORIAL HOSPITAL, MALL, SHOPPING & RESTAURANTS. NO LEASING, NO PETS, NO PICK UP TRUCKS. 20% DOWN PAYMENT REQUIRED BY ASSOCIATION.
Key facts
- Fitness center
- Clubhouse
- Lake views
Tags
Property features AI
Finance
- Financial info: Pets not allowed
- HOA & community: Monthly association fee; Association fee covers amenities, common areas, cable TV, legal/accounting, grounds maintenance, structure maintenance, parking, pool(s), recreation facilities, roof, sewer, security, and water; Association amenities include pool, tennis courts, and trails; Senior community
Exterior
- Parking: Assigned parking; Guest parking; One parking space
- Security: Complex fence; Security guard; Smoke detectors
- Utilities: Cable available
- Home design: Attached property; 5 total stories; First-floor entry
- Construction: Block construction; Resale property
- Exterior features: Enclosed porch; Storm/security shutters; Porch; Screened porch; Association pool; Lakefront; Has a view; Complex fenced; Security guard; Smoke detector(s)
Interior
- Kitchen: Electric range; Disposal; Icemaker; Microwave; Refrigerator
- Bedrooms: Primary bedroom on the main level
- Flooring: Tile
- Bathrooms: 2 full bathrooms
- Heating & cooling: Central heating; Central air conditioning
- Interior features: Built-in features; Bedroom on main level; First floor entry; Main level primary; Walk-in closet(s)
- Laundry & utility: Washer; Dryer; Electric water heater
Neighborhood map
What this means for you Summary
Snapshot
- This is a 2-bed/2.0-bath condo listed at $180k.
Deal economics
- At list price, monthly cash flow is $124 ($1k/yr) — positive.
- The deal already cash-flows at list — no discount required.
- Meets the 1% rule at list price ($3k rent vs $180k).
- Recommended offer: $177k (1.5% below list) — sets the bar for market timing.
- Cap rate 7.1% vs local median 4.0% in Pembroke Pines — top-decile yield for the area; either an underpriced asset or a hidden risk that comps aren't pricing in. Stress-test before assuming the spread holds.
Location & tenants
- Location reads 83/100 on livability (#54 in FL, #933 nationally) — a professional / high-income tenant draw. Strengths: housing A+, health & safety A+, schools A-; Watch: amenities D+, cost of living D+.
- Broward (suburban): math 42% / reading 53% proficiency, ranked #46 of 73 in FL (top 63%) — families likely to look elsewhere, expect single-tenant / working-renter base with shorter leases.
- Market conditions: Rents rising (+1.6%/yr); 227 active listings in the ZIP; 40 comparable units currently listed for rent nearby; rentals at typical pace (median 21d on market — plan ~3-4 weeks tenant-placement turnaround); solid renter incomes; 2,111 units permitted in Broward County in 2024 (1,265 in 5+ unit buildings).
- This rent runs 36% of the median local income ($89k/yr) — at the standard rent-burdened threshold; future hikes will face affordability resistance.
Forward outlook
- Local home prices are declining (-3.0%/yr); year-one equity from $1k of loan paydown is wiped out by about $5k of value loss. Plan a longer hold.
- Broward County population projected at +34% by 2050 — long-run rental-demand tailwind backs the buy-and-hold thesis.
Negotiation context
- It's been on market 15 days — a 2% lower offer ($177k) is reasonable based on typical stale-listing flexibility.
- 2 sale attempts since 9y ago with the ask held roughly flat each time — persistent listings suggest the price (not the market) is what's stuck; bring a comps-based counter.
- Current owner paid $138k; 30% above their basis — modest negotiation headroom, anchor on the comps not their cost.
Risks & watch-outs
- Watch-outs: HOA is 34% of rent.
- Climate carrying-cost: severe wind risk, 99% chance of damaging wind over 30y; extreme-heat days projected 7→27/yr by 2055 (HVAC capex compounding) — expect insurance premiums to compound above CPI over the hold.
Questions for the listing agent
- What does the HOA fee cover, when was the last increase, and are there any pending special assessments or reserve-fund shortfalls?
- Any open or pending special assessments — roof, HVAC, plumbing, elevator, façade? What's the per-unit balance and payoff schedule, and is the seller paying it off at close or rolling it to the buyer?
- Is there a deadline driving the sale (1031 exchange, divorce, estate, relocation)? That informs how much negotiation room exists.
- Schools are A-rated — typically a magnet for longer-tenancy family renters. What's the average tenant stay here, and is there a school-zone premium baked into asking?
- What's the average days-on-market for RENTAL listings here right now (not sales)? A rising rental-DOM trend means longer vacancies and softer asking-rent achievability than the comps imply.
- What's the recent tenant-quality profile in this submarket — average credit score on applications, eviction rate, late-payment / NSF rate, and stable-employment percentage? A property-management company in the area should have these aggregated.
- How much new apartment / multifamily construction is in the pipeline within 1–3 miles? Heavy new supply (>2% of stock underway) typically softens rents 12–24 months out; light construction supports rent growth.
Investment metrics
- 1% rule
- 1.50% ✓
- Cap rate
- 7.12%
- Cash-on-cash
- 2.96%
- DSCR
- 1.13
- GRM
- 5.5
CMA / ARV
No comps found within radius.
Projected returns pro-forma
-3.0% appreciation · 1.58% rent growth · sell at horizon
- IRR
- -13.8%
- Equity multiple
- 0.51×
- Total profit
- $-24,560
- Equity at exit
- $26,838
- IRR
- -8.5%
- Equity multiple
- 0.52×
- Total profit
- $-24,330
- Equity at exit
- $15,563
Cash invested: $50,400 (down + closing). Projections, not guarantees.
Landlord ↔ Tenant lean methodology
- Overall (STATE)
- 87 Strongly Landlord-Friendly
- State Florida
- 87 Strongly Landlord-Friendly · R+3
- County
- — inherits STATE
- City
- — inherits STATE
ZIP-level market 33026
- Rents YoY
- 1.6%
- Active inventory
- 227
- Price-to-rent
- 5.5×
Monthly cashflow live
- Estimated rent
- $2,709 high interval (Pro) →
- Mortgage (P&I)
- −$944
- Tax from tax record
- −$87 /mo · $1,041/yr
- Insurance
- −$75
- HOA
- −$910
- Vacancy / Maint / Mgmt
- −$569
- Net cashflow
- $124
Break-even live
Sensitivity live
| Price | -10% $226 | -5% $175 | +0% $124 | +5% $73 | +10% $22 |
|---|---|---|---|---|---|
| Rent | -10% $-90 | -5% $17 | +0% $124 | +5% $231 | +10% $338 |
| Rate | -1.0pp $215 | -0.5pp $170 | base $124 | +0.5pp $78 | +1.0pp $30 |
UW: 25.0% down · 7.5% · 30yr · 1.5% tax · 5.0% vac · 8.0% maint · 8.0% mgmt
Financing live
Cash to close
- Down payment
- $45,000
- Closing costs
- $5,400
- Reserves months
- —
- Total cash needed
- —
Loan-product check · same deal, 3 products live
Conventional
25% down · 7.5% · 30yr
- Down + closing
- —
- Monthly P&I
- —
- Monthly cashflow
- —
- DSCR
- —
- Eligible?
- —
Personal DTI + credit; lowest rate.
DSCR
20% down · 8.5% · 30yr
- Down + closing
- —
- Monthly P&I
- —
- Monthly cashflow
- —
- DSCR
- —
- Eligible?
- —
No personal income docs; deal must DSCR.
Hard money
10% down · 12.0% · 12mo
- Down + closing
- —
- Monthly P&I
- —
- Monthly cashflow
- —
- DSCR
- —
- Eligible?
- —
Short-term bridge; refi at stabilization.
Rent comps 40 comps
| Address | Beds | Baths | Sqft | Rent | $/sqft | DOM | Units | Dist |
|---|---|---|---|---|---|---|---|---|
| 1111 N Hiatus Rd Pembroke Pines, FL | 3.0 | 2.5 | 1319 | $2,300 | $1.74 | 25d | 1 | 0.21mi |
| 10951 N Lakeview Dr Pembroke Pines, FL | 2.0 | 2.0 | 1318 | $3,000 | $2.28 | 25d | 1 | 0.29mi |
| 11313 NW 15th St Pembroke Pines, FL | 2.0 | 2.0 | 1318 | $3,399 | $2.58 | 18d | 1 | 0.29mi |
| 1424 NW 113th Way Pembroke Pines, FL | 2.0 | 1.5 | 1482 | $3,000 | $2.02 | 25d | 1 | 0.29mi |
| 11705 NW 12th St Pembroke Pines, FL | 3.0 | 2.5 | 1494 | $3,600 | $2.41 | 25d | 1 | 0.34mi |
| 11804 NW 13th St Unit 11804 Pembroke Pines, FL | 3.0 | 2.0 | 1304 | $3,500 | $2.68 | 3d | 1 | 0.35mi |
| 1411 W Fairway Rd Pembroke Pines, FL | 3.0 | 2.0 | 1323 | $3,000 | $2.27 | 13d | 1 | 0.37mi |
| 11838 NW 13th St Pembroke Pines, FL | 3.0 | 2.0 | 1304 | $3,650 | $2.80 | 6d | 1 | 0.43mi |
| 11761 NW 12th St Pembroke Pines, FL | 3.0 | 2.0 | 1304 | $3,799 | $2.91 | 25d | 1 | 0.44mi |
| 11905 NW 11th St #11905 Pembroke Pines, FL | 2.0 | 2.0 | 900 | $2,500 | $2.78 | 25d | 1 | 0.45mi |
| 11931 NW 11th St #11931 Pembroke Pines, FL | 2.0 | 2.0 | 900 | $2,400 | $2.67 | 6d | 1 | 0.45mi |
| 10723 NW 10th St Pembroke Pines, FL | 3.0 | 2.5 | 1399 | $3,100 | $2.22 | 25d | 1 | 0.49mi |
| 11992 NW 11th St #11992 Pembroke Pines, FL | 2.0 | 2.0 | 900 | $2,400 | $2.67 | 8d | 1 | 0.51mi |
| 11202 Taft St #11202 Pembroke Pines, FL | 2.0 | 2.0 | 1205 | $2,300 | $1.91 | 25d | 1 | 0.51mi |
| 11969 NW 11th St #11969 Pembroke Pines, FL | 2.0 | 2.0 | 970 | $2,400 | $2.47 | 25d | 1 | 0.52mi |
| 11969 NW 11th St #11969 Pembroke Pines, FL | 2.0 | 2.0 | 970 | $2,400 | $2.47 | 4d | 1 | 0.52mi |
| 1014 NW 107th Ave Pembroke Pines, FL | 2.0 | 1.5 | 1044 | $2,600 | $2.49 | 25d | 1 | 0.52mi |
| 12060 NW 11th St #12060 Pembroke Pines, FL | 2.0 | 2.0 | 970 | $2,350 | $2.42 | 8d | 1 | 0.56mi |
| 120 NW 108th Ter Pembroke Pines, FL | 1.0–3.0 | 1.0–2.0 | 1101 | $2,534 | $2.30 | 4d | 10 | 0.59mi |
| 101 SW 117th Ave #7101 Pembroke Pines, FL | 2.0 | 2.0 | 1130 | $2,200 | $1.95 | 3d | 1 | 0.62mi |
| 131 SW 117th Ave #8304 Pembroke Pines, FL | 1.0 | 1.0 | 810 | $1,800 | $2.22 | 18d | 1 | 0.65mi |
| 131 SW 117th Ave #8307 Pembroke Pines, FL | 2.0 | 2.0 | 1130 | $2,380 | $2.11 | 25d | 1 | 0.65mi |
| 131 SW 117th Ave #8101 Pembroke Pines, FL | 2.0 | 2.0 | 1130 | $2,350 | $2.08 | 21d | 1 | 0.65mi |
| 730 NW 106th Ter #730 Pembroke Pines, FL | 2.0 | 2.5 | 1224 | $2,500 | $2.04 | 25d | 1 | 0.65mi |
| 1072 NW 106th Ter #205 Pembroke Pines, FL | 2.0 | 2.0 | 806 | $2,100 | $2.61 | 18d | 1 | 0.65mi |
| 971 NW 122nd Ter Pembroke Pines, FL | 2.0 | 2.0 | 1368 | $2,800 | $2.05 | 8d | 1 | 0.66mi |
| 1061 NW 122nd Ter Pembroke Pines, FL | 2.0 | 2.0 | 1368 | $2,500 | $1.83 | 25d | 1 | 0.66mi |
| 11361 SW 3rd St #11361 Pembroke Pines, FL | 2.0 | 2.0 | 978 | $2,450 | $2.51 | 15d | 1 | 0.67mi |
| 11700 SW 1st St #3207 Pembroke Pines, FL | 3.0 | 2.0 | 1330 | $3,000 | $2.26 | 19d | 1 | 0.67mi |
| 151 SW 117th Ave #9308 Pembroke Pines, FL | 2.0 | 2.0 | 1130 | $2,650 | $2.35 | 25d | 1 | 0.68mi |
| 11601 SW 2nd St #21108 Pembroke Pines, FL | 2.0 | 2.0 | 1130 | $2,400 | $2.12 | 25d | 1 | 0.68mi |
| 730 NW 106th Ave #730 Pembroke Pines, FL | 2.0 | 2.5 | 1224 | $2,550 | $2.08 | 25d | 1 | 0.68mi |
| 140 SW 117th Ave Pembroke Pines, FL | 1.0 | 1.0 | 810 | $2,100 | $2.59 | 19d | 1 | 0.68mi |
| 140 SW 117th Ave #4301 Pembroke Pines, FL | 2.0 | 2.0 | 1130 | $2,400 | $2.12 | 13d | 1 | 0.68mi |
| 10609 NW 8th St Pembroke Pines, FL | 2.0 | 2.5 | 1224 | $2,700 | $2.21 | 15d | 1 | 0.69mi |
| 12266 NW 10th St Pembroke Pines, FL | 3.0 | 2.0 | 1432 | $2,999 | $2.09 | 25d | 1 | 0.69mi |
| 11631 SW 2nd St #20302 Pembroke Pines, FL | 2.0 | 2.0 | 1130 | $2,375 | $2.10 | 18d | 1 | 0.69mi |
| 11631 SW 2nd St #20103 Pembroke Pines, FL | 1.0 | 1.0 | 810 | $1,950 | $2.41 | 25d | 1 | 0.69mi |
| 11631 SW 2nd St #20302 Pembroke Pines, FL | 2.0 | 2.0 | 1130 | $2,300 | $2.04 | 6d | 1 | 0.69mi |
| 201 SW 116th Ave Unit 108 Pembroke Pines, FL | 3.0 | 2.0 | 1330 | $2,900 | $2.18 | 25d | 1 | 0.69mi |
HOA detail condo
- Monthly dues
- $910 · $10,920/yr
- Likely covers
- poolgym
- Assessments
- None detected in remarks — confirm with the listing agent.
Listing history 10 events
-
2026-06-21days on market $179,999 Active 15 DOM
-
2026-06-18days on market $179,999 Active 12 DOM
-
2026-06-17days on market $179,999 Active 11 DOM
-
2026-06-16days on market $179,999 Active 10 DOM
-
2026-06-15days on market $179,999 Active 9 DOM
-
2026-06-13days on market $179,999 Active 7 DOM
-
2026-06-09days on market $179,999 Active 3 DOM
-
2026-06-08days on market $179,999 Active 2 DOM
-
2026-06-07remarks 422-char remark
-
2026-06-07$179,999 Active 1 DOM
ⓘ Source: listings_history table (triggers on properties + properties_extension) + one-shot
backfill from property_details.listing_events for pre-trigger history.
Tax reassessment forecast FL · Resets to sale price
- Current annual tax
- $1,041 · $87/mo
- Projected year-2 tax
- $1,494 · $124/mo
- Expected delta
- +$453/yr (+$38/mo · 43.5%)
ⓘ Screening estimate from a state-policy table — verify with the county assessor before closing.
Climate risk First Street
- Flood 1/10 Low FEMA zone X (shaded) · 0% chance over 30 yrs
- Wildfire 1/10 Low
- Heat 9/10 Extreme 7 d/yr ≥105°F today · 27 d/yr by 30 yrs out
- Wind 10/10 Extreme 99% chance of damaging wind over 30 yrs
- Air quality 2/10 Low 2 unhealthy d/yr today · 2 by 30 yrs out
Nearby sold comps map
Loading sold comps map…
Walkable amenities ~0.75 mi
Loading nearby amenities…
Taxation est. · year 1
- Rental income
- $32,505
- − Mortgage interest
- −$10,083
- − Property taxes
- −$1,041
- − Insurance
- −$900
- − Repairs & maintenance
- −$2,600
- − Management
- −$2,600
- − HOA
- −$10,920
- − Depreciation
- −$5,236
- Taxable loss
- −$877
- Est. tax savings @ 24.0%
- +$210
- After-tax cash flow
- $1,700/yr
For passive investors: Depreciation is non-cash, so a rental often shows a tax loss while cash-flowing — sheltering income. Rental losses are passive: they offset passive income freely, and up to $25,000/yr can offset ordinary (W-2) income if you actively participate and your MAGI is under $100k (phasing out to $0 by $150k); unused losses carry forward. On sale, claimed depreciation is recaptured at up to 25%, and gains may owe capital-gains tax (a 1031 exchange can defer both). Figures are a year-1 estimate at your 24.0% rate — not tax advice; consult a CPA.
Schools (NCES district)
- District
- Broward
- NCES district ID
- 1200180
- Math proficiency
- 42% ▼ -18.00%
- Reading proficiency
- 53% ▼ -5.00%
- Median HH income
- $52,139
- Composite
- 40.88/100
- National rank
- #3621
- State rank
- #46 of 73 in FL
Livability — Pembroke Pines
- Score
- 83/100
- State rank
- #54
- US rank
- #933
Category grades
Schools grade is shown separately in the Schools card above.
Census & demographics
- Census place
- Pembroke Pines, FL
- County
- Broward County · 1,963,430 people
- City population
- 180,224
- Metro
- Miami-Fort Lauderdale-Pompano Beach, FL
- Population (ZIP)
- 31,172
- Household income
- $89,306
- Rent vs Own
- Severe rent burden
- 517.0
Population outlook (Broward County) Hauer SSP2
- Today (2025)
- 2,207,033 people
- By 2030
- 2,360,704 · +7.0%
- By 2040
- 2,661,208 · +20.6%
- By 2050
- 2,946,698 · +33.5%
- By 2075
- 3,602,273 · +63.2%
- By 2100
- 3,970,984 · +79.9%
Race, ethnicity, and origin ACS 2023
- Neighborhood character
- Diverse neighborhood (Simpson 0.69)
- Race & ethnicity
- Hispanic / Latino 41% White 35% Two or more races 23% Black 15% Asian 4%
- Hispanic origin (detail)
- Puerto Rican 5% Cuban 13% Dominican 2%
- Common ancestry
- Hispanic 5% Romanian 3% Scotch-Irish 2%
- Foreign-born
- 35% · Canada, Jamaica, China
- Languages at home
- 52% English-only · Spanish 35% French/Haitian/Cajun 5% Other Indo-European 4%
Political lean MEDSL · Broward
- 2024 margin
- D (+17.0) · D 58.0% · R 41.0%
- 2008→2024 swing
- -17.8pp toward R · 2008: 34.7pp · 2024: 17.0pp
- All cycles
- 2024: D+17.0 2020: D+29.8 2016: D+35.0 2012: D+34.9 2008: D+34.7
Not yet ingested
- Civics
- —
Market trends
- HPI YoY
- ▼ -248.72%
- Current HPI
- 380.7596
- Rent YoY
- ▲ 1.58%
- Metro
- Miami-Fort Lauderdale-Pompano Beach, FL
- State GDP YoY
- ▲ 3.28%
- F500 in state
- 36
Industry mix (Fortune 500 HQ in FL)
| Industry | F500 HQs | Revenue |
|---|---|---|
| Industrial Technology | 2 | $29B |
|
||
| Insurance | 2 | $17B |
|
||
| Retail | 1 | $60B |
|
||
| Technology Distribution | 1 | $58B |
|
||
| Homebuilding | 1 | $35B |
|
||
| Technology Manufacturing | 1 | $35B |
|
||
Price history
+462.5% since first listed10 events — show timeline
- 2026-06-06 Listed $179,999 MARMLS
- 2017-07-24 Sold (Public Records) $138,000 Public Records
- 2017-07-23 Sold (MLS) $138,000 MARMLS
- 2017-06-06 Pending — MARMLS
- 2017-05-31 Listed $134,800 MARMLS
- 2012-09-11 Sold (MLS) $89,000 MARMLS
- 2012-08-29 Sold (Public Records) $89,000 Public Records
- 2004-10-06 Sold (Public Records) $140,000 Public Records
- 1993-12-22 Sold (Public Records) $32,000 Public Records
- 1993-12-22 Sold (Public Records) $32,000 Public Records
Property tax history
+3.2%/yrLatest (2025): $1,041 · +4.9% YoY. Source: county tax records.
Cash-flow waterfall
monthlySold comps — $/sqft
last 12 mo · ≤1 miLoading sold comps…