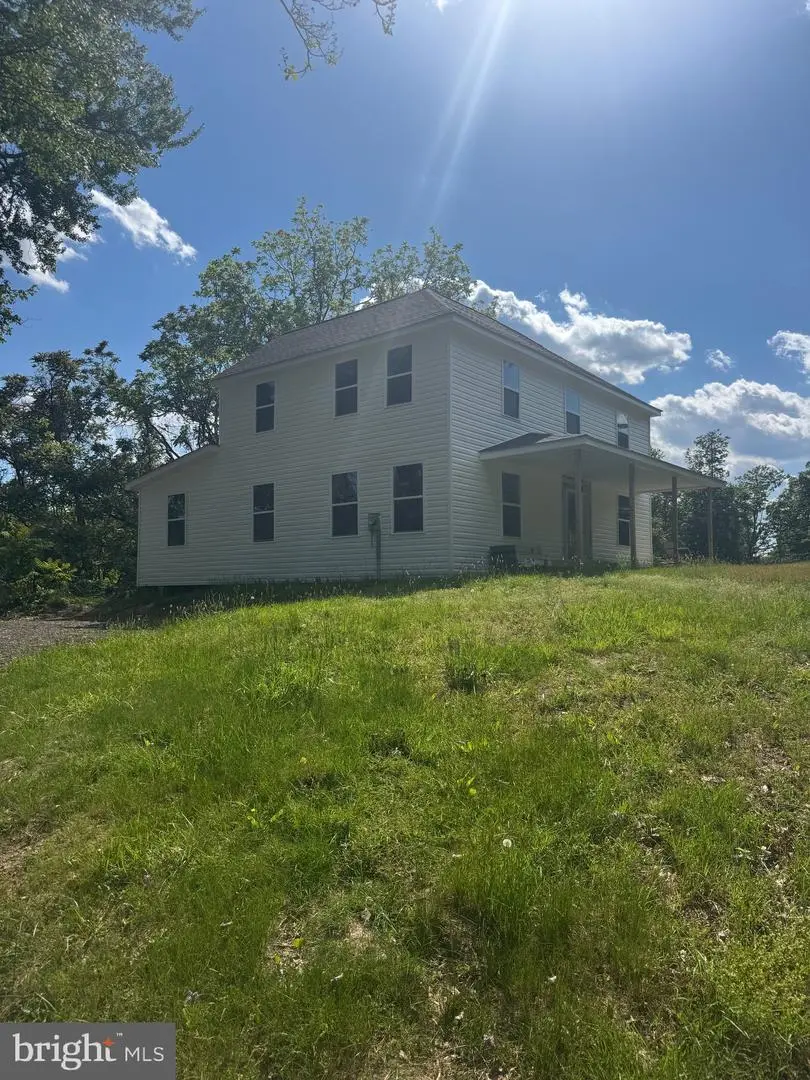
1650 Skinners Turn Rd · Owings, MD
Flood risk 1/10 · Minimal
- FEMA flood zone
- X (unshaded)
- Chance of flooding over 30 yrs
- 0.0%
- Est. flood insurance / yr
- $473 – $860
Fire risk 4/10 · Minor
- Est. fire insurance / yr
- $755 – $1,403
Heat risk 8/10 · Major
- Hot days now (above 103°F)
- 7 days/yr
- Hot days in 30 yrs
- 16 days/yr
Wind risk 6/10 · Moderate
- Chance of severe wind over 30 yrs
- 40.0%
Air-quality risk 2/10 · Minimal
- Unhealthy air days now
- 1 days/yr
- Unhealthy air days in 30 yrs
- 2 days/yr
Risk factors via First Street. Map © Google.
Why this score? — see what drove the C grade
The composite is a weighted blend of 9 inputs, each scored 0–100. Each bar is that input's sub-score; the figure is the points it added to the 100-point composite (weight × sub-score).
- Cash flow +18.5/30.0
- ARV discount +15.0/15.0
- DSCR +5.8/10.0
- 1% rule +4.4/10.0
- Livability +3.6/5.0
- Schools +3.3/10.0
- Rent growth +2.5/5.0
- Condition / age +2.5/5.0
- Appreciation +0.0/10.0
$275,000
🖨 Deal sheet 📄 Offer letter ✓ Due diligence
Listing remarks MLS
This house needs major renovations or tear down and build your dream house in Northern Calvert County. A usable one acre lot and a large footprint for the house , with two out buildings. This property is sold "as is" .
Key facts
- 1 acre lot
- Built 1920
- Listed 34 days
Property features AI
Finance
- Other: Ownership is fee simple; Below-grade unfinished area reported (679); Above-grade finished area reported (1,493); Property condition described as below average
Exterior
- Parking: Circular driveway; Driveway parking; Garage(s) present
- Utilities: Private well water; No septic system; Electric hot water; Propane (leased) for heating
- Home design: Detached structure; Two levels
- Construction: Aluminum siding; Metal roof; Block foundation; Built year reported by assessor
- Exterior features: Outbuilding(s) on the property; Property backs to trees; Not in a federal flood zone
Interior
- Bedrooms: Three bedrooms on the main level
- Bathrooms: One full bathroom (main level)
- Heating & cooling: Radiator heat; Propane (leased) fuel for heating; Electric hot water
- Interior features: No basement; Living area reported from assessor
Neighborhood map
What this means for you Summary
Snapshot
- This is a 3-bed/1.0-bath single-family listed at $275k.
Deal economics
- At list price, monthly cash flow is $261 ($3k/yr) — positive.
- The deal already cash-flows at list — no discount required.
- To meet the 1% rule (rent ≥ 1% of price), the offer needs to be $258k (6.3% below list).
- Recommended offer: $258k (6.3% below list) — sets the bar for 1% rule.
- Cap rate 7.4% vs local median 2.3% in Owings — top-decile yield for the area; either an underpriced asset or a hidden risk that comps aren't pricing in. Stress-test before assuming the spread holds.
Location & tenants
- Location reads 72/100 on livability (#139 in MD) — a middle-class / working-renter tenant base. Strengths: crime A+, employment A+, housing A+; Watch: amenities F, cost of living F, health & safety F.
- Calvert County Public Schools (rural): math 23% / reading 44% proficiency, ranked #5 of 24 in MD (top 21%) — families likely to look elsewhere, expect single-tenant / working-renter base with shorter leases; only 19% free/reduced lunch — higher-income household profile.
- Market conditions: 44 active listings in the ZIP; 101 units permitted in Calvert County in 2024 (0 in 5+ unit buildings).
Forward outlook
- Local home prices are declining (-3.0%/yr); year-one equity from $2k of loan paydown is wiped out by about $8k of value loss. Plan a longer hold.
Negotiation context
- It's been on market 34 days — a 3% lower offer ($267k) is reasonable based on typical stale-listing flexibility.
- 3 sale attempts since 2y ago; this cycle's ask has dropped $25k (8%) from the opening price — seller is motivated, your offer sets the floor, not the list.
- Current owner paid $160k; list at $275k implies a 72% gain — meaningful room to come down on a strong offer.
Risks & watch-outs
- Watch-outs: built in 1920 — expect roof / HVAC / electrical / plumbing capex.
- Climate carrying-cost: major wind risk, 40% chance of damaging wind over 30y; extreme-heat days projected 7→16/yr by 2055 (HVAC capex compounding) — expect insurance premiums to compound above CPI over the hold.
Questions for the listing agent
- It's been on market 34 days. Have you received any prior offers? Is the seller open to a 6% concession, seller financing, or rate buy-down credit?
- Built in 1920 — when were the roof, HVAC, electrical panel, plumbing, and water heater last replaced?
- Is there a deadline driving the sale (1031 exchange, divorce, estate, relocation)? That informs how much negotiation room exists.
- Schools are B-rated — typically a magnet for longer-tenancy family renters. What's the average tenant stay here, and is there a school-zone premium baked into asking?
- What's the average days-on-market for RENTAL listings here right now (not sales)? A rising rental-DOM trend means longer vacancies and softer asking-rent achievability than the comps imply.
- What's the recent tenant-quality profile in this submarket — average credit score on applications, eviction rate, late-payment / NSF rate, and stable-employment percentage? A property-management company in the area should have these aggregated.
- How much new for-sale + rental construction is in the pipeline within 1–3 miles? Heavy new supply typically softens prices + rents 12–24 months out; constrained supply supports both.
Investment metrics
- 1% rule
- 0.94% ✗
- Cap rate
- 7.43%
- Cash-on-cash
- 4.07%
- DSCR
- 1.18
- GRM
- 8.9
CMA / ARV
- ARV (median comp)
- $459,465
- List price
- $275,000
- Delta
- -40.15%
- Verdict
- UNDERPRICED
- Comps
- 3 within 1.0 mi
Projected returns pro-forma
-3.0% appreciation · 3.0% rent growth · sell at horizon
- IRR
- -9.9%
- Equity multiple
- 0.64×
- Total profit
- $-27,951
- Equity at exit
- $41,003
- IRR
- -0.6%
- Equity multiple
- 0.96×
- Total profit
- $-3,058
- Equity at exit
- $23,777
Cash invested: $77,000 (down + closing). Projections, not guarantees.
Landlord ↔ Tenant lean methodology
- Overall (STATE)
- 27 Tenant-Leaning
- State Maryland
- 27 Tenant-Leaning · D+14
- County
- — inherits STATE
- City
- — inherits STATE
ZIP-level market 20736
- Home prices YoY
- -22.7%
- Active inventory
- 44
- Price-to-rent
- 8.9×
Monthly cashflow live
- Estimated rent
- $2,577 medium interval (Pro) →
- Mortgage (P&I)
- −$1,442
- Tax from tax record
- −$217 /mo · $2,610/yr
- Insurance
- −$115
- HOA
- −$0
- Vacancy / Maint / Mgmt
- −$541
- Net cashflow
- $261
Break-even live
UW: 25.0% down · 7.5% · 30yr · 1.5% tax · 5.0% vac · 8.0% maint · 8.0% mgmt
Financing live
Cash to close
- Down payment
- $68,750
- Closing costs
- $8,250
- Reserves months
- —
- Total cash needed
- —
Loan-product check · same deal, 3 products live
Conventional
25% down · 7.5% · 30yr
- Down + closing
- —
- Monthly P&I
- —
- Monthly cashflow
- —
- DSCR
- —
- Eligible?
- —
Personal DTI + credit; lowest rate.
DSCR
20% down · 8.5% · 30yr
- Down + closing
- —
- Monthly P&I
- —
- Monthly cashflow
- —
- DSCR
- —
- Eligible?
- —
No personal income docs; deal must DSCR.
Hard money
10% down · 12.0% · 12mo
- Down + closing
- —
- Monthly P&I
- —
- Monthly cashflow
- —
- DSCR
- —
- Eligible?
- —
Short-term bridge; refi at stabilization.
Listing history 19 events
-
2026-06-18days on market $275,000 Active 34 DOM
-
2026-06-17days on market $275,000 Active 33 DOM
-
2026-06-16pricedays on market $275,000 Active 32 DOM
-
2026-06-15days on market $300,000 Active 31 DOM
-
2026-06-13days on market $300,000 Active 29 DOM
-
2026-06-09days on market $300,000 Active 25 DOM
-
2026-06-08days on market $300,000 Active 24 DOM
-
2026-06-07days on market $300,000 Active 23 DOM
-
2026-06-04days on market $300,000 Active 20 DOM
-
2026-06-03days on market $300,000 Active 19 DOM
-
2026-06-02days on market $300,000 Active 18 DOM
-
2026-06-01days on market $300,000 Active 17 DOM
-
2026-05-31days on market $300,000 Active 16 DOM
-
2026-05-11$300,000 Active 191-char remark
-
2024-06-28soldstatus $160,000
-
2024-06-07soldstatus $160,000 Closed 228-char remark
Show marketing remark (228 chars)
This house needs major renovations or tear down and build your dream house in Northern Calvert County. A usable one acre lot and a large footprint for the house , with two out buildings. This property is sold "as is" .
-
2024-05-17status Pending 228-char remark
Show marketing remark (228 chars)
This house needs major renovations or tear down and build your dream house in Northern Calvert County. A usable one acre lot and a large footprint for the house , with two out buildings. This property is sold "as is" .
-
2024-05-16historical Active Under Contract 228-char remark
Show marketing remark (228 chars)
This house needs major renovations or tear down and build your dream house in Northern Calvert County. A usable one acre lot and a large footprint for the house , with two out buildings. This property is sold "as is" .
-
2024-05-09$150,000 Active 228-char remark
Show marketing remark (228 chars)
This house needs major renovations or tear down and build your dream house in Northern Calvert County. A usable one acre lot and a large footprint for the house , with two out buildings. This property is sold "as is" .
ⓘ Source: listings_history table (triggers on properties + properties_extension) + one-shot
backfill from property_details.listing_events for pre-trigger history.
Tax reassessment forecast MD · Partial reset (capped growth)
- Current annual tax
- $2,610 · $217/mo
- Projected year-2 tax
- $2,804 · $234/mo
- Expected delta
- +$194/yr (+$16/mo · 7.4%)
ⓘ Screening estimate from a state-policy table — verify with the county assessor before closing.
Climate risk First Street
- Flood 1/10 Low FEMA zone X (unshaded) · 0% chance over 30 yrs
- Wildfire 4/10 Moderate
- Heat 8/10 Severe 7 d/yr ≥103°F today · 16 d/yr by 30 yrs out
- Wind 6/10 Major 40% chance of damaging wind over 30 yrs
- Air quality 2/10 Low 1 unhealthy d/yr today · 2 by 30 yrs out
Nearby sold comps map
Loading sold comps map…
Walkable amenities ~0.75 mi
Loading nearby amenities…
Taxation est. · year 1
- Rental income
- $30,921
- − Mortgage interest
- −$15,404
- − Property taxes
- −$2,610
- − Insurance
- −$1,375
- − Repairs & maintenance
- −$2,474
- − Management
- −$2,474
- − Depreciation
- −$8,000
- Taxable loss
- −$1,416
- Est. tax savings @ 24.0%
- +$340
- After-tax cash flow
- $3,477/yr
For passive investors: Depreciation is non-cash, so a rental often shows a tax loss while cash-flowing — sheltering income. Rental losses are passive: they offset passive income freely, and up to $25,000/yr can offset ordinary (W-2) income if you actively participate and your MAGI is under $100k (phasing out to $0 by $150k); unused losses carry forward. On sale, claimed depreciation is recaptured at up to 25%, and gains may owe capital-gains tax (a 1031 exchange can defer both). Figures are a year-1 estimate at your 24.0% rate — not tax advice; consult a CPA.
Schools (NCES district)
- District
- Calvert County Public Schools
- NCES district ID
- 2400150
- Math proficiency
- 23% ▼ -29.00%
- Reading proficiency
- 44% ▼ -15.00%
- Median HH income
- $94,392
- Composite
- 33.27/100
- National rank
- #5511
- State rank
- #5 of 24 in MD
Livability — Owings
- Score
- 72/100
- State rank
- #139
- US rank
- #6016
Category grades
Schools grade is shown separately in the Schools card above.
Census & demographics
- Population (ZIP)
- 9,775
Population outlook (Calvert County) Hauer SSP2
- Today (2025)
- 94,825 people
- By 2030
- 96,197 · +1.4%
- By 2040
- 96,954 · +2.2%
- By 2050
- 94,628 · -0.2%
- By 2075
- 91,576 · -3.4%
- By 2100
- 83,431 · -12.0%
Race, ethnicity, and origin ACS 2023
- Neighborhood character
- Predominantly White (80%)
- Race & ethnicity
- White 80% Two or more races 11% Black 6% Hispanic / Latino 5%
- Hispanic origin (detail)
- Puerto Rican 2% Dominican 1%
- Common ancestry
- Lithuanian 4% Romanian 3% Italian 2%
- Foreign-born
- 3% · Canada
- Languages at home
- 97% English-only · Spanish 2% Other Indo-European 1%
Political lean MEDSL · Calvert
- 2024 margin
- R (+11.0) · D 43.5% · R 54.5% · Other 2.0%
- 2008→2024 swing
- -4.6pp toward R · 2008: -6.3pp · 2024: -11.0pp
- All cycles
- 2024: R+11.0 2020: R+5.6 2016: R+18.4 2012: R+8.2 2008: R+6.3
Not yet ingested
- Civics
- —
Market trends
- HPI YoY
- ▼ -80.24%
- Current HPI
- 273.5368
- Rent YoY
- —
- Metro
- —
- State GDP YoY
- ▲ 2.97%
- F500 in state
- 12
Industry mix (Fortune 500 HQ in MD)
| Industry | F500 HQs | Revenue |
|---|---|---|
| Aerospace / Defense | 1 | $71B |
|
||
| Utilities | 1 | $25B |
|
||
| Hotels | 1 | $24B |
|
||
| Consumer Goods | 1 | $7B |
|
||
| Real Estate | 1 | $6B |
|
||
| Chemicals | 1 | $2B |
|
||
Price history
+83.3% since first listed9 events — show timeline
- 2026-06-16 Price Changed $275,000 BRIGHT MLS
- 2026-05-30 Relisted — BRIGHT MLS
- 2026-05-26 Pending — BRIGHT MLS
- 2026-05-11 Listed $300,000 BRIGHT MLS
- 2024-06-28 Sold (Public Records) $160,000 Public Records
- 2024-06-07 Sold (MLS) $160,000 BRIGHT MLS
- 2024-05-17 Pending — BRIGHT MLS
- 2024-05-16 Contingent — BRIGHT MLS
- 2024-05-09 Listed $150,000 BRIGHT MLS
Property tax history
+1.9%/yrLatest (2025): $2,610 · +11.9% YoY. Source: county tax records.
Cash-flow waterfall
monthlySold comps — $/sqft
last 12 mo · ≤1 miLoading sold comps…