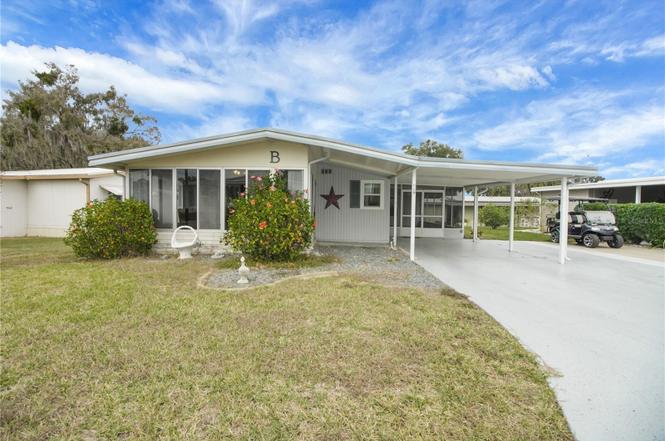
11 Orangewood Dr · Fruitland Park, FL
Flood risk 1/10 · Minimal
- FEMA flood zone
- X (unshaded)
- Chance of flooding over 30 yrs
- 0.0%
- Est. flood insurance / yr
- $507 – $1,088
Fire risk 4/10 · Minor
- Est. fire insurance / yr
- $947 – $1,759
Heat risk 8/10 · Major
- Hot days now (above 107°F)
- 7 days/yr
- Hot days in 30 yrs
- 22 days/yr
Wind risk 9/10 · Severe
- Chance of severe wind over 30 yrs
- 99.0%
Air-quality risk 3/10 · Minor
- Unhealthy air days now
- 2 days/yr
- Unhealthy air days in 30 yrs
- 4 days/yr
Risk factors via First Street. Map © Google.
Why this score? — see what drove the C grade
The composite is a weighted blend of 9 inputs, each scored 0–100. Each bar is that input's sub-score; the figure is the points it added to the 100-point composite (weight × sub-score).
- Cash flow +22.1/30.0
- ARV discount +7.5/15.0
- DSCR +7.1/10.0
- 1% rule +6.1/10.0
- Schools +4.2/10.0
- Livability +3.5/5.0
- Rent growth +2.5/5.0
- Condition / age +2.5/5.0
- Appreciation +0.0/10.0
$139,997
🖨 Deal sheet 📄 Offer letter ✓ Due diligence
Listing remarks
Charming 2 bedroom, 2 bath home with OVERSIZED Painted CARPORT & Driveway in the DESIRABLE 55+ community of Harbor Oaks with ACCESS to THE CHAIN OF LAKES. Situated along the shores of Lake Griffin on the famous Harris Chain of Lakes, this home offers the ability to enjoy an active and relaxed lifestyle in a beautiful setting with so many Amenities for a LOW $125 MONTHLY HOA. This home features a spacious living room that leads to the FL room. The kitchen has been freshly painted and has a stainless steel refrigerator, microwave and dishwasher. It also has a breakfast bar and dining area which have vinyl flooring. Some recent and important updates include: New Roof Over in 2018 and 8 N
Key facts
- New roof over
- Large screened porch
- 5,421 sq ft lot
Tags
Property features AI
Finance
- Other: Clubhouse and community pool access; Boat ramp (private) and fishing pier with lake access to Lake Griffin
- Financial info: Total monthly fees reported as $125; Total annual fees reported as $1,500; Lease restrictions apply
- HOA & community: HOA (Geri Rau) with required monthly fee of $125; Association amenities include clubhouse, pool and storage; Association fee includes pool, grounds maintenance, management, recreational facilities, sewer, trash and water; Association approval required; Buyer approval required; Deed restrictions; Senior community; Golf carts allowed; Pets allowed (max ~20 lbs)
Exterior
- Parking: Deeded parking; Driveway; 2-car carport
- Security: Smoke detector(s)
- Utilities: Private water; Private sewer; Electricity connected
- Home design: Manufactured home (double wide); One story; Faces north; Entry level: One
- Construction: Vinyl siding; Roof over; Crawlspace foundation; Built as a double wide
- Exterior features: Side porch; Rain gutters; Sliding doors; Shed(s) and exterior storage; Mature landscaping; Paved lot; Public maintained paved road
Interior
- Kitchen: Dishwasher; Range; Microwave; Refrigerator
- Bedrooms: 2 bedrooms
- Flooring: Carpet; Vinyl
- Bathrooms: 2 full bathrooms
- Heating & cooling: Central heat; Central air
- Interior features: Ceiling fans; Open floor plan; Walk-in closets; Blinds
- Laundry & utility: Laundry room; Washer; Dryer; Irrigation equipment
Neighborhood map
What this means for you Summary
Snapshot
- This is a 2-bed/2.0-bath condo listed at $140k.
Deal economics
- At list price, monthly cash flow is $227 ($3k/yr) — positive.
- The deal already cash-flows at list — no discount required.
- Meets the 1% rule at list price ($2k rent vs $140k).
- Recommended offer: $123k (12.0% below list) — sets the bar for market timing.
- Cap rate 8.2% vs local median 4.0% in Fruitland Park — top-decile yield for the area; either an underpriced asset or a hidden risk that comps aren't pricing in. Stress-test before assuming the spread holds.
Location & tenants
- Location reads 70/100 on livability (#447 in FL) — a middle-class / working-renter tenant base. Strengths: housing A+, crime A, health & safety A-; Watch: schools D, amenities F, commute F.
- Lake (suburban): math 49% / reading 50% proficiency, ranked #37 of 73 in FL (top 51%) — families likely to look elsewhere, expect single-tenant / working-renter base with shorter leases.
- Market conditions: 165 active listings in the ZIP; 7 comparable units currently listed for rent nearby; rentals at typical pace (median 24d on market — plan ~3-4 weeks tenant-placement turnaround); 4,799 units permitted in Lake County in 2024 (814 in 5+ unit buildings).
Forward outlook
- Local home prices are declining (-3.0%/yr); year-one equity from $968 of loan paydown is wiped out by about $4k of value loss. Plan a longer hold.
- Lake County population projected at +37% by 2050 — long-run rental-demand tailwind backs the buy-and-hold thesis.
Negotiation context
- It's been on market 153 days — a 12% lower offer ($123k) is reasonable based on typical stale-listing flexibility.
- 3 sale attempts with the ask held roughly flat each time — persistent listings suggest the price (not the market) is what's stuck; bring a comps-based counter.
Risks & watch-outs
- Climate carrying-cost: severe wind risk, 99% chance of damaging wind over 30y; extreme-heat days projected 7→22/yr by 2055 (HVAC capex compounding) — expect insurance premiums to compound above CPI over the hold.
Questions for the listing agent
- It's been on market 153 days. Have you received any prior offers? Is the seller open to a 12% concession, seller financing, or rate buy-down credit?
- What does the HOA fee cover, when was the last increase, and are there any pending special assessments or reserve-fund shortfalls?
- Any open or pending special assessments — roof, HVAC, plumbing, elevator, façade? What's the per-unit balance and payoff schedule, and is the seller paying it off at close or rolling it to the buyer?
- Why hasn't it sold? Are there any deal-killer items the seller is aware of (foundation, flood, title, zoning, code violations)?
- Is there a deadline driving the sale (1031 exchange, divorce, estate, relocation)? That informs how much negotiation room exists.
- Schools are D-rated, which usually means shorter tenancies and higher turnover. Who's the typical renter profile here, and what's been the actual vacancy rate?
- What's the average days-on-market for RENTAL listings here right now (not sales)? A rising rental-DOM trend means longer vacancies and softer asking-rent achievability than the comps imply.
- What's the recent tenant-quality profile in this submarket — average credit score on applications, eviction rate, late-payment / NSF rate, and stable-employment percentage? A property-management company in the area should have these aggregated.
- How much new apartment / multifamily construction is in the pipeline within 1–3 miles? Heavy new supply (>2% of stock underway) typically softens rents 12–24 months out; light construction supports rent growth.
Investment metrics
- 1% rule
- 1.11% ✓
- Cap rate
- 8.24%
- Cash-on-cash
- 6.94%
- DSCR
- 1.31
- GRM
- 7.5
CMA / ARV
No comps found within radius.
Projected returns pro-forma
-3.0% appreciation · 3.0% rent growth · sell at horizon
- IRR
- -5.6%
- Equity multiple
- 0.79×
- Total profit
- $-8,204
- Equity at exit
- $20,874
- IRR
- 4.1%
- Equity multiple
- 1.30×
- Total profit
- $11,633
- Equity at exit
- $12,104
Cash invested: $39,199 (down + closing). Projections, not guarantees.
Landlord ↔ Tenant lean methodology
- Overall (STATE)
- 87 Strongly Landlord-Friendly
- State Florida
- 87 Strongly Landlord-Friendly · R+3
- County
- — inherits STATE
- City
- — inherits STATE
ZIP-level market 34731
- Home prices YoY
- -10.1%
- Active inventory
- 165
- Price-to-rent
- 7.5×
Monthly cashflow live
- Estimated rent
- $1,559 high interval (Pro) →
- Mortgage (P&I)
- −$734
- Tax from tax record
- −$88 /mo · $1,052/yr
- Insurance
- −$58
- HOA
- −$125
- Vacancy / Maint / Mgmt
- −$327
- Net cashflow
- $227
Break-even live
UW: 25.0% down · 7.5% · 30yr · 1.5% tax · 5.0% vac · 8.0% maint · 8.0% mgmt
Financing live
Cash to close
- Down payment
- $34,999
- Closing costs
- $4,200
- Reserves months
- —
- Total cash needed
- —
Loan-product check · same deal, 3 products live
Conventional
25% down · 7.5% · 30yr
- Down + closing
- —
- Monthly P&I
- —
- Monthly cashflow
- —
- DSCR
- —
- Eligible?
- —
Personal DTI + credit; lowest rate.
DSCR
20% down · 8.5% · 30yr
- Down + closing
- —
- Monthly P&I
- —
- Monthly cashflow
- —
- DSCR
- —
- Eligible?
- —
No personal income docs; deal must DSCR.
Hard money
10% down · 12.0% · 12mo
- Down + closing
- —
- Monthly P&I
- —
- Monthly cashflow
- —
- DSCR
- —
- Eligible?
- —
Short-term bridge; refi at stabilization.
Rent comps 7 comps
| Address | Beds | Baths | Sqft | Rent | $/sqft | DOM | Units | Dist |
|---|---|---|---|---|---|---|---|---|
| 1204 Wood Duck Ln Fruitland Park, FL | 2.0 | 2.0 | 1235 | $1,475 | $1.19 | 17d | 1 | 0.30mi |
| 1414 N Lake View Ave Leesburg, FL | 4.0 | 1.0–3.0 | 1700 | $1,440 | $0.85 | 2d | 3 | 0.61mi |
| 2117 Citrus Blvd Unit 6 Leesburg, FL | 2.0 | 1.0 | 800 | $1,000 | $1.25 | 1d | 1 | 1.10mi |
| 2511 Sennett Dr Leesburg, FL | 2.0–4.0 | 2.0 | 1215 | $1,508 | $1.24 | 23d | 1 | 1.17mi |
| 306 N Iona Ave Fruitland Park, FL | 1.0 | 1.0 | 1400 | $1,500 | $1.07 | 23d | 1 | 1.26mi |
| 2400 Silver Pointe Cir Leesburg, FL | 1.0–2.0 | 1.0 | 837 | $1,050 | $1.25 | 23d | 1 | 1.27mi |
| 1241 Atlantic Ave Fruitland Park, FL | 3.0 | 2.0 | 1344 | $2,100 | $1.56 | 23d | 1 | 1.29mi |
HOA detail condo
- Monthly dues
- $125 · $1,500/yr
- Assessments
- None detected in remarks — confirm with the listing agent.
Listing history 19 events
-
2026-06-18days on market $139,997 Active 153 DOM
-
2026-06-17days on market $139,997 Active 152 DOM
-
2026-06-16days on market $139,997 Active 151 DOM
-
2026-06-15days on market $139,997 Active 150 DOM
-
2026-06-13days on market $139,997 Active 148 DOM
-
2026-06-09days on market $139,997 Active 144 DOM
-
2026-06-08days on market $139,997 Active 143 DOM
-
2026-06-07days on market $139,997 Active 142 DOM
-
2026-06-04days on market $139,997 Active 139 DOM
-
2026-06-03days on market $139,997 Active 138 DOM
-
2026-06-02days on market $139,997 Active 137 DOM
-
2026-06-02days on market $139,997 Active 136 DOM
-
2026-05-31days on market $139,997 Active 135 DOM
-
2026-04-30price $139,997
-
2026-01-16$144,999 Active
-
2025-12-30historical
-
2025-08-21price $145,900
-
2025-05-20status Active
-
2025-01-21$149,900 Active
ⓘ Source: listings_history table (triggers on properties + properties_extension) + one-shot
backfill from property_details.listing_events for pre-trigger history.
Tax reassessment forecast FL · Resets to sale price
- Current annual tax
- $1,052 · $88/mo
- Projected year-2 tax
- $1,162 · $97/mo
- Expected delta
- +$110/yr (+$9/mo · 10.5%)
ⓘ Screening estimate from a state-policy table — verify with the county assessor before closing.
Climate risk First Street
- Flood 1/10 Low FEMA zone X (unshaded) · 0% chance over 30 yrs
- Wildfire 4/10 Moderate
- Heat 8/10 Severe 7 d/yr ≥107°F today · 22 d/yr by 30 yrs out
- Wind 9/10 Extreme 99% chance of damaging wind over 30 yrs
- Air quality 3/10 Moderate 2 unhealthy d/yr today · 4 by 30 yrs out
Nearby sold comps map
Loading sold comps map…
Walkable amenities ~0.75 mi
Loading nearby amenities…
Taxation est. · year 1
- Rental income
- $18,711
- − Mortgage interest
- −$7,842
- − Property taxes
- −$1,052
- − Insurance
- −$700
- − Repairs & maintenance
- −$1,497
- − Management
- −$1,497
- − HOA
- −$1,500
- − Depreciation
- −$4,073
- Taxable income
- $550
- Est. tax owed @ 24.0%
- −$132
- After-tax cash flow
- $2,588/yr
For passive investors: Depreciation is non-cash, so a rental often shows a tax loss while cash-flowing — sheltering income. Rental losses are passive: they offset passive income freely, and up to $25,000/yr can offset ordinary (W-2) income if you actively participate and your MAGI is under $100k (phasing out to $0 by $150k); unused losses carry forward. On sale, claimed depreciation is recaptured at up to 25%, and gains may owe capital-gains tax (a 1031 exchange can defer both). Figures are a year-1 estimate at your 24.0% rate — not tax advice; consult a CPA.
Schools (NCES district)
- District
- Lake
- NCES district ID
- 1201050
- Math proficiency
- 49% ▼ -7.00%
- Reading proficiency
- 50% ▼ -4.00%
- Median HH income
- $46,632
- Composite
- 42.05/100
- National rank
- #3327
- State rank
- #37 of 73 in FL
Livability — Fruitland Park
- Score
- 70/100
- State rank
- #447
- US rank
- #8098
Category grades
Schools grade is shown separately in the Schools card above.
Census & demographics
- County
- Lake County · 364,602 people
- City population
- 12,196
- Metro
- Orlando-Kissimmee-Sanford, FL
- Population (ZIP)
- 12,196
- Household income
- $66,300
- Rent vs Own
- Severe rent burden
- 269.0
Population outlook (Lake County) Hauer SSP2
- Today (2025)
- 386,640 people
- By 2030
- 417,107 · +7.9%
- By 2040
- 476,676 · +23.3%
- By 2050
- 531,296 · +37.4%
- By 2075
- 648,303 · +67.7%
- By 2100
- 698,530 · +80.7%
Race, ethnicity, and origin ACS 2023
- Neighborhood character
- Predominantly White (76%)
- Race & ethnicity
- White 76% Black 11% Two or more races 11% Hispanic / Latino 3%
- Common ancestry
- Romanian 3% Serbian 2% Iranian 2%
- Foreign-born
- 5% · Canada
- Languages at home
- 98% English-only · Spanish 1% German/W. Germanic 1%
Political lean MEDSL · Lake
- 2024 margin
- Strong R (+24.7) · D 37.3% · R 62.0%
- 2008→2024 swing
- -11.2pp toward R · 2008: -13.5pp · 2024: -24.7pp
- All cycles
- 2024: R+24.7 2020: R+20.0 2016: R+23.1 2012: R+17.1 2008: R+13.5
Not yet ingested
- Civics
- —
Market trends
- HPI YoY
- ▼ -35.91%
- Current HPI
- 318.8206
- Rent YoY
- —
- Metro
- Orlando-Kissimmee-Sanford, FL
- State GDP YoY
- ▲ 3.28%
- F500 in state
- 36
Industry mix (Fortune 500 HQ in FL)
| Industry | F500 HQs | Revenue |
|---|---|---|
| Industrial Technology | 2 | $29B |
|
||
| Insurance | 2 | $17B |
|
||
| Retail | 1 | $60B |
|
||
| Technology Distribution | 1 | $58B |
|
||
| Homebuilding | 1 | $35B |
|
||
| Technology Manufacturing | 1 | $35B |
|
||
Price history
-6.6% since first listed6 events — show timeline
- 2026-04-30 Price Changed $139,997 Stellar MLS as Distributed by MLS Grid
- 2026-01-16 Listed $144,999 Stellar MLS as Distributed by MLS Grid
- 2025-12-30 Listing Removed — Stellar MLS as Distributed by MLS Grid
- 2025-08-21 Price Changed $145,900 Stellar MLS as Distributed by MLS Grid
- 2025-05-20 Relisted — Stellar MLS as Distributed by MLS Grid
- 2025-01-21 Listed $149,900 Stellar MLS as Distributed by MLS Grid
Property tax history
+12.5%/yrLatest (2025): $1,052 · +3.7% YoY. Source: county tax records.
Cash-flow waterfall
monthlySold comps — $/sqft
last 12 mo · ≤1 miLoading sold comps…