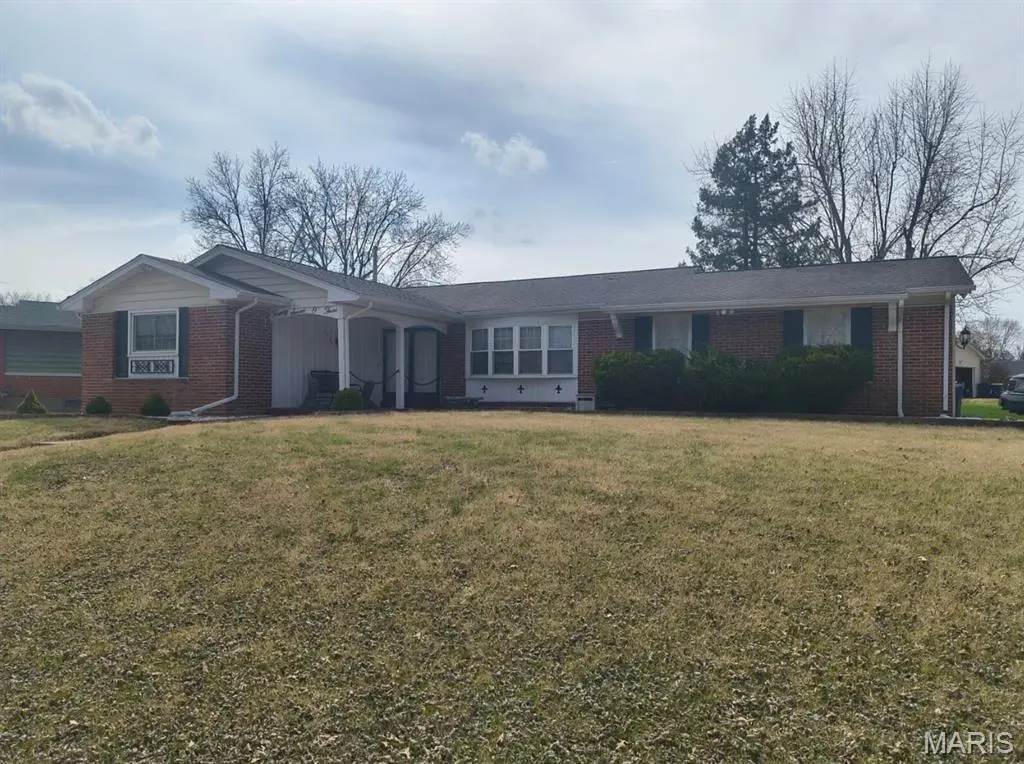
2703 Aberdeen Dr · Old Jamestown, MO
Flood risk 1/10 · Minimal
- FEMA flood zone
- X (unshaded)
- Chance of flooding over 30 yrs
- 0.0%
- Est. flood insurance / yr
- $473 – $860
Fire risk 1/10 · Minimal
- Est. fire insurance / yr
- $1,054 – $1,958
Heat risk 5/10 · Moderate
- Hot days now (above 106°F)
- 7 days/yr
- Hot days in 30 yrs
- 21 days/yr
Wind risk 2/10 · Minimal
- Chance of severe wind over 30 yrs
- 1.0%
Air-quality risk 3/10 · Minor
- Unhealthy air days now
- 3 days/yr
- Unhealthy air days in 30 yrs
- 5 days/yr
Risk factors via First Street. Map © Google.
Why this score? — see what drove the C+ grade
The composite is a weighted blend of 9 inputs, each scored 0–100. Each bar is that input's sub-score; the figure is the points it added to the 100-point composite (weight × sub-score).
- Cash flow +17.9/30.0
- ARV discount +12.7/15.0
- Appreciation +10.0/10.0
- DSCR +5.6/10.0
- 1% rule +5.1/10.0
- Rent growth +4.4/5.0
- Livability +3.3/5.0
- Condition / age +2.5/5.0
- Schools +1.2/10.0
$189,900
🖨 Deal sheet 📄 Offer letter ✓ Due diligence
Listing remarks MLS
Well-maintained 3-bedroom, 2.5-bath home located in a quiet Florissant neighborhood. This solid brick home offers over 1,300 square feet of main-level living space plus a full finished basement, providing additional room for entertaining, storage, or extended living. The functional layout, large lot, and strong rental potential make this property ideal for both homeowners and investors. Conveniently located near shopping, schools, and major highways, this home offers both comfort and accessibility. Key Features 3 spacious bedrooms 2.5 bathrooms Full finished basement with additional living space Approximately 1,386 square feet (main level) Large 0.33-acre lot Forced air heating Solid construction (built 1965) Off-street parking / driveway Located in an established neighborhood Location Highlights Easy access to Lindbergh Blvd and I-270 Close to shopping, restaurants, and everyday amenities Ferguson-Florissant School District
Key facts
- 0.33 acre lot
- 2 garage spots
- Built 1965
Neighborhood map
What this means for you Summary
Snapshot
- This is a 4-bed/2.5-bath single-family listed at $190k.
Deal economics
- At list price, monthly cash flow is $162 ($2k/yr) — positive.
- The deal already cash-flows at list — no discount required.
- Meets the 1% rule at list price ($2k rent vs $190k).
- Recommended offer: $179k (6.0% below list) — sets the bar for market timing.
- Cap rate 7.3% vs local median 5.3% in Old Jamestown — top-decile yield for the area; either an underpriced asset or a hidden risk that comps aren't pricing in. Stress-test before assuming the spread holds.
Location & tenants
- Location reads 66/100 on livability (#247 in MO) — a middle-class / working-renter tenant base. Strengths: employment A+, housing A+, cost of living A; Watch: amenities F, commute F, health & safety F.
- Ferguson-Florissant R-II (suburban): math 7% / reading 20% proficiency, ranked #311 of 324 in MO (top 96%) — low school quality limits family demand, transient renter base, plan for 1-2y turnover; 70% free/reduced lunch — lower-income household profile, screen leases tightly.
- Market conditions: Rents rising fast (+7.5%/yr); 218 active listings in the ZIP; 18 comparable units currently listed for rent nearby; rentals at typical pace (median 15d on market — plan ~3-4 weeks tenant-placement turnaround); 920 units permitted in St. Louis County in 2024 (250 in 5+ unit buildings).
- This rent runs 35% of the median local income ($67k/yr) — at the standard rent-burdened threshold; future hikes will face affordability resistance.
Forward outlook
- In year one you build about $20k of equity ($1k loan paydown + $19k appreciation (10.0% local appreciation)).
- At projected returns (10.0% appreciation + 7.5% rent growth), your $53k cash investment doubles in ~3 years — after that, you're playing with house money.
- By year 2, paydown + projected appreciation supports a ~$33k cash-out refi (75% LTV) — recoverable capital for the next deal without selling this one.
Negotiation context
- It's been on market 84 days — a 6% lower offer ($179k) is reasonable based on typical stale-listing flexibility.
- 2 sale attempts since 13y ago; this cycle's ask has dropped $10k (5%) from the opening price — seller is motivated, your offer sets the floor, not the list.
- Current owner paid $136k; 40% above their basis — modest negotiation headroom, anchor on the comps not their cost.
Risks & watch-outs
- Climate carrying-cost: extreme-heat days projected 7→21/yr by 2055 (HVAC capex compounding) — expect insurance premiums to compound above CPI over the hold.
Questions for the listing agent
- It's been on market 84 days. Have you received any prior offers? Is the seller open to a 6% concession, seller financing, or rate buy-down credit?
- Built in 1965 — when were the roof, HVAC, electrical panel, plumbing, and water heater last replaced?
- What does the HOA fee cover, when was the last increase, and are there any pending special assessments or reserve-fund shortfalls?
- Why hasn't it sold? Are there any deal-killer items the seller is aware of (foundation, flood, title, zoning, code violations)?
- Is there a deadline driving the sale (1031 exchange, divorce, estate, relocation)? That informs how much negotiation room exists.
- What's the average days-on-market for RENTAL listings here right now (not sales)? A rising rental-DOM trend means longer vacancies and softer asking-rent achievability than the comps imply.
- What's the recent tenant-quality profile in this submarket — average credit score on applications, eviction rate, late-payment / NSF rate, and stable-employment percentage? A property-management company in the area should have these aggregated.
- How much new for-sale + rental construction is in the pipeline within 1–3 miles? Heavy new supply typically softens prices + rents 12–24 months out; constrained supply supports both.
Investment metrics
- 1% rule
- 1.01% ✓
- Cap rate
- 7.31%
- Cash-on-cash
- 3.65%
- DSCR
- 1.16
- GRM
- 8.2
CMA / ARV
- ARV (median comp)
- $214,872
- List price
- $189,900
- Delta
- -11.62%
- Verdict
- UNDERPRICED
- Comps
- 20 within 1.0 mi
Show comp detail 12 sales within ~0.75 mi
| Address | Dist | Beds/Ba | Sqft | Sold | Price | $/sf | Match |
|---|---|---|---|---|---|---|---|
| 4 Cameo Ct | 0.49mi | 3/2.5 (-1) | 1,405 (+1%) | 0mo | $150,000 | $107 | 69 |
| 2560 Woodsage Dr | 0.54mi | 3/3.0 (-1) | 1,390 (+0%) | 1mo | $220,000 | $158 | 67 |
| 2940 Dover Dr | 0.66mi | 3/2.0 (-1) | 1,402 (+1%) | 1mo | $210,000 | $150 | 60 |
| 14741 Mondoubleau Ln | 0.40mi | 3/2.0 (-1) | 1,491 (+8%) | 2mo | $239,000 | $160 | 60 |
| 2945 Dover Dr | 0.69mi | 4/2.0 | 1,470 (+6%) | 2mo | $185,400 | $126 | 54 |
| 2910 Wellington Dr | 0.62mi | 4/2.0 | 1,517 (+10%) | 1mo | $159,900 | $105 | 52 |
| 4028 Les Cherbourg Ln | 0.44mi | 3/2.0 (-1) | 1,537 (+11%) | 4mo | $250,000 | $163 | 51 |
| 3914 Birkemeier Dr | 0.66mi | 3/2.0 (-1) | 1,315 (-5%) | 6mo | $222,000 | $169 | 48 |
| 7 Darwin Ct | 0.63mi | 4/2.0 | 1,560 (+13%) | 0mo | $200,000 | $128 | 47 |
| 9 Darwin Ct | 0.62mi | 3/3.0 (-1) | 1,540 (+11%) | 4mo | $235,000 | $153 | 42 |
| 15523 95th Ave | 0.65mi | 3/2.5 (-1) | 1,588 (+15%) | 1mo | $260,000 | $164 | 40 |
| 15550 Fox Plains Dr | 0.63mi | 3/2.0 (-1) | 1,178 (-15%) | 1mo | $249,000 | $211 | 38 |
Match score weights: distance 35% · size 25% · config 20% · recency 20%. Top-matched comps best support the ARV.
Projected returns pro-forma
10.0% appreciation · 7.51% rent growth · sell at horizon
- IRR
- 28.7%
- Equity multiple
- 3.31×
- Total profit
- $122,888
- Equity at exit
- $171,077
- IRR
- 26.4%
- Equity multiple
- 8.07×
- Total profit
- $376,069
- Equity at exit
- $368,934
Cash invested: $53,172 (down + closing). Projections, not guarantees.
Landlord ↔ Tenant lean methodology
- Overall (STATE)
- 81 Strongly Landlord-Friendly
- State Missouri
- 81 Strongly Landlord-Friendly · R+10
- County
- — inherits STATE
- City
- — inherits STATE
ZIP-level market 63033
- Home prices YoY
- 2.5%
- Rents YoY
- 7.5%
- Active inventory
- 218
- Price-to-rent
- 8.2×
Monthly cashflow live
- Estimated rent
- $1,922 high interval (Pro) →
- Mortgage (P&I)
- −$996
- Tax from tax record
- −$280 /mo · $3,360/yr
- Insurance
- −$79
- HOA
- −$2
- Vacancy / Maint / Mgmt
- −$404
- Net cashflow
- $162
Break-even live
UW: 25.0% down · 7.5% · 30yr · 1.5% tax · 5.0% vac · 8.0% maint · 8.0% mgmt
Financing live
Cash to close
- Down payment
- $47,475
- Closing costs
- $5,697
- Reserves months
- —
- Total cash needed
- —
Loan-product check · same deal, 3 products live
Conventional
25% down · 7.5% · 30yr
- Down + closing
- —
- Monthly P&I
- —
- Monthly cashflow
- —
- DSCR
- —
- Eligible?
- —
Personal DTI + credit; lowest rate.
DSCR
20% down · 8.5% · 30yr
- Down + closing
- —
- Monthly P&I
- —
- Monthly cashflow
- —
- DSCR
- —
- Eligible?
- —
No personal income docs; deal must DSCR.
Hard money
10% down · 12.0% · 12mo
- Down + closing
- —
- Monthly P&I
- —
- Monthly cashflow
- —
- DSCR
- —
- Eligible?
- —
Short-term bridge; refi at stabilization.
Rent comps 18 comps
| Address | Beds | Baths | Sqft | Rent | $/sqft | DOM | Units | Dist |
|---|---|---|---|---|---|---|---|---|
| 3144 Sunswept Pk Ct Florissant, MO | 1.0–3.0 | 1.0–2.0 | 818 | $1,250 | $1.53 | 1d | 12 | 0.42mi |
| 13 Cricket Ct Florissant, MO | 4.0 | 3.0 | 1560 | $2,550 | $1.63 | 43d | 1 | 0.70mi |
| 15686 93rd Ave Florissant, MO | 3.0 | 2.0 | 1370 | $1,948 | $1.42 | 12d | 1 | 0.80mi |
| 1983 Greenheath Dr Florissant, MO | 3.0 | 2.0 | 1040 | $1,331 | $1.28 | 3d | 1 | 0.92mi |
| 4112 Monsols Dr Florissant, MO | 3.0 | 2.0 | 1120 | $1,945 | $1.74 | 43d | 1 | 0.93mi |
| 3 Cantabrian Ct Florissant, MO | 3.0 | 2.0 | 1436 | $1,881 | $1.31 | 14d | 1 | 1.04mi |
| 2075 Cordoba Dr Florissant, MO | 3.0 | 2.0 | 1523 | $1,850 | $1.21 | 14d | 1 | 1.10mi |
| 2942 Chance Dr Florissant, MO | 3.0 | 1.0 | 912 | $1,700 | $1.86 | 12d | 1 | 1.12mi |
| 1785 Trotter Way Florissant, MO | 3.0 | 2.0 | 1297 | $1,806 | $1.39 | 7d | 1 | 1.13mi |
| 3930 Belcroft Dr Florissant, MO | 3.0 | 3.0 | 1408 | $1,935 | $1.37 | 43d | 1 | 1.14mi |
| 330 Moule Dr Florissant, MO | 3.0 | 1.0 | 1014 | $1,575 | $1.55 | 43d | 1 | 1.14mi |
| 775 Sherwood Dr Florissant, MO | 3.0 | 1.0 | 1023 | $1,690 | $1.65 | 43d | 1 | 1.19mi |
| 1600 Horseshoe Dr Florissant, MO | 3.0 | 2.0 | 1314 | $1,550 | $1.18 | 43d | 1 | 1.31mi |
| 2857 Dawnview Dr Florissant, MO | 3.0 | 1.0 | 890 | $1,325 | $1.49 | 7d | 1 | 1.34mi |
| 979 Dawnview Dr Florissant, MO | 5.0 | 2.0 | 1574 | $1,841 | $1.17 | 43d | 1 | 1.37mi |
| 1710 Kay Dr Florissant, MO | 3.0 | 1.0 | 960 | $1,500 | $1.56 | 2d | 1 | 1.44mi |
| 1332 Langholm Dr Florissant, MO | 3.0 | 1.0 | 924 | $1,650 | $1.79 | 1d | 1 | 1.47mi |
| 1740 Deborah Dr Florissant, MO | 3.0 | 2.5 | 1650 | $1,750 | $1.06 | 17d | 1 | 1.49mi |
HOA detail
- Monthly dues
- $2 · $24/yr
Listing history 21 events
-
2026-06-18days on market $189,900 Active 84 DOM
-
2026-06-17days on market $189,900 Active 83 DOM
-
2026-06-16days on market $189,900 Active 82 DOM
-
2026-06-15days on market $189,900 Active 81 DOM
-
2026-06-13days on market $189,900 Active 79 DOM
-
2026-06-13days on market $189,900 Active 78 DOM
-
2026-06-09days on market $189,900 Active 75 DOM
-
2026-06-08days on market $189,900 Active 74 DOM
-
2026-06-07days on market $189,900 Active 73 DOM
-
2026-06-05days on market $189,900 Active 70 DOM
-
2026-06-03days on market $189,900 Active 69 DOM
-
2026-06-02days on market $189,900 Active 68 DOM
-
2026-06-01days on market $189,900 Active 67 DOM
-
2026-05-31days on market $189,900 Active 66 DOM
-
2026-04-06price $189,900 940-char remark
Show marketing remark (940 chars)
Well-maintained 3-bedroom, 2.5-bath home located in a quiet Florissant neighborhood. This solid brick home offers over 1,300 square feet of main-level living space plus a full finished basement, providing additional room for entertaining, storage, or extended living. The functional layout, large lot, and strong rental potential make this property ideal for both homeowners and investors. Conveniently located near shopping, schools, and major highways, this home offers both comfort and accessibility. Key Features 3 spacious bedrooms 2.5 bathrooms Full finished basement with additional living space Approximately 1,386 square feet (main level) Large 0.33-acre lot Forced air heating Solid construction (built 1965) Off-street parking / driveway Located in an established neighborhood Location Highlights Easy access to Lindbergh Blvd and I-270 Close to shopping, restaurants, and everyday amenities Ferguson-Florissant School District
-
2026-03-26$199,900 Active 940-char remark
Show marketing remark (940 chars)
Well-maintained 3-bedroom, 2.5-bath home located in a quiet Florissant neighborhood. This solid brick home offers over 1,300 square feet of main-level living space plus a full finished basement, providing additional room for entertaining, storage, or extended living. The functional layout, large lot, and strong rental potential make this property ideal for both homeowners and investors. Conveniently located near shopping, schools, and major highways, this home offers both comfort and accessibility. Key Features 3 spacious bedrooms 2.5 bathrooms Full finished basement with additional living space Approximately 1,386 square feet (main level) Large 0.33-acre lot Forced air heating Solid construction (built 1965) Off-street parking / driveway Located in an established neighborhood Location Highlights Easy access to Lindbergh Blvd and I-270 Close to shopping, restaurants, and everyday amenities Ferguson-Florissant School District
-
2013-11-21soldstatus $136,000
-
2013-11-14soldstatus 673-char remark
Show marketing remark (673 chars)
Outstanding home on an oversized corner lot with RENOVATIONS GALORE. This brick home with oversized side entry garage has an OPEN FLOOR PLAN, boasts an updated kitchen with crown molding, stainless steel appliances,hardwood and ceramic flooring and a master bedroom suite. Also just a few of the many updates are FURNACE,A/C,ROOF,GUTTERS, SIDING,INSULATED WINDOWS,ELECTRICAL AND MUCH MORE. The REC AREA in the lower level has a theater area, pool table and custom bar sitting to watch the big games. Enjoy paradise when you walk out to the covered patio overlooking a gleaming inground pool and SPA. Truly a pleasure to show and to have many wonderful family gatherings.
-
2013-09-06$139,000 673-char remark
Show marketing remark (673 chars)
Outstanding home on an oversized corner lot with RENOVATIONS GALORE. This brick home with oversized side entry garage has an OPEN FLOOR PLAN, boasts an updated kitchen with crown molding, stainless steel appliances,hardwood and ceramic flooring and a master bedroom suite. Also just a few of the many updates are FURNACE,A/C,ROOF,GUTTERS, SIDING,INSULATED WINDOWS,ELECTRICAL AND MUCH MORE. The REC AREA in the lower level has a theater area, pool table and custom bar sitting to watch the big games. Enjoy paradise when you walk out to the covered patio overlooking a gleaming inground pool and SPA. Truly a pleasure to show and to have many wonderful family gatherings.
-
2001-04-25soldstatus $92,000
-
1965-09-02soldstatus
ⓘ Source: listings_history table (triggers on properties + properties_extension) + one-shot
backfill from property_details.listing_events for pre-trigger history.
Tax reassessment forecast MO · Resets to sale price
- Current annual tax
- $3,360 · $280/mo
- Projected year-2 tax
- $3,360 · $280/mo
- Expected delta
- $0/yr ($0/mo · -0.0%)
ⓘ Screening estimate from a state-policy table — verify with the county assessor before closing.
Climate risk First Street
- Flood 1/10 Low FEMA zone X (unshaded) · 0% chance over 30 yrs
- Wildfire 1/10 Low
- Heat 5/10 Major 7 d/yr ≥106°F today · 21 d/yr by 30 yrs out
- Wind 2/10 Low 100% chance of damaging wind over 30 yrs
- Air quality 3/10 Moderate 3 unhealthy d/yr today · 5 by 30 yrs out
Nearby sold comps map
Loading sold comps map…
Walkable amenities ~0.75 mi
Loading nearby amenities…
Taxation est. · year 1
- Rental income
- $23,066
- − Mortgage interest
- −$10,637
- − Property taxes
- −$3,360
- − Insurance
- −$950
- − Repairs & maintenance
- −$1,845
- − Management
- −$1,845
- − HOA
- −$24
- − Depreciation
- −$5,524
- Taxable loss
- −$1,120
- Est. tax savings @ 24.0%
- +$269
- After-tax cash flow
- $2,207/yr
For passive investors: Depreciation is non-cash, so a rental often shows a tax loss while cash-flowing — sheltering income. Rental losses are passive: they offset passive income freely, and up to $25,000/yr can offset ordinary (W-2) income if you actively participate and your MAGI is under $100k (phasing out to $0 by $150k); unused losses carry forward. On sale, claimed depreciation is recaptured at up to 25%, and gains may owe capital-gains tax (a 1031 exchange can defer both). Figures are a year-1 estimate at your 24.0% rate — not tax advice; consult a CPA.
Schools (NCES district)
- District
- Ferguson-Florissant R-II
- NCES district ID
- 2912010
- Math proficiency
- 7% ▼ -9.00%
- Reading proficiency
- 20% ▼ -6.00%
- Median HH income
- $44,610
- Composite
- 11.96/100
- National rank
- #9666
- State rank
- #311 of 324 in MO
Livability — Old Jamestown
- Score
- 66/100
- State rank
- #247
- US rank
- #12156
Category grades
Schools grade is shown separately in the Schools card above.
Census & demographics
- Census place
- Old Jamestown, MO
- County
- Saint Louis County · 888,823 people
- City population
- 19,557
- Metro
- St. Louis, MO-IL
- Population (ZIP)
- 43,056
- Household income
- $66,776
- Rent vs Own
- Severe rent burden
- 1429.0
Population outlook (St. Louis County) Hauer SSP2
- Today (2025)
- 1,025,227 people
- By 2030
- 1,028,023 · +0.3%
- By 2040
- 1,020,940 · -0.4%
- By 2050
- 1,007,280 · -1.8%
- By 2075
- 987,277 · -3.7%
- By 2100
- 921,984 · -10.1%
Race, ethnicity, and origin ACS 2023
- Neighborhood character
- Predominantly Black (71%)
- Race & ethnicity
- Black 71% White 23% Two or more races 4% Hispanic / Latino 1%
- Common ancestry
- Romanian 1% Lithuanian 1% Italian 1%
- Foreign-born
- 3% · Canada, Vietnam
- Languages at home
- 95% English-only · Spanish 1% French/Haitian/Cajun 1%
Political lean MEDSL · St. Louis
- 2024 margin
- Strong D (+23.4) · D 60.8% · R 37.4% · Other 1.7%
- 2008→2024 swing
- +3.5pp toward D · 2008: 19.9pp · 2024: 23.4pp
- All cycles
- 2024: D+23.4 2020: D+24.0 2016: D+16.2 2012: D+13.7 2008: D+19.9
Not yet ingested
- Civics
- —
Market trends
- HPI YoY
- ▲ 13.78%
- Current HPI
- 570.6
- Rent YoY
- ▲ 7.51%
- Metro
- St. Louis, MO-IL
- State GDP YoY
- ▲ 1.84%
- F500 in state
- 20
Industry mix (Fortune 500 HQ in MO)
| Industry | F500 HQs | Revenue |
|---|---|---|
| Healthcare | 1 | $163B |
|
||
| Insurance | 1 | $21B |
|
||
| Industrial Technology | 1 | $17B |
|
||
| Retail | 1 | $16B |
|
||
| Industrial Distribution | 1 | $10B |
|
||
| Utilities | 1 | $9B |
|
||
Price history
+106.4% since first listed7 events — show timeline
- 2026-04-06 Price Changed $189,900 MARIS as Distributed by MLS Grid
- 2026-03-26 Listed $199,900 MARIS as Distributed by MLS Grid
- 2013-11-21 Sold (Public Records) $136,000 Public Records
- 2013-11-14 Sold (MLS) — MARIS as Distributed by MLS Grid
- 2013-09-06 Listed $139,000 MARIS as Distributed by MLS Grid
- 2001-04-25 Sold (Public Records) $92,000 Public Records
- 1965-09-02 Sold (Public Records) — Public Records
Property tax history
+6.7%/yrLatest (2022): $3,360 · +5.1% YoY. Source: county tax records.
Cash-flow waterfall
monthlySold comps — $/sqft
last 12 mo · ≤1 miLoading sold comps…