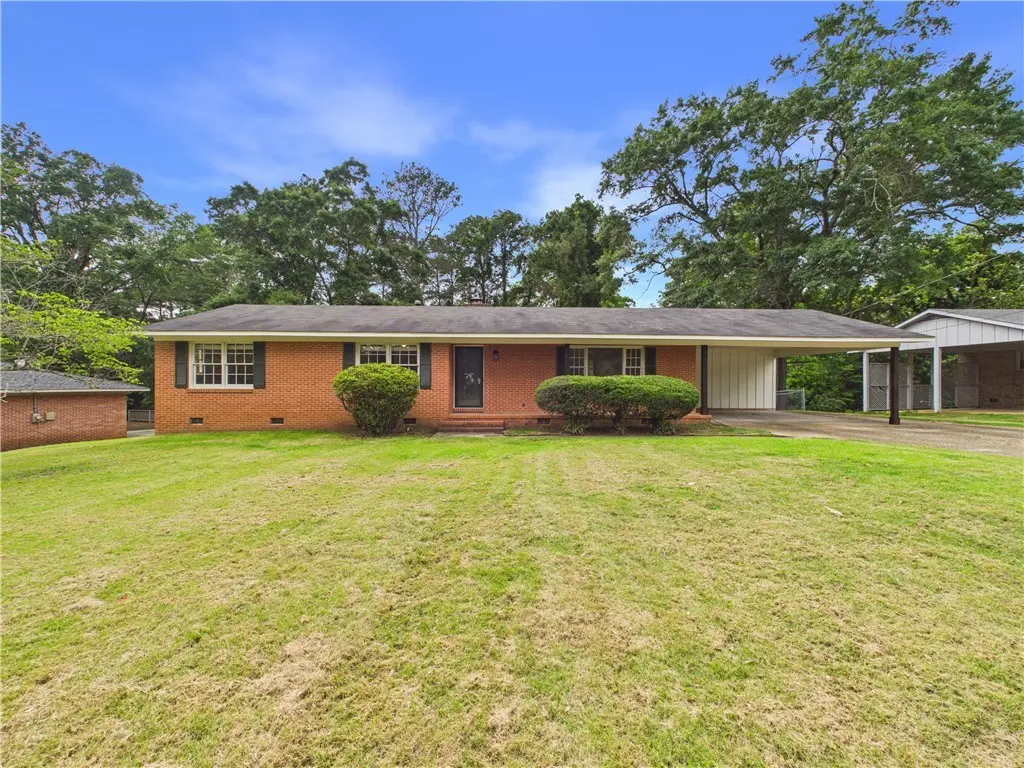
1300 Pinedale Dr · Opelika, AL
Flood risk 1/10 · Minimal
- FEMA flood zone
- X (unshaded)
- Chance of flooding over 30 yrs
- 0.0%
- Est. flood insurance / yr
- $507 – $1,088
Fire risk 2/10 · Minimal
- Est. fire insurance / yr
- $916 – $1,700
Heat risk 6/10 · Moderate
- Hot days now (above 104°F)
- 7 days/yr
- Hot days in 30 yrs
- 19 days/yr
Wind risk 6/10 · Moderate
- Chance of severe wind over 30 yrs
- 67.0%
Air-quality risk 1/10 · Minimal
- Unhealthy air days now
- 0 days/yr
- Unhealthy air days in 30 yrs
- 0 days/yr
Risk factors via First Street. Map © Google.
Why this score? — see what drove the D- grade
The composite is a weighted blend of 9 inputs, each scored 0–100. Each bar is that input's sub-score; the figure is the points it added to the 100-point composite (weight × sub-score).
- Cash flow +9.8/30.0
- Appreciation +6.5/10.0
- ARV discount +5.1/15.0
- Livability +3.2/5.0
- Schools +2.9/10.0
- DSCR +2.8/10.0
- Rent growth +2.5/5.0
- Condition / age +2.5/5.0
- 1% rule +1.8/10.0
$294,900
🖨 Deal sheet 📄 Offer letter ✓ Due diligence
Listing remarks
Welcome home to a spacious brick ranch offering the comfort, flexibility, and character that today's buyers are looking for. This well-designed home features over 1,700 square feet of living space with three generously sized bedrooms and two full baths, providing plenty of room for family, guests, or a growing household. Inside, you'll find both a formal living room and a warm, inviting keeping room just off the kitchen, complete with a fireplace that creates the perfect gathering space for relaxing evenings or entertaining friends and family. The oversized laundry room provides exceptional storage and functionality, while the rear flex room is ideal for a home office, hobby room, playroom,
Key facts
- Formal living room
- Keeping room
- Rear flex room
Tags
Property features AI
Finance
- Other: Located in the BROOKWOOD subdivision
- HOA & community: No association amenities
Exterior
- Parking: Attached carport; Two carport spaces
- Utilities: Water available
- Home design: Single-story residential home; Brick construction
- Construction: Brick exterior; One level
- Exterior features: No fencing; No pool listed; Water available
Interior
- Kitchen: Cooktop; Electric range
- Bathrooms: Two full bathrooms (both on the main level)
- Heating & cooling: Forced air heating; Ceiling fan(s); Central electric air conditioning
- Interior features: Ceiling fans; Fireplace with insert
- Laundry & utility: Washer hookup; Crawl space basement
Neighborhood map
What this means for you Summary
Snapshot
- This is a 3-bed/1.0-bath single-family listed at $295k.
Deal economics
- At list price, monthly cash flow is $-188 ($-2k/yr) — negative.
- To cash-flow at today's rent, offer at most $262k (11.3% below list).
- To meet the 1% rule (rent ≥ 1% of price), the offer needs to be $201k (31.8% below list).
- Recommended offer: $201k (31.8% below list) — sets the bar for 1% rule.
- Cap rate 5.5% vs local median 3.8% in Opelika — top-decile yield for the area; either an underpriced asset or a hidden risk that comps aren't pricing in. Stress-test before assuming the spread holds.
Location & tenants
- Location reads 63/100 on livability (#188 in AL) — a middle-class / working-renter tenant base. Strengths: cost of living A+, housing A+; Watch: schools C-, employment C-, crime F.
- Opelika City (urban): math 27% / reading 43% proficiency, ranked #45 of 129 in AL (top 35%) — families likely to look elsewhere, expect single-tenant / working-renter base with shorter leases; 62% free/reduced lunch — lower-income household profile, screen leases tightly.
- Market conditions: 3 active listings in the ZIP; 7 comparable units currently listed for rent nearby; rentals at typical pace (median 21d on market — plan ~3-4 weeks tenant-placement turnaround); 43% of comp listings sitting > 30 days — soft ceiling on asking rent; 1,858 units permitted in Lee County in 2024 (113 in 5+ unit buildings).
Forward outlook
- In year one you build about $11k of equity ($2k loan paydown + $9k appreciation (3.1% local appreciation)).
- Lee County population projected at +54% by 2050 — long-run rental-demand tailwind backs the buy-and-hold thesis.
- By year 4, paydown + projected appreciation supports a ~$37k cash-out refi (75% LTV) — recoverable capital for the next deal without selling this one.
Negotiation context
- Only 4 days on market — expect competitive offers; lowballing is unlikely to land.
Risks & watch-outs
- Climate carrying-cost: major wind risk, 67% chance of damaging wind over 30y; extreme-heat days projected 7→19/yr by 2055 (HVAC capex compounding) — expect insurance premiums to compound above CPI over the hold.
Questions for the listing agent
- What do current leases actually rent for vs. the listed asking? Can we see a recent rent roll and the last 12 months of T-12 income?
- Built in 1970 — when were the roof, HVAC, electrical panel, plumbing, and water heater last replaced?
- Is there a deadline driving the sale (1031 exchange, divorce, estate, relocation)? That informs how much negotiation room exists.
- Crime grade is F in this area — have there been break-ins, vandalism, or insurance claims at this property in the last 3 years? What carrier currently insures it and at what premium?
- The area grade is low — what's the realistic commute time and amenity access for the typical tenant pool here? Any planned neighborhood developments (good or bad) we should know about?
- What's the average days-on-market for RENTAL listings here right now (not sales)? A rising rental-DOM trend means longer vacancies and softer asking-rent achievability than the comps imply.
- What's the recent tenant-quality profile in this submarket — average credit score on applications, eviction rate, late-payment / NSF rate, and stable-employment percentage? A property-management company in the area should have these aggregated.
- How much new for-sale + rental construction is in the pipeline within 1–3 miles? Heavy new supply typically softens prices + rents 12–24 months out; constrained supply supports both.
Investment metrics
- 1% rule
- 0.68% ✗
- Cap rate
- 5.53%
- Cash-on-cash
- -2.73%
- DSCR
- 0.88
- GRM
- 12.2
CMA / ARV
- ARV (on-the-fly)
- $279,948
- Comps found
- 12
Show comp detail 12 sales within ~0.75 mi
| Address | Dist | Beds/Ba | Sqft | Sold | Price | $/sf | Match |
|---|---|---|---|---|---|---|---|
| 608 Mclure Ave | 0.41mi | 3/2.0 | 1,737 (+2%) | 6mo | $175,000 | $101 | 68 |
| 316 Hillcrest Ave | 0.29mi | 3/2.0 | 1,660 (-3%) | 11mo | $290,000 | $175 | 68 |
| 410 Etowah Ave | 0.49mi | 3/2.0 | 1,706 (-0%) | 10mo | $218,000 | $128 | 64 |
| 208 Preston Ct | 0.35mi | 3/2.0 | 1,521 (-11%) | 2mo | $255,000 | $168 | 60 |
| 400 Etowah Ave | 0.48mi | 4/2.0 (+1) | 1,762 (+3%) | 6mo | $260,000 | $148 | 58 |
| 305 3rd Ave | 0.53mi | 3/2.0 | 1,858 (+9%) | 1mo | $324,000 | $174 | 56 |
| 314 N 2nd St | 0.40mi | 3/2.0 | 1,498 (-12%) | 6mo | $239,000 | $160 | 52 |
| 1308 Denson Dr | 0.44mi | 3/2.0 | 1,925 (+13%) | 5mo | $265,000 | $138 | 50 |
| 805 India Rd | 0.58mi | 3/2.0 | 1,496 (-12%) | 0mo | $265,000 | $177 | 48 |
| 508 5th Ave | 0.58mi | 3/2.0 | 1,554 (-9%) | 10mo | $215,000 | $138 | 45 |
| 801 India Rd | 0.55mi | 3/2.0 | 1,474 (-14%) | 4mo | $295,000 | $200 | 44 |
| 1306 Claire St | 0.33mi | 4/2.0 (+1) | 1,945 (+14%) | 13mo | $318,800 | $164 | 42 |
Match score weights: distance 35% · size 25% · config 20% · recency 20%. Top-matched comps best support the ARV.
Projected returns pro-forma
3.06% appreciation · 3.0% rent growth · sell at horizon
- IRR
- 5.1%
- Equity multiple
- 1.29×
- Total profit
- $24,307
- Equity at exit
- $133,530
- IRR
- 8.1%
- Equity multiple
- 2.24×
- Total profit
- $102,078
- Equity at exit
- $206,512
Cash invested: $82,572 (down + closing). Projections, not guarantees.
Landlord ↔ Tenant lean methodology
- Overall (STATE)
- 90 Strongly Landlord-Friendly
- State Alabama
- 90 Strongly Landlord-Friendly · R+15
- County
- — inherits STATE
- City
- — inherits STATE
ZIP-level market 31801
- Home prices YoY
- 1.1%
- Active inventory
- 3
- Price-to-rent
- 12.2×
Monthly cashflow live
- Estimated rent
- $2,010 high interval (Pro) →
- Mortgage (P&I)
- −$1,546
- Tax from tax record
- −$107 /mo · $1,279/yr
- Insurance
- −$123
- HOA
- −$0
- Vacancy / Maint / Mgmt
- −$422
- Net cashflow
- $-188
Break-even live
UW: 25.0% down · 7.5% · 30yr · 1.5% tax · 5.0% vac · 8.0% maint · 8.0% mgmt
Financing live
Cash to close
- Down payment
- $73,725
- Closing costs
- $8,847
- Reserves months
- —
- Total cash needed
- —
Loan-product check · same deal, 3 products live
Conventional
25% down · 7.5% · 30yr
- Down + closing
- —
- Monthly P&I
- —
- Monthly cashflow
- —
- DSCR
- —
- Eligible?
- —
Personal DTI + credit; lowest rate.
DSCR
20% down · 8.5% · 30yr
- Down + closing
- —
- Monthly P&I
- —
- Monthly cashflow
- —
- DSCR
- —
- Eligible?
- —
No personal income docs; deal must DSCR.
Hard money
10% down · 12.0% · 12mo
- Down + closing
- —
- Monthly P&I
- —
- Monthly cashflow
- —
- DSCR
- —
- Eligible?
- —
Short-term bridge; refi at stabilization.
Rent comps 7 comps
| Address | Beds | Baths | Sqft | Rent | $/sqft | DOM | Units | Dist |
|---|---|---|---|---|---|---|---|---|
| 410 Etowah Ave Unit 1 Opelika, AL | 3.0 | 2.0 | 1706 | $2,400 | $1.41 | 43d | 1 | 0.52mi |
| 676 Village Dr Opelika, AL | 2.0 | 2.0 | 1255 | $1,975 | $1.57 | 21d | 1 | 1.01mi |
| 403 Raintree St Opelika, AL | 4.0 | 2.0 | 1680 | $1,500 | $0.89 | 13d | 1 | 1.02mi |
| 829 S Railroad Ave #202 Opelika, AL | 2.0 | 2.0 | 1200 | $1,795 | $1.50 | 13d | 1 | 1.03mi |
| 1098 Burrow Cir Opelika, AL | 2.0 | 2.0 | 1183 | $1,600 | $1.35 | 43d | 1 | 1.08mi |
| 2208 Rocky Brook Rd Opelika, AL | 3.0 | 2.5 | 1674 | $2,000 | $1.19 | 21d | 1 | 1.15mi |
| 1008 Fitzpatrick Ave Opelika, AL | 3.0 | 2.0 | 2200 | $2,300 | $1.05 | 43d | 1 | 1.18mi |
Listing history 4 events
-
2026-06-07statusdays on market $294,900 Pending 4 DOM
-
2026-06-05days on market $294,900 Active 2 DOM
-
2026-06-03remarks 699-char remark
-
2026-06-03$294,900 Active 1 DOM
ⓘ Source: listings_history table (triggers on properties + properties_extension) + one-shot
backfill from property_details.listing_events for pre-trigger history.
Tax reassessment forecast AL · Resets to sale price
- Current annual tax
- $1,279 · $107/mo
- Projected year-2 tax
- $1,279 · $107/mo
- Expected delta
- $0/yr ($0/mo · 0.0%)
ⓘ Screening estimate from a state-policy table — verify with the county assessor before closing.
Climate risk First Street
- Flood 1/10 Low FEMA zone X (unshaded) · 0% chance over 30 yrs
- Wildfire 2/10 Low
- Heat 6/10 Major 7 d/yr ≥104°F today · 19 d/yr by 30 yrs out
- Wind 6/10 Major 67% chance of damaging wind over 30 yrs
- Air quality 1/10 Low 0 unhealthy d/yr today · 0 by 30 yrs out
Nearby sold comps map
Loading sold comps map…
Walkable amenities ~0.75 mi
Loading nearby amenities…
Taxation est. · year 1
- Rental income
- $24,123
- − Mortgage interest
- −$16,519
- − Property taxes
- −$1,279
- − Insurance
- −$1,474
- − Repairs & maintenance
- −$1,930
- − Management
- −$1,930
- − Depreciation
- −$8,579
- Taxable loss
- −$7,588
- Est. tax savings @ 24.0%
- +$1,821
- After-tax cash flow
- $-433/yr
For passive investors: Depreciation is non-cash, so a rental often shows a tax loss while cash-flowing — sheltering income. Rental losses are passive: they offset passive income freely, and up to $25,000/yr can offset ordinary (W-2) income if you actively participate and your MAGI is under $100k (phasing out to $0 by $150k); unused losses carry forward. On sale, claimed depreciation is recaptured at up to 25%, and gains may owe capital-gains tax (a 1031 exchange can defer both). Figures are a year-1 estimate at your 24.0% rate — not tax advice; consult a CPA.
Schools (NCES district)
- District
- Opelika City
- NCES district ID
- 0102580
- Math proficiency
- 27% ▼ -25.00%
- Reading proficiency
- 43% ▼ -1.00%
- Median HH income
- $40,081
- Composite
- 29.34/100
- National rank
- #6541
- State rank
- #45 of 129 in AL
Livability — Opelika
- Score
- 63/100
- State rank
- #188
- US rank
- #15556
Category grades
Schools grade is shown separately in the Schools card above.
Census & demographics
- Census place
- Opelika, AL
- City population
- 45,973
- Population (ZIP)
- 2,786
Population outlook (Lee County) Hauer SSP2
- Today (2025)
- 196,440 people
- By 2030
- 217,417 · +10.7%
- By 2040
- 259,467 · +32.1%
- By 2050
- 301,557 · +53.5%
- By 2075
- 402,186 · +104.7%
- By 2100
- 474,503 · +141.6%
Race, ethnicity, and origin ACS 2023
- Neighborhood character
- Predominantly White (68%)
- Race & ethnicity
- White 68% Black 15% Two or more races 9% Hispanic / Latino 6% Asian 2%
- Hispanic origin (detail)
- Mexican 5% Puerto Rican 1%
- Common ancestry
- Italian 2% Lithuanian 1%
- Foreign-born
- 6% · Canada
- Languages at home
- 93% English-only · Spanish 5% Other Asian/Pacific 2%
Political lean MEDSL · Lee
- 2024 margin
- Strong R (+27.8) · D 35.5% · R 63.3% · Other 1.2%
- 2008→2024 swing
- -8.1pp toward R · 2008: -19.8pp · 2024: -27.8pp
- All cycles
- 2024: R+27.8 2020: R+20.1 2016: R+23.1 2012: R+19.9 2008: R+19.8
Not yet ingested
- Civics
- —
Market trends
- HPI YoY
- ▲ 3.06%
- Current HPI
- 280.4765
- Rent YoY
- —
- Metro
- —
- State GDP YoY
- ▲ 2.94%
- F500 in state
- 4
Industry mix (Fortune 500 HQ in AL)
| Industry | F500 HQs | Revenue |
|---|---|---|
| Financial Services | 1 | $8B |
|
||
| Healthcare | 1 | $5B |
|
||
Price history
1 event — show timeline
- 2026-06-02 Listed $294,900 LCMLS
Property tax history
+4.6%/yrLatest (2025): $1,279 · +0.0% YoY. Source: county tax records.
Cash-flow waterfall
monthlySold comps — $/sqft
last 12 mo · ≤1 miLoading sold comps…