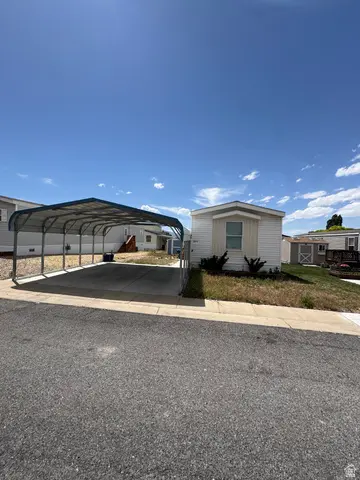
1611 N 180 E #64 · Tooele, UT
Flood risk 6/10 · Moderate
- FEMA flood zone
- X (unshaded)
- Chance of flooding over 30 yrs
- 0.74%
- Est. flood insurance / yr
- $473 – $860
Fire risk 8/10 · Major
- Est. fire insurance / yr
- $453 – $841
Heat risk 4/10 · Minor
- Hot days now (above 92°F)
- 2 days/yr
- Hot days in 30 yrs
- 6 days/yr
Wind risk 1/10 · Minimal
- Chance of severe wind over 30 yrs
- —
Air-quality risk 3/10 · Minor
- Unhealthy air days now
- 2 days/yr
- Unhealthy air days in 30 yrs
- 3 days/yr
Risk factors via First Street. Map © Google.
Why this score? — see what drove the C- grade
The composite is a weighted blend of 9 inputs, each scored 0–100. Each bar is that input's sub-score; the figure is the points it added to the 100-point composite (weight × sub-score).
- Cash flow +17.9/30.0
- 1% rule +10.0/10.0
- ARV discount +7.5/15.0
- DSCR +5.6/10.0
- Livability +3.9/5.0
- Rent growth +3.1/5.0
- Schools +3.0/10.0
- Condition / age +1.0/5.0
- Appreciation +0.0/10.0
$98,500
🖨 Deal sheet (PDF) 📄 Offer letter ✓ Due diligence
Listing remarks MLS
There are no remarks available.
Key facts
- Covered parking
- Ample closet space
- Storage shed
Tags
Property features AI
Finance
- HOA & community: Homeowners association (monthly fee); Association fee $860 per month; Community clubhouse; On-site management; Pets permitted; Picnic area; Playground
Exterior
- Parking: Total 4 parking spaces; 2 covered/carport spaces; 2 open parking spaces; Covered parking
- Utilities: Natural gas connected; Electricity connected; Sewer connected; Culinary (public) water
- Home design: Manufactured home; Built/standing condition; Single-family zoning
- Construction: Asphalt roof
- Exterior features: Mountain view; Storage shed(s)
Interior
- Kitchen: Refrigerator; Gas oven; Free-standing range/oven; Garbage disposal
- Bedrooms: Three main-level bedrooms; Primary bedroom on the 1st floor
- Flooring: Carpet; Linoleum
- Bathrooms: Two full bathrooms
- Heating & cooling: Gas central heating; Central air conditioning
- Interior features: Primary bathroom; Garbage disposal; Gas oven; Free-standing range/oven; Blinds on windows
- Laundry & utility: Electric dryer hookup
Neighborhood map
What this means for you Summary
Snapshot
- This is a 3-bed/2.0-bath manufactured listed at $98k. Condition is rated poor.
Deal economics
- At list price, monthly cash flow is $84 ($1k/yr) — positive.
- The deal already cash-flows at list — no discount required.
- Meets the 1% rule at list price ($2k rent vs $98k).
- Recommended offer: $97k (1.5% below list) — sets the bar for market timing.
Location & tenants
- Location reads 77/100 on livability (#52 in UT, #3,142 nationally) — a middle-class / working-renter tenant base. Strengths: commute A+, housing A+, cost of living A-; Watch: amenities F.
- Tooele District (town): math 32% / reading 34% proficiency, ranked #62 of 80 in UT (top 78%) — families likely to look elsewhere, expect single-tenant / working-renter base with shorter leases.
- Zoned schools: Copper Canyon School (math 22% / reading 22%, grade F, #509 of 585 statewide, top 88%, 468 students, 33% FRL); Clarke N. Johnsen Jr High (math 40% / reading 41%, grade F, #69 of 138 statewide, top 51%, 892 students, 45% FRL); Stansbury High (math 23% / reading 50%, grade F, #86 of 171 statewide, top 52%, 2,010 students, 14% FRL) — zoned schools at 31% FRL track the district average.
- Market conditions: Rents rising (+2.5%/yr); 589 active listings in the ZIP; 11 comparable units currently listed for rent nearby; rentals at typical pace (median 23d on market — plan ~3-4 weeks tenant-placement turnaround); solid renter incomes; 867 units permitted in Tooele County in 2024 (87 in 5+ unit buildings).
Forward outlook
- Local home prices are declining (-3.0%/yr); year-one equity from $681 of loan paydown is wiped out by about $3k of value loss. Plan a longer hold.
- Tooele County population projected at +33% by 2050 — long-run rental-demand tailwind backs the buy-and-hold thesis.
Negotiation context
- It's been on market 24 days — a 2% lower offer ($97k) is reasonable based on typical stale-listing flexibility.
- 3 sale attempts since 4y ago with the ask held roughly flat each time — persistent listings suggest the price (not the market) is what's stuck; bring a comps-based counter.
Risks & watch-outs
- Watch-outs: HOA is 42% of rent.
- Climate carrying-cost: major flood risk; severe wildfire risk — expect insurance premiums to compound above CPI over the hold.
Questions for the listing agent
- Have any recent inspections been done? Can we get a copy of the seller's disclosures and any deferred-maintenance estimates?
- What does the HOA fee cover, when was the last increase, and are there any pending special assessments or reserve-fund shortfalls?
- Is there a deadline driving the sale (1031 exchange, divorce, estate, relocation)? That informs how much negotiation room exists.
- Schools are D-rated, which usually means shorter tenancies and higher turnover. Who's the typical renter profile here, and what's been the actual vacancy rate?
- What's the average days-on-market for RENTAL listings here right now (not sales)? A rising rental-DOM trend means longer vacancies and softer asking-rent achievability than the comps imply.
- What's the recent tenant-quality profile in this submarket — average credit score on applications, eviction rate, late-payment / NSF rate, and stable-employment percentage? A property-management company in the area should have these aggregated.
- How much new for-sale + rental construction is in the pipeline within 1–3 miles? Heavy new supply typically softens prices + rents 12–24 months out; constrained supply supports both.
Investment metrics
- 1% rule
- 2.09% ✓
- Cap rate
- 7.31%
- Cash-on-cash
- 3.64%
- DSCR
- 1.16
- GRM
- 4.0
CMA / ARV
No comps found within radius.
Projected returns pro-forma
-3.0% appreciation · 2.53% rent growth · sell at horizon
- IRR
- -11.1%
- Equity multiple
- 0.60×
- Total profit
- $-11,045
- Equity at exit
- $14,687
- IRR
- -2.4%
- Equity multiple
- 0.84×
- Total profit
- $-4,423
- Equity at exit
- $8,516
Cash invested: $27,580 (down + closing). Projections, not guarantees.
Landlord ↔ Tenant lean methodology
- Overall (STATE)
- 86 Strongly Landlord-Friendly
- State Utah
- 86 Strongly Landlord-Friendly · R+15
- County
- — inherits STATE
- City
- — inherits STATE
ZIP-level market 84074
- Rents YoY
- 2.5%
- Active inventory
- 589
- Price-to-rent
- 4.0×
Monthly cashflow live
- Estimated rent
- $2,056 high interval (Pro) →
- Mortgage (P&I)
- −$517
- Tax est. 1.5%
- −$123 /mo · $1,478/yr
- Insurance
- −$41
- HOA
- −$860
- Vacancy / Maint / Mgmt
- −$432
- Net cashflow
- $84
Break-even live
Sensitivity live
| Price | -10% $152 | -5% $118 | +0% $84 | +5% $50 | +10% $16 |
|---|---|---|---|---|---|
| Rent | -10% $-79 | -5% $2 | +0% $84 | +5% $165 | +10% $246 |
| Rate | -1.0pp $133 | -0.5pp $109 | base $84 | +0.5pp $58 | +1.0pp $32 |
UW: 25.0% down · 7.5% · 30yr · 1.5% tax · 5.0% vac · 8.0% maint · 8.0% mgmt
Financing live
Cash to close
- Down payment
- $24,625
- Closing costs
- $2,955
- Reserves months
- —
- Total cash needed
- —
Loan-product check · same deal, 3 products live
Conventional
25% down · 7.5% · 30yr
- Down + closing
- —
- Monthly P&I
- —
- Monthly cashflow
- —
- DSCR
- —
- Eligible?
- —
Personal DTI + credit; lowest rate.
DSCR
20% down · 8.5% · 30yr
- Down + closing
- —
- Monthly P&I
- —
- Monthly cashflow
- —
- DSCR
- —
- Eligible?
- —
No personal income docs; deal must DSCR.
Hard money
10% down · 12.0% · 12mo
- Down + closing
- —
- Monthly P&I
- —
- Monthly cashflow
- —
- DSCR
- —
- Eligible?
- —
Short-term bridge; refi at stabilization.
Rent comps 11 comps
| Address | Beds | Baths | Sqft | Rent | $/sqft | DOM | Units | Dist |
|---|---|---|---|---|---|---|---|---|
| 1731 Copper Canyon Dr Tooele, UT | 3.0 | 2.0 | 1399 | $1,985 | $1.42 | 16d | 1 | 0.26mi |
| 1908 N Patchwork Ave Tooele, UT | 4.0 | 2.5 | 1400 | $2,230 | $1.59 | 21d | 1 | 0.36mi |
| 1942 N 20 W Tooele, UT | 3.0 | 1.5 | 1298 | $1,850 | $1.43 | 25d | 1 | 0.59mi |
| 742 N 100 E Tooele, UT | 1.0–3.0 | 1.0–2.0 | 892 | $1,578 | $1.77 | 25d | 2 | 0.99mi |
| 739 N 160 E Unit A Tooele, UT | 3.0 | 2.0 | 1368 | $1,750 | $1.28 | 25d | 1 | 1.01mi |
| 135 E 730 N Unit 1 Tooele, UT | 3.0 | 2.0 | 1368 | $2,150 | $1.57 | 6d | 1 | 1.03mi |
| 728 N 160 E Tooele, UT | 3.0 | 2.0 | 1396 | $1,800 | $1.29 | 23d | 1 | 1.03mi |
| 116 E 730 N Unit 1 Tooele, UT | 3.0 | 2.0 | 1368 | $1,800 | $1.32 | 25d | 1 | 1.06mi |
| 71 W 740 N Tooele, UT | 3.0 | 2.0 | 1479 | $2,200 | $1.49 | 21d | 1 | 1.09mi |
| 1241 N Lexington Greens Dr Tooele, UT | 1.0–3.0 | 1.0–2.0 | 1006 | $1,799 | $1.79 | 4d | 40 | 1.17mi |
| 345 E 400 N Unit A Tooele, UT | 2.0 | 1.0 | 942 | $1,425 | $1.51 | 25d | 1 | 1.49mi |
HOA detail
- Monthly dues
- $860 · $10,320/yr
Listing history 20 events
-
2026-06-21days on market $98,500 Active 24 DOM
-
2026-06-18days on market $98,500 Active 21 DOM
-
2026-06-17days on market $98,500 Active 20 DOM
-
2026-06-16days on market $98,500 Active 19 DOM
-
2026-06-15days on market $98,500 Active 18 DOM
-
2026-06-13days on market $98,500 Active 16 DOM
-
2026-06-09days on market $98,500 Active 12 DOM
-
2026-06-08days on market $98,500 Active 11 DOM
-
2026-06-07days on market $98,500 Active 10 DOM
-
2026-06-03days on market $98,500 Active 6 DOM
-
2026-06-02days on market $98,500 Active 5 DOM
-
2026-06-01days on market $98,500 Active 4 DOM
-
2026-05-31days on market $98,500 Active 3 DOM
-
2026-05-28$98,500 Active
-
2025-06-25soldstatus Closed 31-char remark
Show marketing remark (31 chars)
There are no remarks available.
-
2025-06-18status Under Contract 31-char remark
Show marketing remark (31 chars)
There are no remarks available.
-
2025-05-17$85,000 Active 31-char remark
Show marketing remark (31 chars)
There are no remarks available.
-
2022-10-27soldstatus Closed 31-char remark
Show marketing remark (31 chars)
There are no remarks available.
-
2022-07-25status Under Contract 31-char remark
Show marketing remark (31 chars)
There are no remarks available.
-
2022-07-18$80,000 Active 31-char remark
Show marketing remark (31 chars)
There are no remarks available.
ⓘ Source: listings_history table (triggers on properties + properties_extension) + one-shot
backfill from property_details.listing_events for pre-trigger history.
Climate risk First Street
- Flood 6/10 Major FEMA zone X (unshaded) · 74% chance over 30 yrs
- Wildfire 8/10 Severe
- Heat 4/10 Moderate 2 d/yr ≥92°F today · 6 d/yr by 30 yrs out
- Wind 1/10 Low
- Air quality 3/10 Moderate 2 unhealthy d/yr today · 3 by 30 yrs out
Nearby sold comps map
Loading sold comps map…
Walkable amenities ~0.75 mi
Loading nearby amenities…
Taxation est. · year 1
- Rental income
- $24,673
- − Mortgage interest
- −$5,518
- − Property taxes
- −$1,478
- − Insurance
- −$492
- − Repairs & maintenance
- −$1,974
- − Management
- −$1,974
- − HOA
- −$10,320
- − Depreciation
- −$2,865
- Taxable income
- $52
- Est. tax owed @ 24.0%
- −$13
- After-tax cash flow
- $991/yr
For passive investors: Depreciation is non-cash, so a rental often shows a tax loss while cash-flowing — sheltering income. Rental losses are passive: they offset passive income freely, and up to $25,000/yr can offset ordinary (W-2) income if you actively participate and your MAGI is under $100k (phasing out to $0 by $150k); unused losses carry forward. On sale, claimed depreciation is recaptured at up to 25%, and gains may owe capital-gains tax (a 1031 exchange can defer both). Figures are a year-1 estimate at your 24.0% rate — not tax advice; consult a CPA.
Condition & rehab AI · 1 photo
This manufactured home requires extensive repairs and maintenance, including major work on the exterior siding and roof, as well as landscaping. Significant updates are needed to raise its resale and rental value.
Repairs flagged
- Major exterior siding — Significant wear and tear
- Major roof — No visible damage, but photos don't show
- Major landscaping — Overgrown grass
Value-add opportunities
- Resale repair and paint exterior — Enhances curb appeal and home's overall appearance
- Resale repair roof — Fixes major structural issue
- Both landscaping — Improves curb appeal and enhances property value
Renovation cost estimate screening
| Repair item | Severity | Est. cost |
|---|---|---|
| exterior siding · Significant wear and tear | Major | $15,000–50,000 |
| roof · No visible damage, but photos don't show | Major | $15,000–50,000 |
| landscaping · Overgrown grass | Major | $15,000–50,000 |
| Total estimated repair cost · 3 items | $45,000–150,000 |
Value-add ROI direction
- Resale repair and paint exterior — Enhances curb appeal and home's overall appearance ↑
- Resale repair roof — Fixes major structural issue ↑
- Both landscaping — Improves curb appeal and enhances property value ↑
ⓘ Cost ranges are severity-bucket heuristics (US national rule-of-thumb). Get contractor quotes + a written scope before underwriting a rehab budget.
Schools (NCES district)
- District
- Tooele District
- NCES district ID
- 4901050
- Math proficiency
- 32% ▼ -8.00%
- Reading proficiency
- 34% ▼ -6.00%
- Median HH income
- $63,054
- Composite
- 29.94/100
- National rank
- #6379
- State rank
- #62 of 80 in UT
Livability — Tooele
- Score
- 77/100
- State rank
- #52
- US rank
- #3142
Category grades
Schools grade is shown separately in the Schools card above.
Census & demographics
- Census place
- Tooele, UT
- County
- Tooele County · 59,706 people
- City population
- 59,706
- Metro
- Salt Lake City, UT
- Population (ZIP)
- 59,706
- Household income
- $108,341
- Rent vs Own
- Severe rent burden
- 355.0
Population outlook (Tooele County) Hauer SSP2
- Today (2025)
- 73,901 people
- By 2030
- 79,080 · +7.0%
- By 2040
- 89,127 · +20.6%
- By 2050
- 98,460 · +33.2%
- By 2075
- 115,767 · +56.7%
- By 2100
- 122,453 · +65.7%
Race, ethnicity, and origin ACS 2023
- Neighborhood character
- Predominantly White (78%)
- Race & ethnicity
- White 78% Hispanic / Latino 14% Two or more races 9% Pacific Islander 1% Black 1%
- Hispanic origin (detail)
- Mexican 11%
- Common ancestry
- Italian 5% Slovak 4% Portuguese 2%
- Foreign-born
- 3% · Canada
- Languages at home
- 90% English-only · Spanish 7% Other Asian/Pacific 1% Other Indo-European 1%
Political lean MEDSL · Tooele
- 2024 margin
- Solid R (+41.0) · D 28.1% · R 69.1% · Other 2.8%
- 2008→2024 swing
- -11.2pp toward R · 2008: -29.8pp · 2024: -41.0pp
- All cycles
- 2024: R+41.0 2020: R+38.3 2016: R+30.0 2012: R+51.4 2008: R+29.8
Not yet ingested
- Civics
- —
Market trends
- HPI YoY
- ▼ -206.55%
- Current HPI
- 244.981
- Rent YoY
- ▲ 2.53%
- Metro
- Salt Lake City, UT
- State GDP YoY
- ▲ 3.54%
- F500 in state
- 2
Industry mix (Fortune 500 HQ in UT)
| Industry | F500 HQs | Revenue |
|---|---|---|
| Financial Services | 1 | $3B |
|
||
Price history
+23.1% since first listed7 events — show timeline
- 2026-05-28 Listed $98,500 WFRMLS
- 2025-06-25 Sold (MLS) — WFRMLS
- 2025-06-18 Pending — WFRMLS
- 2025-05-17 Listed $85,000 WFRMLS
- 2022-10-27 Sold (MLS) — WFRMLS
- 2022-07-25 Pending — WFRMLS
- 2022-07-18 Listed $80,000 WFRMLS
Cash-flow waterfall
monthlySold comps — $/sqft
last 12 mo · ≤1 miLoading sold comps…