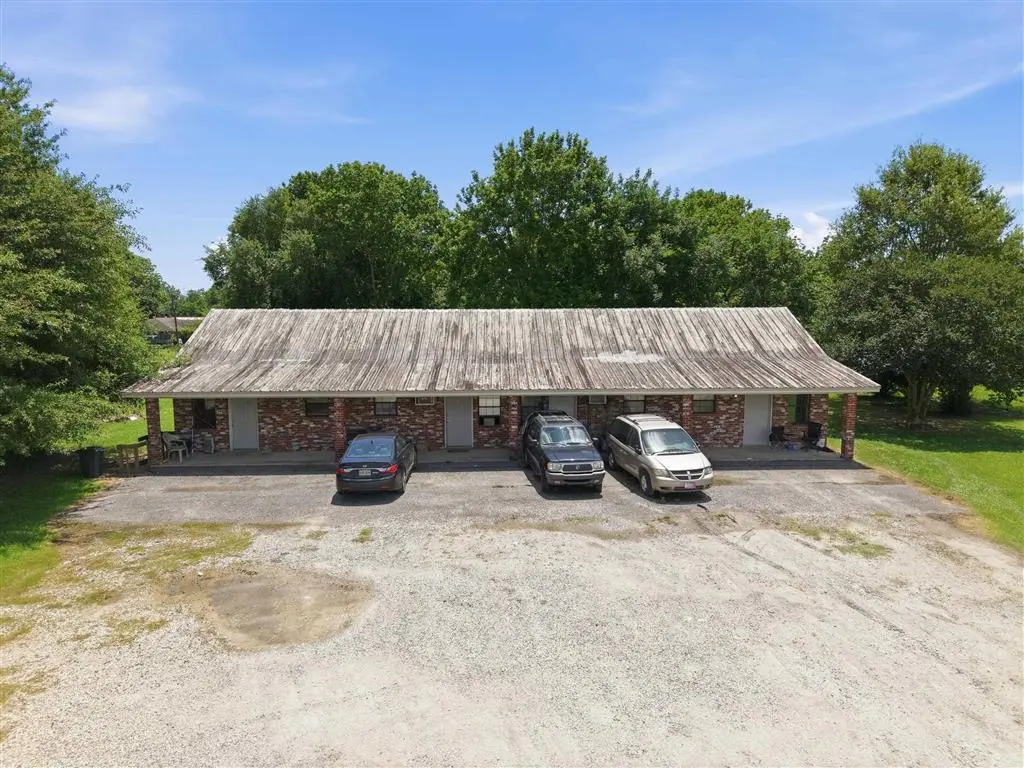
520 N 1st St N · Oberlin, LA
Flood risk No data
- FEMA flood zone
- —
- Chance of flooding over 30 yrs
- —
- Est. flood insurance / yr
- —
Fire risk No data
- Est. fire insurance / yr
- —
Heat risk No data
- Hot days now (above threshold)
- —
- Hot days in 30 yrs
- —
Wind risk No data
- Chance of severe wind over 30 yrs
- —
Air-quality risk No data
- Unhealthy air days now
- —
- Unhealthy air days in 30 yrs
- —
Risk factors via First Street. Map © Google.
Why this score? — see what drove the F grade
The composite is a weighted blend of 9 inputs, each scored 0–100. Each bar is that input's sub-score; the figure is the points it added to the 100-point composite (weight × sub-score).
- ARV discount +7.5/15.0
- Livability +3.0/5.0
- Schools +2.8/10.0
- Rent growth +2.5/5.0
- Condition / age +2.5/5.0
- Appreciation +2.0/10.0
- Cash flow +0.0/30.0
- 1% rule +0.0/10.0
- DSCR +0.0/10.0
$172,500
🖨 Deal sheet 📄 Offer letter ✓ Due diligence
Listing remarks MLS
* * Investment Opportunity: Charming 4-Plex with Steady Rental Income * * Welcome to a prime investment opportunity in real estate! This well-maintained brick 4-plex features four 1-bedroom, 1-bathroom units, each offering cozy, functional living spaces perfect for tenants seeking comfort and convenience. Classic brick facade, offering durability and timeless appeal. $2,000 per month in rental income, demonstrating strong demand and consistent revenue. Fully tenant-occupied, ensuring immediate cash flow for the new owner. Each unit boasts a thoughtful layout with spacious living areas, well-appointed kitchens, and comfortable bedrooms. The property is ideally situated in a desirable neighborhood, providing tenants with easy access to local amenities. Consistent rental history in a sought-after area This 4-plex offers an excellent opportunity for investors looking to expand their portfolio with a property that promises steady returns and long-term value. Don't miss out on this chance to acquire a well-maintained asset with reliable income potential! Property is cross listed. Age of property estimated. Measurements +/-.
Key facts
- Functional kitchens
- Built 1970
- Listed 7 days
Tags
Property features AI
Finance
- Other: Located at 520 N 1st St N, Oberlin, LA 70655; Directions: North on Hwy 165, left on 6th Avenue, right on 1st; property at the end of 1st before the curve; Listed by EXIT Bayou Realty; listing agent Jessica Landry
Exterior
- Utilities: Public water; Public sewer
- Home design: Residential income property configured as an apartment
- Exterior features: Corner lot; City lot; Irregular-shaped lot; Lot dimensions approximately 116 x 270 x 124 x 265; Approximately 0.56 acre lot
Interior
- Interior features: Single-story layout
Neighborhood map
What this means for you Summary
Snapshot
- This is a townhouse listed at $172k.
Deal economics
- At list price, monthly cash flow is $-1k ($-14k/yr) — negative.
- Rent doesn't cover operating costs at any purchase price — skip.
Location & tenants
- Location reads 60/100 on livability (#250 in LA) — a middle-class / working-renter tenant base. Strengths: cost of living A+, crime B; Watch: amenities F, commute F, employment F.
- Allen Parish (rural): math 26% / reading 42% proficiency, ranked #36 of 98 in LA (top 37%) — families likely to look elsewhere, expect single-tenant / working-renter base with shorter leases.
- Market conditions: 22 active listings in the ZIP; 46 units permitted in Allen Parish in 2024 (0 in 5+ unit buildings).
Forward outlook
- Local home prices are declining (-3.0%/yr); year-one equity from $1k of loan paydown is wiped out by about $5k of value loss. Plan a longer hold.
- Allen County population projected to shrink 8% by 2050 — rents likely to lag national; underwrite the cash flow, not the appreciation.
Negotiation context
- Only 7 days on market — expect competitive offers; lowballing is unlikely to land.
- 2 sale attempts since 2y ago with the ask held roughly flat each time — persistent listings suggest the price (not the market) is what's stuck; bring a comps-based counter.
Questions for the listing agent
- What do current leases actually rent for vs. the listed asking? Can we see a recent rent roll and the last 12 months of T-12 income?
- Built in 1970 — when were the roof, HVAC, electrical panel, plumbing, and water heater last replaced?
- Is there a deadline driving the sale (1031 exchange, divorce, estate, relocation)? That informs how much negotiation room exists.
- Schools are B-rated — typically a magnet for longer-tenancy family renters. What's the average tenant stay here, and is there a school-zone premium baked into asking?
- The area grade is low — what's the realistic commute time and amenity access for the typical tenant pool here? Any planned neighborhood developments (good or bad) we should know about?
- What's the average days-on-market for RENTAL listings here right now (not sales)? A rising rental-DOM trend means longer vacancies and softer asking-rent achievability than the comps imply.
- What's the recent tenant-quality profile in this submarket — average credit score on applications, eviction rate, late-payment / NSF rate, and stable-employment percentage? A property-management company in the area should have these aggregated.
- How much new for-sale + rental construction is in the pipeline within 1–3 miles? Heavy new supply typically softens prices + rents 12–24 months out; constrained supply supports both.
Investment metrics
- 1% rule
- 0.00% ✗
- Cap rate
- -2.00%
- Cash-on-cash
- -29.62%
- DSCR
- -0.32
- GRM
- 0.0
CMA / ARV
No comps found within radius.
Projected returns pro-forma
-3.0% appreciation · 3.0% rent growth · sell at horizon
- IRR
- -87.0%
- Equity multiple
- -1.15×
- Total profit
- $-103,878
- Equity at exit
- $25,720
- IRR
- —
- Equity multiple
- -2.90×
- Total profit
- $-188,222
- Equity at exit
- $14,915
Cash invested: $48,300 (down + closing). Projections, not guarantees.
Landlord ↔ Tenant lean methodology
- Overall (STATE)
- 90 Strongly Landlord-Friendly
- State Louisiana
- 90 Strongly Landlord-Friendly · R+12
- County
- — inherits STATE
- City
- — inherits STATE
ZIP-level market 70655
- Home prices YoY
- -6.2%
- Active inventory
- 22
Monthly cashflow live
- Estimated rent
- $0 none
- Mortgage (P&I)
- −$905
- Tax est. 1.5%
- −$216 /mo · $2,588/yr
- Insurance
- −$72
- HOA
- −$0
- Vacancy / Maint / Mgmt
- −$0
- Net cashflow
- $-1,192
Break-even live
UW: 25.0% down · 7.5% · 30yr · 1.5% tax · 5.0% vac · 8.0% maint · 8.0% mgmt
Financing live
Cash to close
- Down payment
- $43,125
- Closing costs
- $5,175
- Reserves months
- —
- Total cash needed
- —
Loan-product check · same deal, 3 products live
Conventional
25% down · 7.5% · 30yr
- Down + closing
- —
- Monthly P&I
- —
- Monthly cashflow
- —
- DSCR
- —
- Eligible?
- —
Personal DTI + credit; lowest rate.
DSCR
20% down · 8.5% · 30yr
- Down + closing
- —
- Monthly P&I
- —
- Monthly cashflow
- —
- DSCR
- —
- Eligible?
- —
No personal income docs; deal must DSCR.
Hard money
10% down · 12.0% · 12mo
- Down + closing
- —
- Monthly P&I
- —
- Monthly cashflow
- —
- DSCR
- —
- Eligible?
- —
Short-term bridge; refi at stabilization.
Listing history 7 events
-
2026-06-18days on market $172,500 Active 7 DOM
-
2026-06-17days on market $172,500 Active 6 DOM
-
2026-06-16days on market $172,500 Active 5 DOM
-
2026-06-15days on market $172,500 Active 4 DOM
-
2026-06-13days on market $172,500 Active 2 DOM
-
2026-06-12remarks 699-char remark
-
2026-06-12$172,500 Active 1 DOM
ⓘ Source: listings_history table (triggers on properties + properties_extension) + one-shot
backfill from property_details.listing_events for pre-trigger history.
Nearby sold comps map
Loading sold comps map…
Walkable amenities ~0.75 mi
Loading nearby amenities…
Taxation est. · year 1
- Rental income
- $0
- − Mortgage interest
- −$9,663
- − Property taxes
- −$2,588
- − Insurance
- −$862
- − Repairs & maintenance
- −$0
- − Management
- −$0
- − Depreciation
- −$5,018
- Taxable loss
- −$18,131
- Est. tax savings @ 24.0%
- +$4,351
- After-tax cash flow
- $-9,954/yr
For passive investors: Depreciation is non-cash, so a rental often shows a tax loss while cash-flowing — sheltering income. Rental losses are passive: they offset passive income freely, and up to $25,000/yr can offset ordinary (W-2) income if you actively participate and your MAGI is under $100k (phasing out to $0 by $150k); unused losses carry forward. On sale, claimed depreciation is recaptured at up to 25%, and gains may owe capital-gains tax (a 1031 exchange can defer both). Figures are a year-1 estimate at your 24.0% rate — not tax advice; consult a CPA.
Schools (NCES district)
- District
- Allen Parish
- NCES district ID
- 2200060
- Math proficiency
- 26% ▼ -46.00%
- Reading proficiency
- 42% ▼ -39.00%
- Median HH income
- $39,440
- Composite
- 28.45/100
- National rank
- #6751
- State rank
- #36 of 98 in LA
Livability — Oberlin
- Score
- 60/100
- State rank
- #250
- US rank
- #18808
Category grades
Schools grade is shown separately in the Schools card above.
Census & demographics
- Census place
- Oberlin, LA
- Population (ZIP)
- 2,892
Population outlook (Allen County) Hauer SSP2
- Today (2025)
- 25,056 people
- By 2030
- 24,668 · -1.5%
- By 2040
- 23,964 · -4.4%
- By 2050
- 23,166 · -7.5%
- By 2075
- 21,285 · -15.1%
- By 2100
- 15,904 · -36.5%
Race, ethnicity, and origin ACS 2023
- Neighborhood character
- Predominantly White (67%)
- Race & ethnicity
- White 67% Black 30% Hispanic / Latino 2%
- Common ancestry
- Lithuanian 17%
- Foreign-born
- 2% · Canada
- Languages at home
- 88% English-only · French/Haitian/Cajun 9% Spanish 3%
Political lean MEDSL · Allen
- 2024 margin
- Solid R (+61.0) · D 19.0% · R 80.0%
- 2008→2024 swing
- -24.7pp toward R · 2008: -36.4pp · 2024: -61.0pp
- All cycles
- 2024: R+61.0 2020: R+55.7 2016: R+51.5 2012: R+41.7 2008: R+36.4
Not yet ingested
- Civics
- —
Market trends
- HPI YoY
- ▼ -5.92%
- Current HPI
- 90.2641
- Rent YoY
- —
- Metro
- —
- State GDP YoY
- ▲ 3.29%
- F500 in state
- 10
Industry mix (Fortune 500 HQ in LA)
| Industry | F500 HQs | Revenue |
|---|---|---|
| Telecommunications | 2 | $23B |
|
||
| Utilities | 1 | $12B |
|
||
| Wholesale / Distribution | 1 | $5B |
|
||
| Advertising | 1 | $2B |
|
||
Price history
+7.8% since first listed3 events — show timeline
- 2026-06-11 Listed $172,500 SWLAR
- 2025-02-07 Sold (MLS) — SWLAR
- 2024-08-13 Listed $160,000 SWLAR
Cash-flow waterfall
monthlySold comps — $/sqft
last 12 mo · ≤1 miLoading sold comps…