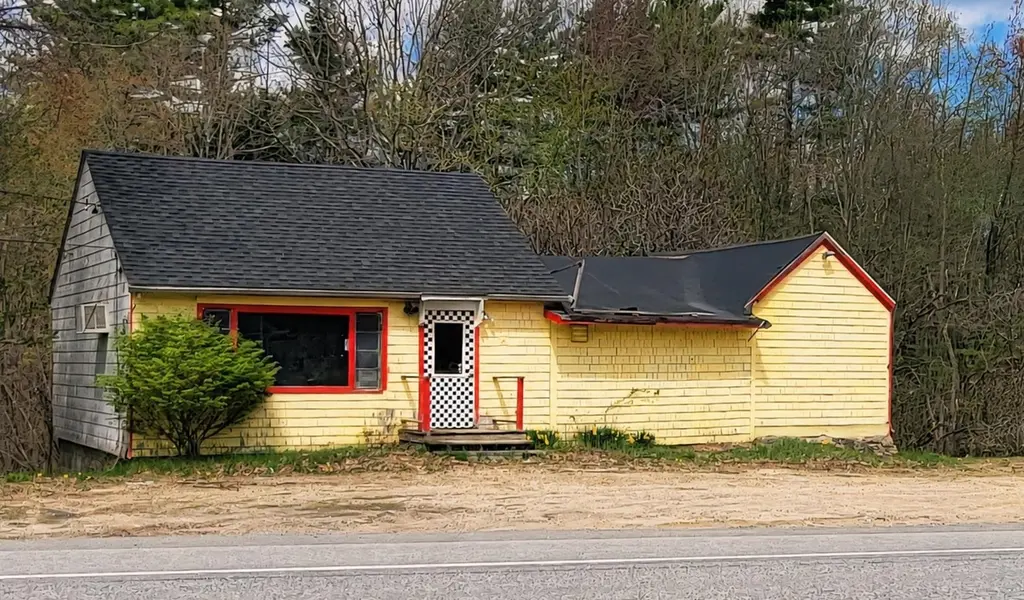
330 NH Route 125 · Brentwood, NH
Flood risk No data
- FEMA flood zone
- —
- Chance of flooding over 30 yrs
- —
- Est. flood insurance / yr
- —
Fire risk No data
- Est. fire insurance / yr
- —
Heat risk No data
- Hot days now (above threshold)
- —
- Hot days in 30 yrs
- —
Wind risk No data
- Chance of severe wind over 30 yrs
- —
Air-quality risk No data
- Unhealthy air days now
- —
- Unhealthy air days in 30 yrs
- —
Risk factors via First Street. Map © Google.
Why this score? — see what drove the C grade
The composite is a weighted blend of 9 inputs, each scored 0–100. Each bar is that input's sub-score; the figure is the points it added to the 100-point composite (weight × sub-score).
- Cash flow +24.1/30.0
- DSCR +7.8/10.0
- ARV discount +7.5/15.0
- Schools +6.6/10.0
- 1% rule +6.3/10.0
- Rent growth +2.5/5.0
- Livability +2.5/5.0
- Condition / age +2.5/5.0
- Appreciation +0.0/10.0
$259,900
🖨 Deal sheet 📄 Offer letter ✓ Due diligence
Listing remarks
Rare Live/Work Opportunity with Conversion Potential in Brentwood! Discover this unique opportunity to create a one-of-a-kind live/work space on high traffic Route 125. This versatile property offers the perfect blend of commercial functionality and residential potential, ideal for entrepreneurs, creatives, investors, or developers seeking a flexible space with long-term upside. This property lends itself to a variety of uses including studio space, office/showroom combinations, boutique retail, and more with potential for upstairs residence, or mixed-use redevelopment. The convenient location places you close to local dining, shopping, commuting, and neighborhood amenities. With on-site pa
Key facts
- Conversion potential
- Studio space
- 1.7 acre lot
Tags
Property features AI
Finance
- Other: Sale includes land and building
Exterior
- Parking: Dirt driveway
- Utilities: Private well water; Private sewer; Electric service: Other; Internet availability unknown; Other utilities (unspecified)
- Home design: Cape-style home; Existing construction; Facing direction not listed; Entry level not listed; One or more stories not specified
- Construction: Built in 1948; Wood frame construction with wood exterior; Asphalt shingle roof
- Exterior features: Major road frontage; Sloping lot; On or near a stream; Wooded setting; Near shopping; Dirt driveway; Public road frontage (approximately 150 feet)
Interior
- Bathrooms: One full bathroom
- Heating & cooling: Other heating
- Interior features: Four total rooms; Unfinished basement with concrete and dirt floors, interior stairs, exterior/walkout access
Neighborhood map
What this means for you Summary
Snapshot
- This is a 2-bed/1.0-bath single-family listed at $260k.
Deal economics
- At list price, monthly cash flow is $514 ($6k/yr) — positive.
- The deal already cash-flows at list — no discount required.
- Meets the 1% rule at list price ($3k rent vs $260k).
- Recommended offer: $252k (3.0% below list) — sets the bar for market timing.
Location & tenants
- Location reads: area grade C — affects rentability + tenant quality, not the cash-flow math above.
- Brentwood School District (rural): math 65% / reading 75% proficiency, ranked #18 of 171 in NH (top 10%) — strong family-tenant draw, lease renewals of 3-5y typical; only 4% free/reduced lunch — higher-income household profile.
- Market conditions: 142 active listings in the ZIP; 2 comparable units currently listed for rent nearby; high-income renter base; 1,276 units permitted in Rockingham County in 2024 (593 in 5+ unit buildings).
Forward outlook
- Local home prices are declining (-3.0%/yr); year-one equity from $2k of loan paydown is wiped out by about $8k of value loss. Plan a longer hold.
Negotiation context
- It's been on market 34 days — a 3% lower offer ($252k) is reasonable based on typical stale-listing flexibility.
- Current owner paid $200k; 30% above their basis — modest negotiation headroom, anchor on the comps not their cost.
Risks & watch-outs
- Watch-outs: built in 1948 — expect roof / HVAC / electrical / plumbing capex.
Questions for the listing agent
- It's been on market 34 days. Have you received any prior offers? Is the seller open to a 3% concession, seller financing, or rate buy-down credit?
- Built in 1948 — when were the roof, HVAC, electrical panel, plumbing, and water heater last replaced?
- Is there a deadline driving the sale (1031 exchange, divorce, estate, relocation)? That informs how much negotiation room exists.
- What's the average days-on-market for RENTAL listings here right now (not sales)? A rising rental-DOM trend means longer vacancies and softer asking-rent achievability than the comps imply.
- What's the recent tenant-quality profile in this submarket — average credit score on applications, eviction rate, late-payment / NSF rate, and stable-employment percentage? A property-management company in the area should have these aggregated.
- How much new for-sale + rental construction is in the pipeline within 1–3 miles? Heavy new supply typically softens prices + rents 12–24 months out; constrained supply supports both.
Investment metrics
- 1% rule
- 1.13% ✓
- Cap rate
- 8.67%
- Cash-on-cash
- 8.48%
- DSCR
- 1.38
- GRM
- 7.4
CMA / ARV
- ARV (on-the-fly)
- $561,000
- Comps found
- 1
Show comp detail 1 sale within ~0.75 mi
| Address | Dist | Beds/Ba | Sqft | Sold | Price | $/sf | Match |
|---|---|---|---|---|---|---|---|
| 119 Scrabble Rd | 0.40mi | 2/1.0 | 960 (-13%) | 3mo | $490,000 | $510 | 57 |
Match score weights: distance 35% · size 25% · config 20% · recency 20%. Top-matched comps best support the ARV.
Projected returns pro-forma
-3.0% appreciation · 3.0% rent growth · sell at horizon
- IRR
- -3.4%
- Equity multiple
- 0.87×
- Total profit
- $-9,309
- Equity at exit
- $38,752
- IRR
- 6.3%
- Equity multiple
- 1.47×
- Total profit
- $34,260
- Equity at exit
- $22,471
Cash invested: $72,772 (down + closing). Projections, not guarantees.
Landlord ↔ Tenant lean methodology
- Overall (STATE)
- 56 Moderately Landlord-Leaning
- State New Hampshire
- 56 Moderately Landlord-Leaning · D+1
- County
- — inherits STATE
- City
- — inherits STATE
ZIP-level market 03833
- Active inventory
- 142
- Price-to-rent
- 7.4×
Monthly cashflow live
- Estimated rent
- $2,925 medium interval (Pro) →
- Mortgage (P&I)
- −$1,363
- Tax est. 1.5%
- −$325 /mo · $3,898/yr
- Insurance
- −$108
- HOA
- −$0
- Vacancy / Maint / Mgmt
- −$614
- Net cashflow
- $514
Break-even live
UW: 25.0% down · 7.5% · 30yr · 1.5% tax · 5.0% vac · 8.0% maint · 8.0% mgmt
Financing live
Cash to close
- Down payment
- $64,975
- Closing costs
- $7,797
- Reserves months
- —
- Total cash needed
- —
Loan-product check · same deal, 3 products live
Conventional
25% down · 7.5% · 30yr
- Down + closing
- —
- Monthly P&I
- —
- Monthly cashflow
- —
- DSCR
- —
- Eligible?
- —
Personal DTI + credit; lowest rate.
DSCR
20% down · 8.5% · 30yr
- Down + closing
- —
- Monthly P&I
- —
- Monthly cashflow
- —
- DSCR
- —
- Eligible?
- —
No personal income docs; deal must DSCR.
Hard money
10% down · 12.0% · 12mo
- Down + closing
- —
- Monthly P&I
- —
- Monthly cashflow
- —
- DSCR
- —
- Eligible?
- —
Short-term bridge; refi at stabilization.
Rent comps 2 comps
| Address | Beds | Baths | Sqft | Rent | $/sqft | DOM | Units | Dist |
|---|---|---|---|---|---|---|---|---|
| 318 Route 125 Brentwood, NH | 2.0 | 1.0 | 1260 | $3,500 | $2.78 | 2d | 1 | 0.14mi |
| 374 NH-125 Brentwood, NH | 1.0 | 1.0 | 1230 | $3,500 | $2.85 | 1d | 1 | 0.40mi |
Listing history 16 events
-
2026-06-18days on market $259,900 Active 34 DOM
-
2026-06-17days on market $259,900 Active 33 DOM
-
2026-06-16days on market $259,900 Active 32 DOM
-
2026-06-15days on market $259,900 Active 31 DOM
-
2026-06-13days on market $259,900 Active 29 DOM
-
2026-06-13days on market $259,900 Active 28 DOM
-
2026-06-09days on market $259,900 Active 25 DOM
-
2026-06-08days on market $259,900 Active 24 DOM
-
2026-06-07days on market $259,900 Active 23 DOM
-
2026-06-04days on market $259,900 Active 20 DOM
-
2026-06-03days on market $259,900 Active 19 DOM
-
2026-06-02days on market $259,900 Active 18 DOM
-
2026-06-01days on market $259,900 Active 17 DOM
-
2026-05-31days on market $259,900 Active 16 DOM
-
2026-05-15$259,900 Active
-
2005-09-02soldstatus $200,000
ⓘ Source: listings_history table (triggers on properties + properties_extension) + one-shot
backfill from property_details.listing_events for pre-trigger history.
Nearby sold comps map
Loading sold comps map…
Walkable amenities ~0.75 mi
Loading nearby amenities…
Taxation est. · year 1
- Rental income
- $35,096
- − Mortgage interest
- −$14,558
- − Property taxes
- −$3,898
- − Insurance
- −$1,300
- − Repairs & maintenance
- −$2,808
- − Management
- −$2,808
- − Depreciation
- −$7,561
- Taxable income
- $2,164
- Est. tax owed @ 24.0%
- −$519
- After-tax cash flow
- $5,653/yr
For passive investors: Depreciation is non-cash, so a rental often shows a tax loss while cash-flowing — sheltering income. Rental losses are passive: they offset passive income freely, and up to $25,000/yr can offset ordinary (W-2) income if you actively participate and your MAGI is under $100k (phasing out to $0 by $150k); unused losses carry forward. On sale, claimed depreciation is recaptured at up to 25%, and gains may owe capital-gains tax (a 1031 exchange can defer both). Figures are a year-1 estimate at your 24.0% rate — not tax advice; consult a CPA.
Schools (NCES district)
- District
- Brentwood School District
- NCES district ID
- 3302010
- Math proficiency
- 65% ▬ 0.00%
- Reading proficiency
- 75% ▲ 5.00%
- Median HH income
- $102,873
- Composite
- 65.59/100
- National rank
- #1012
- State rank
- #18 of 171 in NH
Livability — Brentwood
No livability data for this city. (Only ~50 U.S. cities are tracked.)
Census & demographics
- County
- Rockingham County · 137,526 people
- Metro
- Boston-Cambridge-Newton, MA-NH
- Population (ZIP)
- 22,817
- Household income
- $119,393
- Rent vs Own
- Severe rent burden
- 485.0
Population outlook (Rockingham County) Hauer SSP2
- Today (2025)
- 316,118 people
- By 2030
- 320,929 · +1.5%
- By 2040
- 323,358 · +2.3%
- By 2050
- 314,977 · -0.4%
- By 2075
- 297,686 · -5.8%
- By 2100
- 256,363 · -18.9%
Race, ethnicity, and origin ACS 2023
- Neighborhood character
- Predominantly White (91%)
- Race & ethnicity
- White 91% Two or more races 4% Asian 3% Hispanic / Latino 2%
- Common ancestry
- Lithuanian 8% Slovak 5% Romanian 5%
- Foreign-born
- 6% · Canada, China, South Korea
- Languages at home
- 93% English-only · Spanish 2% Other Indo-European 1% German/W. Germanic 1%
Political lean MEDSL · Rockingham
- 2024 margin
- Toss-up / Even · D 48.3% · R 50.8%
- 2008→2024 swing
- -3.5pp toward R · 2008: 1.1pp · 2024: -2.4pp
- All cycles
- 2024: R+2.4 2020: D+2.1 2016: R+5.8 2012: R+4.5 2008: D+1.1
Not yet ingested
- Civics
- —
Market trends
- HPI YoY
- ▼ -202.07%
- Current HPI
- 288.0139
- Rent YoY
- —
- Metro
- Boston-Cambridge-Newton, MA-NH
- State GDP YoY
- —
- F500 in state
- 0
Price history
+29.9% since first listed2 events — show timeline
- 2026-05-15 Listed $259,900 PrimeMLS
- 2005-09-02 Sold (Public Records) $200,000 Public Records
Cash-flow waterfall
monthlySold comps — $/sqft
last 12 mo · ≤1 miLoading sold comps…