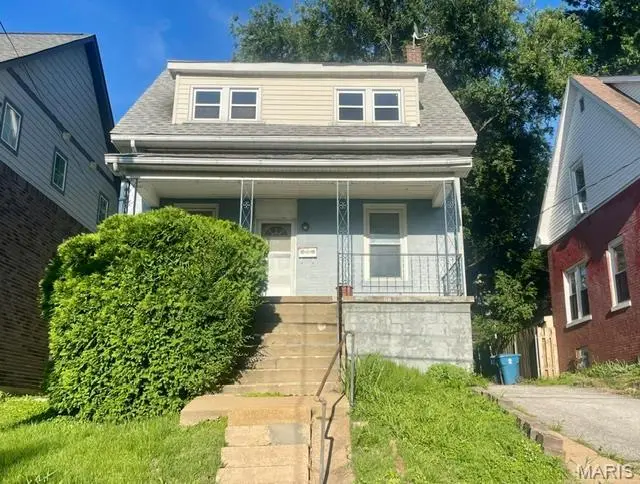
2622 Lyle Ave · Maplewood, MO
Flood risk 1/10 · Minimal
- FEMA flood zone
- X (unshaded)
- Chance of flooding over 30 yrs
- 0.0%
- Est. flood insurance / yr
- $473 – $860
Fire risk 1/10 · Minimal
- Est. fire insurance / yr
- $1,054 – $1,958
Heat risk 5/10 · Moderate
- Hot days now (above 107°F)
- 7 days/yr
- Hot days in 30 yrs
- 21 days/yr
Wind risk 2/10 · Minimal
- Chance of severe wind over 30 yrs
- 1.0%
Air-quality risk 3/10 · Minor
- Unhealthy air days now
- 3 days/yr
- Unhealthy air days in 30 yrs
- 4 days/yr
Risk factors via First Street. Map © Google.
Why this score? — see what drove the D+ grade
The composite is a weighted blend of 9 inputs, each scored 0–100. Each bar is that input's sub-score; the figure is the points it added to the 100-point composite (weight × sub-score).
- ARV discount +15.0/15.0
- Cash flow +12.8/30.0
- Livability +4.2/5.0
- Schools +4.1/10.0
- DSCR +3.8/10.0
- 1% rule +3.7/10.0
- Rent growth +3.4/5.0
- Condition / age +2.5/5.0
- Appreciation +0.0/10.0
$169,900
🖨 Deal sheet (PDF) 📄 Offer letter ✓ Due diligence
Listing remarks
FIXER UPPER WITH GREAT POTENTIAL! Opportunity knocks in a prime Maplewood location! This 2-bedroom, 1-bath home is a true fixer-upper with endless potential—perfect for investors, rehabbers or anyone looking to create their dream home. Updates include newer carpeting, newer luxury vinyl flooring in kitchen and dining room and new stainless smooth top easy-to-clean electric range. Just steps from downtown Maplewood, you can stroll to shops, restaurants, breweries and all the charm this vibrant community offers. The home needs work but could be a real gem with the right vision and updates. Don’t miss your chance to get into this sought-after area at an affordable price. Property
Key facts
- 3,001 sq ft lot
- Built 1912
- Listed 16 days
Property features AI
Finance
- Financial info: Lease not considered; No second mortgage reported; Seller may consider concessions
Exterior
- Parking: Driveway; Off-street parking
- Utilities: Public water; Public sewer; Ameren electric; Cable available; Electricity connected; Natural gas connected; Water connected; Sewer connected
- Home design: Single family residence; Two levels; Private ownership; Property listed as a fixer
- Construction: Brick construction; Architectural shingle roof; House structure type
- Exterior features: Covered rear porch; Private yard; Partial fencing; Back yard; Near public transit
Interior
- Kitchen: Electric range
- Bedrooms: 2 bedrooms (both on the upper level)
- Bathrooms: 1 full bathroom (on main/upper level)
- Heating & cooling: Forced air heating (natural gas); Central air conditioning with electric power; Ceiling fan(s)
- Interior features: Ceiling fans; High ceilings; Laminate counters; Full basement with interior entry, unfinished storage space and walk-up access
- Laundry & utility: Laundry in basement
Neighborhood map
What this means for you Summary
Snapshot
- This is a 2-bed/1.0-bath single-family listed at $170k.
Deal economics
- At list price, monthly cash flow is $-17 ($-199/yr) — negative.
- To cash-flow at today's rent, offer at most $167k (1.7% below list).
- To meet the 1% rule (rent ≥ 1% of price), the offer needs to be $148k (12.7% below list).
- Recommended offer: $148k (12.7% below list) — sets the bar for 1% rule.
- Cap rate 6.2% vs local median 3.8% in Maplewood — top-decile yield for the area; either an underpriced asset or a hidden risk that comps aren't pricing in. Stress-test before assuming the spread holds.
Location & tenants
- Location reads 84/100 on livability (#5 in MO, #673 nationally) — a professional / high-income tenant draw. Strengths: amenities A+, commute A+, cost of living A+; Watch: crime F.
- Maplewood-Richmond Heights (suburban): math 40% / reading 56% proficiency, ranked #63 of 324 in MO (top 19%) — families likely to look elsewhere, expect single-tenant / working-renter base with shorter leases.
- Zoned schools: Mrh Elementary (math 40% / reading 57%, grade D, #334 of 1,115 statewide, top 30%, 417 students, 26% FRL); Mrh Middle (math 30% / reading 51%, grade F, #180 of 391 statewide, top 47%, 220 students, 31% FRL); Maplewood-Richmond Hgts. High (math 62% / reading 67%, grade B-, #19 of 521 statewide, top 4%, 413 students, 32% FRL).
- Market conditions: Rents rising (+3.8%/yr); 44 active listings in the ZIP; 40 comparable units currently listed for rent nearby; rentals at typical pace (median 21d on market — plan ~3-4 weeks tenant-placement turnaround); 920 units permitted in St. Louis County in 2024 (250 in 5+ unit buildings).
Forward outlook
- Local home prices are declining (-3.0%/yr); year-one equity from $1k of loan paydown is wiped out by about $5k of value loss. Plan a longer hold.
Negotiation context
- It's been on market 16 days — a 2% lower offer ($167k) is reasonable based on typical stale-listing flexibility.
- 2 sale attempts with the ask held roughly flat each time — persistent listings suggest the price (not the market) is what's stuck; bring a comps-based counter.
- Current owner paid $95k; list at $170k implies a 79% gain — meaningful room to come down on a strong offer.
Risks & watch-outs
- Watch-outs: built in 1912 — expect roof / HVAC / electrical / plumbing capex.
- Climate carrying-cost: extreme-heat days projected 7→21/yr by 2055 (HVAC capex compounding) — expect insurance premiums to compound above CPI over the hold.
Questions for the listing agent
- What do current leases actually rent for vs. the listed asking? Can we see a recent rent roll and the last 12 months of T-12 income?
- Built in 1912 — when were the roof, HVAC, electrical panel, plumbing, and water heater last replaced?
- Is there a deadline driving the sale (1031 exchange, divorce, estate, relocation)? That informs how much negotiation room exists.
- Schools are A-rated — typically a magnet for longer-tenancy family renters. What's the average tenant stay here, and is there a school-zone premium baked into asking?
- Crime grade is F in this area — have there been break-ins, vandalism, or insurance claims at this property in the last 3 years? What carrier currently insures it and at what premium?
- The area grade is low — what's the realistic commute time and amenity access for the typical tenant pool here? Any planned neighborhood developments (good or bad) we should know about?
- What's the average days-on-market for RENTAL listings here right now (not sales)? A rising rental-DOM trend means longer vacancies and softer asking-rent achievability than the comps imply.
- What's the recent tenant-quality profile in this submarket — average credit score on applications, eviction rate, late-payment / NSF rate, and stable-employment percentage? A property-management company in the area should have these aggregated.
- How much new for-sale + rental construction is in the pipeline within 1–3 miles? Heavy new supply typically softens prices + rents 12–24 months out; constrained supply supports both.
Investment metrics
- 1% rule
- 0.87% ✗
- Cap rate
- 6.18%
- Cash-on-cash
- -0.42%
- DSCR
- 0.98
- GRM
- 9.6
CMA / ARV
- ARV (on-the-fly)
- $250,068
- Comps found
- 12
Show comp detail 12 sales within ~0.75 mi
| Address | Dist | Beds/Ba | Sqft | Sold | Price | $/sf | Match |
|---|---|---|---|---|---|---|---|
| 2623 Margarette Ave | 0.03mi | 3/2.0 (+1) | 1,075 (-2%) | 1mo | $290,000 | $270 | 87 |
| 7533 Woodland Ave | 0.27mi | 2/1.0 | 1,088 (-0%) | 1mo | $249,900 | $230 | 86 |
| 2510 Oakland Ave | 0.25mi | 2/1.5 | 1,174 (+8%) | 0mo | $269,000 | $229 | 74 |
| 7740 Jerome Ave | 0.43mi | 3/1.5 (+1) | 1,100 (+1%) | 2mo | $245,000 | $223 | 70 |
| 7425 Gayola Pl | 0.28mi | 2/2.0 | 1,003 (-8%) | 2mo | $329,900 | $329 | 67 |
| 7659 Folk Ave | 0.47mi | 2/1.0 | 1,026 (-6%) | 2mo | $210,000 | $205 | 67 |
| 3712 Cambridge Ave | 0.75mi | 2/1.0 | 1,032 (-6%) | 1mo | $209,900 | $203 | 55 |
| 2812 Laclede Station Rd | 0.42mi | 2/2.0 | 960 (-12%) | 1mo | $184,900 | $193 | 55 |
| 7250 Arsenal St | 0.49mi | 2/1.0 | 952 (-13%) | 3mo | $245,000 | $257 | 53 |
| 7461 Rupert Ave | 0.52mi | 2/1.0 | 954 (-13%) | 2mo | $250,000 | $262 | 53 |
| 7109 Canterbury Ave | 0.63mi | 3/2.5 (+1) | 1,200 (+10%) | 1mo | $125,000 | $104 | 42 |
| 2159 Mccausland Ave | 0.73mi | 3/1.0 (+1) | 1,215 (+11%) | 2mo | $250,000 | $206 | 41 |
Match score weights: distance 35% · size 25% · config 20% · recency 20%. Top-matched comps best support the ARV.
Projected returns pro-forma
-3.0% appreciation · 3.76% rent growth · sell at horizon
- IRR
- -16.1%
- Equity multiple
- 0.42×
- Total profit
- $-27,414
- Equity at exit
- $25,333
- IRR
- -6.4%
- Equity multiple
- 0.57×
- Total profit
- $-20,346
- Equity at exit
- $14,690
Cash invested: $47,572 (down + closing). Projections, not guarantees.
Landlord ↔ Tenant lean methodology
- Overall (STATE)
- 81 Strongly Landlord-Friendly
- State Missouri
- 81 Strongly Landlord-Friendly · R+10
- County
- — inherits STATE
- City
- — inherits STATE
ZIP-level market 63143
- Rents YoY
- 3.8%
- Active inventory
- 44
- Price-to-rent
- 9.6×
Monthly cashflow live
- Estimated rent
- $1,482 high interval (Pro) →
- Mortgage (P&I)
- −$891
- Tax from tax record
- −$226 /mo · $2,711/yr
- Insurance
- −$71
- HOA
- −$0
- Vacancy / Maint / Mgmt
- −$311
- Net cashflow
- $-17
Break-even live
Sensitivity live
| Price | -10% $80 | -5% $32 | +0% $-17 | +5% $-65 | +10% $-113 |
|---|---|---|---|---|---|
| Rent | -10% $-134 | -5% $-75 | +0% $-17 | +5% $42 | +10% $101 |
| Rate | -1.0pp $69 | -0.5pp $27 | base $-17 | +0.5pp $-61 | +1.0pp $-105 |
UW: 25.0% down · 7.5% · 30yr · 1.5% tax · 5.0% vac · 8.0% maint · 8.0% mgmt
Financing live
Cash to close
- Down payment
- $42,475
- Closing costs
- $5,097
- Reserves months
- —
- Total cash needed
- —
Loan-product check · same deal, 3 products live
Conventional
25% down · 7.5% · 30yr
- Down + closing
- —
- Monthly P&I
- —
- Monthly cashflow
- —
- DSCR
- —
- Eligible?
- —
Personal DTI + credit; lowest rate.
DSCR
20% down · 8.5% · 30yr
- Down + closing
- —
- Monthly P&I
- —
- Monthly cashflow
- —
- DSCR
- —
- Eligible?
- —
No personal income docs; deal must DSCR.
Hard money
10% down · 12.0% · 12mo
- Down + closing
- —
- Monthly P&I
- —
- Monthly cashflow
- —
- DSCR
- —
- Eligible?
- —
Short-term bridge; refi at stabilization.
Rent comps 40 comps
| Address | Beds | Baths | Sqft | Rent | $/sqft | DOM | Units | Dist |
|---|---|---|---|---|---|---|---|---|
| 7349 Myrtle Ave Apt 1W Maplewood, MO | 2.0 | 1.0 | 1220 | $1,895 | $1.55 | 6d | 1 | 0.24mi |
| 2624 Roseland Ter Saint Louis, MO | 2.0 | 1.0 | 750 | $1,045 | $1.39 | 4d | 2 | 0.28mi |
| 2311 S Big Bend Blvd Saint Louis, MO | 2.0 | 1.5 | 1298 | $1,599 | $1.23 | 45d | 1 | 0.34mi |
| 2628 Hope Ave Unit 2628-D St. Louis, MO | 1.0 | 1.0 | 750 | $850 | $1.13 | 25d | 1 | 0.35mi |
| 7210 Lyndover Pl Unit 3E Maplewood, MO | 2.0 | 1.0 | 800 | $1,250 | $1.56 | 9d | 1 | 0.37mi |
| 7208 Zephyr Pl Unit 3W Maplewood, MO | 1.0 | 1.0 | 900 | $1,099 | $1.22 | 19d | 1 | 0.40mi |
| 7208 Zephyr Pl Apt 1E Maplewood, MO | 2.0 | 1.0 | 1100 | $1,199 | $1.09 | 45d | 1 | 0.40mi |
| 2507 Bellevue Ave Unit 2509 5 Maplewood, MO | 1.0 | 1.0 | 700 | $1,130 | $1.61 | 23d | 1 | 0.40mi |
| 2507 Bellevue Ave Unit 2507 1 Maplewood, MO | 2.0 | 1.0 | 800 | $1,245 | $1.56 | 45d | 1 | 0.40mi |
| 2507 Bellevue Ave Unit 2507 5 Maplewood, MO | 1.0 | 1.0 | 700 | $1,130 | $1.61 | 6d | 1 | 0.40mi |
| 2705 Laclede Station Rd Maplewood, MO | 2.0 | 1.5 | 840 | $1,499 | $1.78 | 6d | 1 | 0.44mi |
| 7560 Alicia Ave Saint Louis, MO | 2.0 | 1.0 | 960 | $1,650 | $1.72 | 45d | 1 | 0.46mi |
| 2262 Yale Ave Saint Louis, MO | 2.0 | 1.0 | 900 | $2,700 | $3.00 | 16d | 1 | 0.49mi |
| 7135 Canterbury Ave Saint Louis, MO | 1.0–2.0 | 1.0–1.5 | 1016 | $2,155 | $2.12 | 21d | 4 | 0.54mi |
| 7403 Commonwealth Ave Saint Louis, MO | 3.0 | 2.0 | 1444 | $2,500 | $1.73 | 0d | 1 | 0.55mi |
| 7135 Canterbury Ave Unit 109 St. Louis, MO | 1.0 | 1.0 | 1173 | $1,915 | $1.63 | 0d | 1 | 0.55mi |
| 7828 Laclede Forest Dr Maplewood, MO | 1.0–2.0 | 1.0 | 725 | $1,345 | $1.86 | 5d | 2 | 0.55mi |
| 3246 S Big Bend Blvd Saint Louis, MO | 2.0 | 1.0 | 1132 | $1,700 | $1.50 | 45d | 1 | 0.60mi |
| 7784 W Bruno Ave Saint Louis, MO | 2.0 | 1.0 | 900 | $950 | $1.06 | 45d | 1 | 0.65mi |
| 31 Sunnen Dr Maplewood, MO | 1.0–2.0 | 1.0–2.0 | 956 | $2,428 | $2.54 | 0d | 17 | 0.67mi |
| 2050 Yale Ave Maplewood, MO | 2.0 | 1.0 | 700 | $1,150 | $1.64 | 25d | 1 | 0.69mi |
| 3710 Greenwood Blvd Saint Louis, MO | 1.0–2.0 | 1.0 | 750 | $1,250 | $1.67 | 25d | 4 | 0.72mi |
| 3717 Cambridge Ave Saint Louis, MO | 2.0 | 1.0 | 1020 | $1,750 | $1.72 | 25d | 1 | 0.74mi |
| 3619 Commonwealth Ave Unit 1F Maplewood, MO | 1.0 | 1.0 | 1000 | $999 | $1.00 | 6d | 1 | 0.80mi |
| 6826 Waldemar Ave St. Louis, MO | 1.0 | 1.0 | 700 | $850 | $1.21 | 25d | 1 | 0.89mi |
| 6826 Waldemar Ave Unit 1FW St. Louis, MO | 1.0 | 1.0 | 700 | $850 | $1.21 | 45d | 1 | 0.89mi |
| 1421 Claytonia Ter Unit 1F Richmond Heights, MO | 2.0 | 1.0 | 855 | $1,125 | $1.32 | 12d | 1 | 0.90mi |
| 7018 Plateau Ave Saint Louis, MO | 2.0 | 2.0 | 1040 | $1,995 | $1.92 | 0d | 1 | 0.96mi |
| 835 N Forest Ave Saint Louis, MO | 3.0 | 1.0 | 864 | $2,150 | $2.49 | 0d | 1 | 0.96mi |
| 7027 Plateau Ave Saint Louis, MO | 2.0 | 1.0 | 816 | $1,750 | $2.14 | 45d | 1 | 0.96mi |
| 1241 Strassner Dr Brentwood, MO | 2.0 | 2.0 | 1127 | $1,950 | $1.73 | 0d | 1 | 1.01mi |
| 1251 Strassner Dr Saint Louis, MO | 2.0 | 2.0 | 1177 | $1,925 | $1.64 | 45d | 1 | 1.01mi |
| 6646 Arsenal St Saint Louis, MO | 1.0 | 1.0 | 800 | $855 | $1.07 | 0d | 1 | 1.05mi |
| 6723 Glades Ave Saint Louis, MO | 3.0 | 1.0 | 980 | $1,750 | $1.79 | 9d | 1 | 1.12mi |
| 7720 Gissler Ave Unit 1E Richmond Heights, MO | 1.0 | 1.0 | 900 | $925 | $1.03 | 45d | 1 | 1.12mi |
| 7230 W Park Ave Unit 1fl Richmond Heights, MO | 2.0 | 1.0 | 1350 | $1,650 | $1.22 | 45d | 1 | 1.16mi |
| 7473 Wise Ave Saint Louis, MO | 2.0 | 1.0 | 917 | $1,295 | $1.41 | 45d | 1 | 1.19mi |
| 7047 Mardel Ave Saint Louis, MO | 2.0 | 1.0 | 768 | $1,695 | $2.21 | 19d | 1 | 1.24mi |
| 8661 Litzsinger Rd Saint Louis, MO | 2.0 | 1.0 | 910 | $1,765 | $1.94 | 45d | 1 | 1.27mi |
| 72 Van Mark Way Brentwood, MO | 1.0–2.0 | 1.0 | 780 | $1,236 | $1.58 | 0d | 4 | 1.32mi |
Listing history 11 events
-
2026-06-21statusdays on market $169,900 Pending 16 DOM
-
2026-06-18days on market $169,900 Active 14 DOM
-
2026-06-17days on market $169,900 Active 13 DOM
-
2026-06-16days on market $169,900 Active 12 DOM
-
2026-06-15days on market $169,900 Active 11 DOM
-
2026-06-13days on market $169,900 Active 9 DOM
-
2026-06-13days on market $169,900 Active 8 DOM
-
2026-06-09days on market $169,900 Active 5 DOM
-
2026-06-08days on market $169,900 Active 4 DOM
-
2026-06-07remarks 687-char remark
-
2026-06-07$169,900 Active 3 DOM
ⓘ Source: listings_history table (triggers on properties + properties_extension) + one-shot
backfill from property_details.listing_events for pre-trigger history.
Tax reassessment forecast MO · Resets to sale price
- Current annual tax
- $2,711 · $226/mo
- Projected year-2 tax
- $2,711 · $226/mo
- Expected delta
- $0/yr ($0/mo · 0.0%)
ⓘ Screening estimate from a state-policy table — verify with the county assessor before closing.
Climate risk First Street
- Flood 1/10 Low FEMA zone X (unshaded) · 0% chance over 30 yrs
- Wildfire 1/10 Low
- Heat 5/10 Major 7 d/yr ≥107°F today · 21 d/yr by 30 yrs out
- Wind 2/10 Low 100% chance of damaging wind over 30 yrs
- Air quality 3/10 Moderate 3 unhealthy d/yr today · 4 by 30 yrs out
Nearby sold comps map
Loading sold comps map…
Walkable amenities ~0.75 mi
Loading nearby amenities…
Taxation est. · year 1
- Rental income
- $17,789
- − Mortgage interest
- −$9,517
- − Property taxes
- −$2,711
- − Insurance
- −$850
- − Repairs & maintenance
- −$1,423
- − Management
- −$1,423
- − Depreciation
- −$4,943
- Taxable loss
- −$3,077
- Est. tax savings @ 24.0%
- +$739
- After-tax cash flow
- $540/yr
For passive investors: Depreciation is non-cash, so a rental often shows a tax loss while cash-flowing — sheltering income. Rental losses are passive: they offset passive income freely, and up to $25,000/yr can offset ordinary (W-2) income if you actively participate and your MAGI is under $100k (phasing out to $0 by $150k); unused losses carry forward. On sale, claimed depreciation is recaptured at up to 25%, and gains may owe capital-gains tax (a 1031 exchange can defer both). Figures are a year-1 estimate at your 24.0% rate — not tax advice; consult a CPA.
Schools (NCES district)
- District
- Maplewood-Richmond Heights
- NCES district ID
- 2920010
- Math proficiency
- 40% ▼ -5.00%
- Reading proficiency
- 56% ▼ -4.00%
- Median HH income
- $45,159
- Composite
- 40.6/100
- National rank
- #3696
- State rank
- #63 of 324 in MO
Livability — Maplewood
- Score
- 84/100
- State rank
- #5
- US rank
- #673
Category grades
Schools grade is shown separately in the Schools card above.
Census & demographics
- Census place
- Maplewood, MO
- County
- Saint Louis County · 888,823 people
- City population
- 8,975
- Metro
- St. Louis, MO-IL
- Population (ZIP)
- 8,975
- Household income
- $65,861
- Rent vs Own
- Severe rent burden
- 195.0
Population outlook (St. Louis County) Hauer SSP2
- Today (2025)
- 1,025,227 people
- By 2030
- 1,028,023 · +0.3%
- By 2040
- 1,020,940 · -0.4%
- By 2050
- 1,007,280 · -1.8%
- By 2075
- 987,277 · -3.7%
- By 2100
- 921,984 · -10.1%
Race, ethnicity, and origin ACS 2023
- Neighborhood character
- Predominantly White (74%)
- Race & ethnicity
- White 74% Two or more races 12% Black 8% Hispanic / Latino 4% Asian 3%
- Common ancestry
- Romanian 4% Slovak 4% Italian 3%
- Foreign-born
- 6% · Canada, China, Vietnam
- Languages at home
- 94% English-only · Spanish 3% Tagalog/Filipino 1%
Political lean MEDSL · St. Louis
- 2024 margin
- Strong D (+23.4) · D 60.8% · R 37.4% · Other 1.7%
- 2008→2024 swing
- +3.5pp toward D · 2008: 19.9pp · 2024: 23.4pp
- All cycles
- 2024: D+23.4 2020: D+24.0 2016: D+16.2 2012: D+13.7 2008: D+19.9
Not yet ingested
- Civics
- —
Market trends
- HPI YoY
- ▼ -226.44%
- Current HPI
- 300.6917
- Rent YoY
- ▲ 3.76%
- Metro
- St. Louis, MO-IL
- State GDP YoY
- ▲ 1.84%
- F500 in state
- 20
Industry mix (Fortune 500 HQ in MO)
| Industry | F500 HQs | Revenue |
|---|---|---|
| Healthcare | 1 | $163B |
|
||
| Insurance | 1 | $21B |
|
||
| Industrial Technology | 1 | $17B |
|
||
| Retail | 1 | $16B |
|
||
| Industrial Distribution | 1 | $10B |
|
||
| Utilities | 1 | $9B |
|
||
Price history
+223.6% since first listed11 events — show timeline
- 2026-06-04 Listed $169,900 MARIS as Distributed by MLS Grid
- 2025-07-25 Price Changed $169,000 MARIS as Distributed by MLS Grid
- 2025-07-09 Listed $175,000 MARIS as Distributed by MLS Grid
- 2025-07-08 Coming Soon — MARIS as Distributed by MLS Grid
- 2020-08-25 Sold (Public Records) — Public Records
- 2016-12-21 Sold (Public Records) $95,000 Public Records
- 2005-07-28 Sold (Public Records) $108,200 Public Records
- 1998-12-23 Sold (Public Records) $52,500 Public Records
- 1995-05-22 Sold (Public Records) — Public Records
- 1965-11-12 Sold (Public Records) — Public Records
- 1965-11-12 Sold (Public Records) — Public Records
Property tax history
+8.8%/yrLatest (2022): $2,711 · +0.8% YoY. Source: county tax records.
Cash-flow waterfall
monthlySold comps — $/sqft
last 12 mo · ≤1 miLoading sold comps…