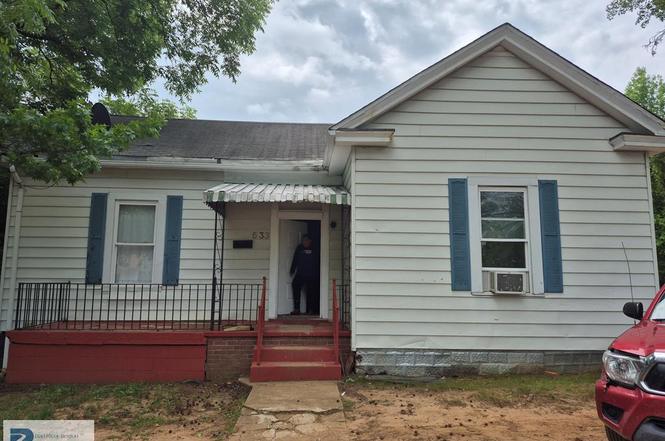
633 Kemper Rd · Danville, VA
Flood risk 1/10 · Minimal
- FEMA flood zone
- X (unshaded)
- Chance of flooding over 30 yrs
- 0.0%
- Est. flood insurance / yr
- $507 – $1,088
Fire risk 2/10 · Minimal
- Est. fire insurance / yr
- $666 – $1,236
Heat risk 6/10 · Moderate
- Hot days now (above 104°F)
- 7 days/yr
- Hot days in 30 yrs
- 18 days/yr
Wind risk 4/10 · Minor
- Chance of severe wind over 30 yrs
- 8.0%
Air-quality risk 2/10 · Minimal
- Unhealthy air days now
- 0 days/yr
- Unhealthy air days in 30 yrs
- 1 days/yr
Risk factors via First Street. Map © Google.
Why this score? — see what drove the C+ grade
The composite is a weighted blend of 9 inputs, each scored 0–100. Each bar is that input's sub-score; the figure is the points it added to the 100-point composite (weight × sub-score).
- Cash flow +27.6/30.0
- DSCR +9.7/10.0
- ARV discount +7.3/15.0
- 1% rule +6.2/10.0
- Livability +3.9/5.0
- Schools +3.0/10.0
- Rent growth +2.5/5.0
- Condition / age +2.5/5.0
- Appreciation +0.0/10.0
$122,000
🖨 Deal sheet 📄 Offer letter ✓ Due diligence
Listing remarks
Great opportunity to earn rental income or to put down roots in your own home! This home is tenant occupied on month-to-month lease. 24-hour notice is required for showing. Property is sold as is, where is. Seller will not make improvements.
Key facts
- Built 1910
- Listed 8 days
Property features AI
Finance
- Other: Lot approximately 0.27 acre; Zoning: OTR
Exterior
- Parking: No garage
- Utilities: Public water; Public sewer
- Home design: Residential property; One-story above-grade living area
- Construction: Wood siding; Composition roof
- Exterior features: Front porch
Interior
- Kitchen: Electric range
- Bedrooms: Three main-level bedrooms
- Bathrooms: One full bathroom; One half bathroom; One main-level bathroom
- Heating & cooling: Heat pump; Natural gas heating
- Interior features: Electric range
Neighborhood map
What this means for you Summary
Snapshot
- This is a 2-bed/1.0-bath single-family listed at $122k.
Deal economics
- At list price, monthly cash flow is $363 ($4k/yr) — positive.
- The deal already cash-flows at list — no discount required.
- Meets the 1% rule at list price ($1k rent vs $122k).
- Cap rate 9.9% vs local median 5.3% in Danville — top-decile yield for the area; either an underpriced asset or a hidden risk that comps aren't pricing in. Stress-test before assuming the spread holds.
Location & tenants
- Location reads 77/100 on livability (#91 in VA, #2,952 nationally) — a middle-class / working-renter tenant base. Strengths: cost of living A+, housing A+, health & safety A+; Watch: amenities D+, crime D-, commute F.
- Danville City Public School District (town): math 30% / reading 44% proficiency, ranked #128 of 131 in VA (top 98%) — families likely to look elsewhere, expect single-tenant / working-renter base with shorter leases; 71% free/reduced lunch — lower-income household profile, screen leases tightly.
- Zoned schools: Schoolfield Elementary (math 22% / reading 40%, grade F, #1,004 of 1,108 statewide, top 91%, 500 students, 98% FRL); O. Trent Bonner Middle (math 33% / reading 53%, grade D-, #288 of 342 statewide, top 85%, 678 students, 91% FRL) — zoned schools average 94% FRL vs 71% district-wide (23 pts higher); higher-poverty schools than district average — tighter screening recommended.
- Market conditions: 245 active listings in the ZIP; 9 comparable units currently listed for rent nearby; rentals lingering (median 44d on market — plan ~5-8 weeks vacancy on turnover, expect pricing pressure); 78% of comp listings sitting > 30 days — soft ceiling on asking rent; 54 units permitted in Danville city in 2024 (40 in 5+ unit buildings).
- This rent runs 32% of the median local income ($51k/yr) — at the standard rent-burdened threshold; future hikes will face affordability resistance.
Forward outlook
- Local home prices are declining (-3.0%/yr); year-one equity from $843 of loan paydown is wiped out by about $4k of value loss. Plan a longer hold.
- Danville County population projected to shrink 7% by 2050 — rents likely to lag national; underwrite the cash flow, not the appreciation.
- At projected returns (-3.0% appreciation + 3.0% rent growth), your $34k cash investment doubles in ~9 years — after that, you're playing with house money.
Negotiation context
- Only 9 days on market — expect competitive offers; lowballing is unlikely to land.
- 3 sale attempts with the ask held roughly flat each time — persistent listings suggest the price (not the market) is what's stuck; bring a comps-based counter.
- Current owner paid $40k; list at $122k implies a 205% gain — meaningful room to come down on a strong offer.
Risks & watch-outs
- Watch-outs: built in 1910 — expect roof / HVAC / electrical / plumbing capex.
- Climate carrying-cost: extreme-heat days projected 7→18/yr by 2055 (HVAC capex compounding) — expect insurance premiums to compound above CPI over the hold.
Questions for the listing agent
- Built in 1910 — when were the roof, HVAC, electrical panel, plumbing, and water heater last replaced?
- Is there a deadline driving the sale (1031 exchange, divorce, estate, relocation)? That informs how much negotiation room exists.
- Schools are B-rated — typically a magnet for longer-tenancy family renters. What's the average tenant stay here, and is there a school-zone premium baked into asking?
- Crime grade is D in this area — have there been break-ins, vandalism, or insurance claims at this property in the last 3 years? What carrier currently insures it and at what premium?
- What's the average days-on-market for RENTAL listings here right now (not sales)? A rising rental-DOM trend means longer vacancies and softer asking-rent achievability than the comps imply.
- What's the recent tenant-quality profile in this submarket — average credit score on applications, eviction rate, late-payment / NSF rate, and stable-employment percentage? A property-management company in the area should have these aggregated.
- How much new for-sale + rental construction is in the pipeline within 1–3 miles? Heavy new supply typically softens prices + rents 12–24 months out; constrained supply supports both.
Investment metrics
- 1% rule
- 1.12% ✓
- Cap rate
- 9.86%
- Cash-on-cash
- 12.75%
- DSCR
- 1.57
- GRM
- 7.4
CMA / ARV
- ARV (on-the-fly)
- $121,500
- Comps found
- 12
Show comp detail 12 sales within ~0.75 mi
| Address | Dist | Beds/Ba | Sqft | Sold | Price | $/sf | Match |
|---|---|---|---|---|---|---|---|
| 811 Kemper Rd | 0.14mi | 2/1.0 | 1,285 (-5%) | 14mo | $68,000 | $53 | 74 |
| 128 Kemper Rd | 0.51mi | 3/2.0 (+1) | 1,325 (-2%) | 4mo | $190,000 | $143 | 61 |
| 73 Fairfield Ave | 0.51mi | 3/1.0 (+1) | 1,368 (+1%) | 12mo | $115,000 | $84 | 59 |
| 229 Kenmore Dr | 0.50mi | 3/2.0 (+1) | 1,380 (+2%) | 16mo | $100,000 | $72 | 50 |
| 309 College Ave | 0.51mi | 2/1.5 | 1,465 (+8%) | 14mo | $220,000 | $150 | 48 |
| 89 Schoolfield Dr | 0.67mi | 3/1.0 (+1) | 1,207 (-11%) | 1mo | $90,000 | $75 | 46 |
| 150 Westmore Dr | 0.49mi | 3/2.0 (+1) | 1,225 (-9%) | 9mo | $126,500 | $103 | 46 |
| 771 Arlington Rd | 0.60mi | 3/2.5 (+1) | 1,221 (-10%) | 9mo | $225,000 | $184 | 38 |
| 45 Baltimore Ave | 0.44mi | 3/1.0 (+1) | 1,150 (-15%) | 18mo | $95,000 | $83 | 34 |
| 118 Flint St | 0.73mi | 2/1.0 | 1,189 (-12%) | 14mo | $107,000 | $90 | 34 |
| 185 Graymont Pl | 0.65mi | 3/2.0 (+1) | 1,176 (-13%) | 6mo | $195,000 | $166 | 34 |
| 217 Floral Ave | 0.61mi | 3/2.0 (+1) | 1,540 (+14%) | 13mo | $132,900 | $86 | 28 |
Match score weights: distance 35% · size 25% · config 20% · recency 20%. Top-matched comps best support the ARV.
Projected returns pro-forma
-3.0% appreciation · 3.0% rent growth · sell at horizon
- IRR
- 2.5%
- Equity multiple
- 1.10×
- Total profit
- $3,286
- Equity at exit
- $18,191
- IRR
- 12.0%
- Equity multiple
- 1.95×
- Total profit
- $32,392
- Equity at exit
- $10,548
Cash invested: $34,160 (down + closing). Projections, not guarantees.
Landlord ↔ Tenant lean methodology
- Overall (STATE)
- 55 Moderately Landlord-Leaning
- State Virginia
- 55 Moderately Landlord-Leaning · D+2
- County
- — inherits STATE
- City
- — inherits STATE
ZIP-level market 24541
- Home prices YoY
- -17.1%
- Active inventory
- 245
- Price-to-rent
- 7.4×
Monthly cashflow live
- Estimated rent
- $1,367 high interval (Pro) →
- Mortgage (P&I)
- −$640
- Tax from tax record
- −$27 /mo · $320/yr
- Insurance
- −$51
- HOA
- −$0
- Vacancy / Maint / Mgmt
- −$287
- Net cashflow
- $363
Break-even live
UW: 25.0% down · 7.5% · 30yr · 1.5% tax · 5.0% vac · 8.0% maint · 8.0% mgmt
Financing live
Cash to close
- Down payment
- $30,500
- Closing costs
- $3,660
- Reserves months
- —
- Total cash needed
- —
Loan-product check · same deal, 3 products live
Conventional
25% down · 7.5% · 30yr
- Down + closing
- —
- Monthly P&I
- —
- Monthly cashflow
- —
- DSCR
- —
- Eligible?
- —
Personal DTI + credit; lowest rate.
DSCR
20% down · 8.5% · 30yr
- Down + closing
- —
- Monthly P&I
- —
- Monthly cashflow
- —
- DSCR
- —
- Eligible?
- —
No personal income docs; deal must DSCR.
Hard money
10% down · 12.0% · 12mo
- Down + closing
- —
- Monthly P&I
- —
- Monthly cashflow
- —
- DSCR
- —
- Eligible?
- —
Short-term bridge; refi at stabilization.
Rent comps 9 comps
| Address | Beds | Baths | Sqft | Rent | $/sqft | DOM | Units | Dist |
|---|---|---|---|---|---|---|---|---|
| 721 Chatham Ave Unit A Danville, VA | 3.0 | 1.0 | 950 | $1,350 | $1.42 | 13d | 1 | 0.10mi |
| 732 Hughes St Danville, VA | 2.0 | 1.0 | 900 | $1,800 | $2.00 | 43d | 1 | 0.11mi |
| 107 Baltimore Ave Danville, VA | 2.0 | 1.0 | 902 | $914 | $1.01 | 21d | 1 | 0.47mi |
| 181 Banner St Danville, VA | 3.0 | 1.0 | 1176 | $1,389 | $1.18 | 43d | 1 | 0.48mi |
| 345 Flint St Danville, VA | 2.0 | 1.0 | 888 | $1,200 | $1.35 | 43d | 1 | 0.82mi |
| 240 Lady Astor Pl Unit 241-10 Danville, VA | 2.0 | 1.5 | 1246 | $1,100 | $0.88 | 43d | 1 | 1.12mi |
| 240 Lady Astor Pl Unit 241-3 Danville, VA | 2.0 | 2.0 | 1246 | $1,130 | $0.91 | 43d | 1 | 1.12mi |
| 66 Carlson Ave Danville, VA | 2.0 | 1.0 | 966 | $1,000 | $1.04 | 43d | 1 | 1.14mi |
| 423 Chestnut St Unit 1 Danville, VA | 2.0 | 1.0 | 1200 | $1,400 | $1.17 | 43d | 1 | 1.41mi |
Listing history 8 events
-
2026-06-19days on market $122,000 Active 9 DOM
-
2026-06-18days on market $122,000 Active 8 DOM
-
2026-06-17days on market $122,000 Active 7 DOM
-
2026-06-16days on market $122,000 Active 6 DOM
-
2026-06-15days on market $122,000 Active 5 DOM
-
2026-06-14days on market $122,000 Active 3 DOM
-
2026-06-13remarks 242-char remark
-
2026-06-13$122,000 Active 2 DOM
ⓘ Source: listings_history table (triggers on properties + properties_extension) + one-shot
backfill from property_details.listing_events for pre-trigger history.
Tax reassessment forecast VA · Resets to sale price
- Current annual tax
- $320 · $27/mo
- Projected year-2 tax
- $1,000 · $83/mo
- Expected delta
- +$681/yr (+$57/mo · 213.1%)
ⓘ Screening estimate from a state-policy table — verify with the county assessor before closing.
Climate risk First Street
- Flood 1/10 Low FEMA zone X (unshaded) · 0% chance over 30 yrs
- Wildfire 2/10 Low
- Heat 6/10 Major 7 d/yr ≥104°F today · 18 d/yr by 30 yrs out
- Wind 4/10 Moderate 8% chance of damaging wind over 30 yrs
- Air quality 2/10 Low 0 unhealthy d/yr today · 1 by 30 yrs out
Nearby sold comps map
Loading sold comps map…
Walkable amenities ~0.75 mi
Loading nearby amenities…
Taxation est. · year 1
- Rental income
- $16,407
- − Mortgage interest
- −$6,834
- − Property taxes
- −$320
- − Insurance
- −$610
- − Repairs & maintenance
- −$1,313
- − Management
- −$1,313
- − Depreciation
- −$3,549
- Taxable income
- $2,469
- Est. tax owed @ 24.0%
- −$593
- After-tax cash flow
- $3,762/yr
For passive investors: Depreciation is non-cash, so a rental often shows a tax loss while cash-flowing — sheltering income. Rental losses are passive: they offset passive income freely, and up to $25,000/yr can offset ordinary (W-2) income if you actively participate and your MAGI is under $100k (phasing out to $0 by $150k); unused losses carry forward. On sale, claimed depreciation is recaptured at up to 25%, and gains may owe capital-gains tax (a 1031 exchange can defer both). Figures are a year-1 estimate at your 24.0% rate — not tax advice; consult a CPA.
Schools (NCES district)
- District
- Danville City Public School District
- NCES district ID
- 5101110
- Math proficiency
- 30% ▼ -22.00%
- Reading proficiency
- 44% ▼ -8.00%
- Median HH income
- $31,952
- Composite
- 30.23/100
- National rank
- #6298
- State rank
- #128 of 131 in VA
Livability — Danville
- Score
- 77/100
- State rank
- #91
- US rank
- #2952
Category grades
Schools grade is shown separately in the Schools card above.
Census & demographics
- Census place
- Danville, VA
- County
- Danville City · 59,055 people
- City population
- 59,055
- Metro
- Danville, VA
- Population (ZIP)
- 28,042
- Household income
- $51,427
- Rent vs Own
- Severe rent burden
- 1399.0
Population outlook (Danville County) Hauer SSP2
- Today (2025)
- 40,989 people
- By 2030
- 40,432 · -1.4%
- By 2040
- 39,255 · -4.2%
- By 2050
- 38,035 · -7.2%
- By 2075
- 35,612 · -13.1%
- By 2100
- 30,365 · -25.9%
Race, ethnicity, and origin ACS 2023
- Neighborhood character
- Diverse neighborhood (Simpson 0.59)
- Race & ethnicity
- White 50% Black 39% Two or more races 7% Hispanic / Latino 5% Asian 2%
- Common ancestry
- Slovak 2% Serbian 2% Lithuanian 1%
- Foreign-born
- 4% · Canada, Dominican Republic
- Languages at home
- 95% English-only · Spanish 4% Other Indo-European 1%
Political lean MEDSL · Danville
- 2024 margin
- Strong D (+21.1) · D 60.1% · R 39.0%
- 2008→2024 swing
- +1.9pp toward D · 2008: 19.1pp · 2024: 21.1pp
- All cycles
- 2024: D+21.1 2020: D+22.1 2016: D+19.9 2012: D+22.1 2008: D+19.1
Not yet ingested
- Civics
- —
Market trends
- HPI YoY
- ▼ -49.28%
- Current HPI
- 238.5992
- Rent YoY
- —
- Metro
- Danville, VA
- State GDP YoY
- ▲ 2.40%
- F500 in state
- 50
Industry mix (Fortune 500 HQ in VA)
| Industry | F500 HQs | Revenue |
|---|---|---|
| Aerospace / Defense | 4 | $236B |
|
||
| Technology / Defense | 3 | $32B |
|
||
| Financial Services | 2 | $176B |
|
||
| Utilities | 2 | $27B |
|
||
| Insurance | 2 | $25B |
|
||
| Technology | 2 | $15B |
|
||
Price history
+741.4% since first listed7 events — show timeline
- 2026-06-10 Listed $122,000 DRRAR
- 2025-10-21 Relisted — DRRAR
- 2025-10-21 Price Changed $130,000 DRRAR
- 2025-07-22 Price Changed $150,000 DRRAR
- 2025-06-05 Listed $130,000 DRRAR
- 2024-01-26 Sold (Public Records) $40,000 Public Records
- 2003-01-27 Sold (Public Records) $14,500 Public Records
Property tax history
+3.8%/yrLatest (2025): $320 · +0.0% YoY. Source: county tax records.
Cash-flow waterfall
monthlySold comps — $/sqft
last 12 mo · ≤1 miLoading sold comps…