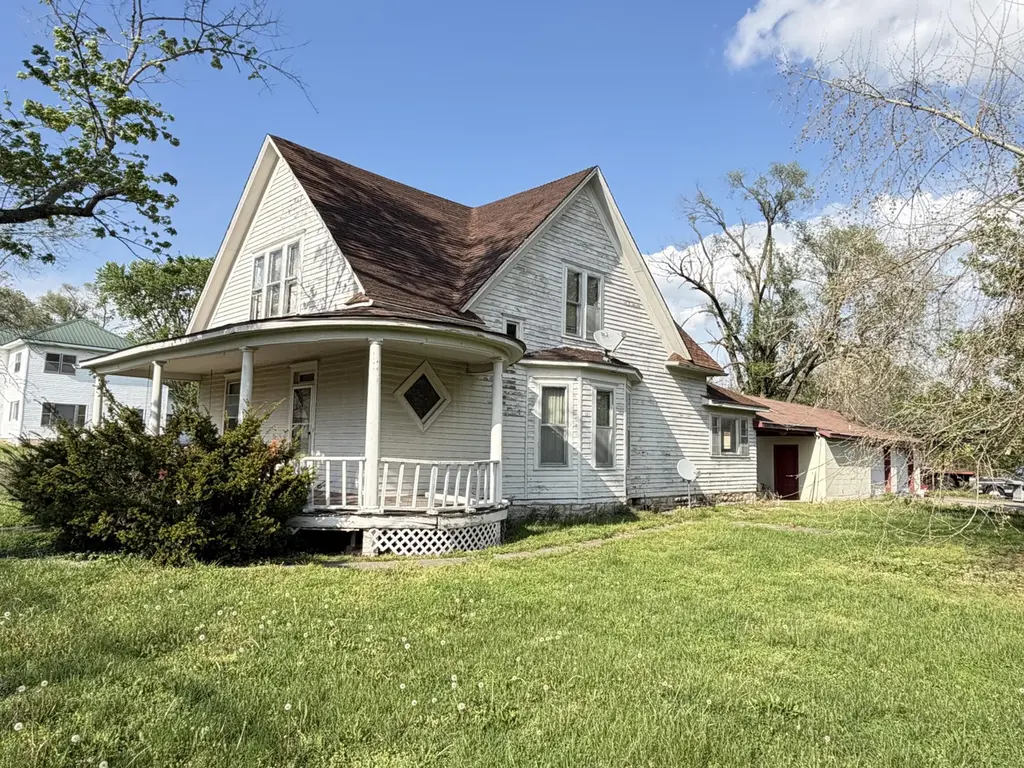
510 S Ohio St · Humansville, MO
Flood risk 1/10 · Minimal
- FEMA flood zone
- X (unshaded)
- Chance of flooding over 30 yrs
- 0.0%
- Est. flood insurance / yr
- $507 – $1,088
Fire risk 3/10 · Minor
- Est. fire insurance / yr
- $1,054 – $1,958
Heat risk 5/10 · Moderate
- Hot days now (above 107°F)
- 7 days/yr
- Hot days in 30 yrs
- 19 days/yr
Wind risk 2/10 · Minimal
- Chance of severe wind over 30 yrs
- 1.0%
Air-quality risk 2/10 · Minimal
- Unhealthy air days now
- 1 days/yr
- Unhealthy air days in 30 yrs
- 1 days/yr
Risk factors via First Street. Map © Google.
Why this score? — see what drove the B+ grade
The composite is a weighted blend of 9 inputs, each scored 0–100. Each bar is that input's sub-score; the figure is the points it added to the 100-point composite (weight × sub-score).
- Cash flow +30.0/30.0
- 1% rule +10.0/10.0
- DSCR +10.0/10.0
- Appreciation +8.0/10.0
- ARV discount +7.5/15.0
- Livability +3.4/5.0
- Schools +2.7/10.0
- Rent growth +2.5/5.0
- Condition / age +2.5/5.0
$68,500
🖨 Deal sheet 📄 Offer letter ✓ Due diligence
Listing remarks
Looking for your next investment property? Look no further. This property features 5 bedroom 2 bathroom with a detached 2 car garage/ workshop and has so much potential. Other features include tall ceilings, several windows to bring in natural light and a full HVAC system and hot water heater that is approximately 3 years old. This home has so much to offer whether you are looking for your next flip, rental or a place to call home. Schedule your showing today! Home is being sold AS IS
Key facts
- 0.33 acre lot
- 2 garage spots
- Built 1930
Neighborhood map
What this means for you Summary
Snapshot
- This is a 5-bed/2.5-bath other listed at $68k.
Deal economics
- At list price, monthly cash flow is $483 ($6k/yr) — positive.
- The deal already cash-flows at list — no discount required.
- Meets the 1% rule at list price ($1k rent vs $68k).
- Recommended offer: $66k (3.0% below list) — sets the bar for market timing.
- Cap rate 14.8% vs local median 3.7% in Humansville — top-decile yield for the area; either an underpriced asset or a hidden risk that comps aren't pricing in. Stress-test before assuming the spread holds.
Location & tenants
- Location reads 67/100 on livability (#209 in MO) — a middle-class / working-renter tenant base. Strengths: cost of living A+, housing A+, health & safety A+; Watch: amenities F, commute F, employment F.
- Humansville R-IV (rural): math 28% / reading 39% proficiency, ranked #247 of 324 in MO (top 76%) — families likely to look elsewhere, expect single-tenant / working-renter base with shorter leases; 74% free/reduced lunch — lower-income household profile, screen leases tightly.
- Zoned schools: Humansville Elem. (math 22% / reading 32%, grade F, #850 of 1,115 statewide, top 78%, 177 students, 0% FRL); Humansville Middle School (math 37% / reading 42%, grade F, #189 of 391 statewide, top 51%, 104 students, 0% FRL); Humansville High (math 30% / reading 70%, grade D+, #117 of 521 statewide, top 23%, 87 students, 0% FRL) — zoned schools average 0% FRL vs 74% district-wide (74 pts lower); this property's tenant base skews higher-income than the district average.
- Market conditions: 42 active listings in the ZIP; 188 units permitted in Polk County in 2024 (40 in 5+ unit buildings).
Forward outlook
- In year one you build about $5k of equity ($474 loan paydown + $4k appreciation (6.0% local appreciation)).
- At projected returns (6.0% appreciation + 3.0% rent growth), your $19k cash investment doubles in ~2 years — after that, you're playing with house money.
- By year 7, paydown + projected appreciation supports a ~$30k cash-out refi (75% LTV) — recoverable capital for the next deal without selling this one.
Negotiation context
- It's been on market 31 days — a 3% lower offer ($66k) is reasonable based on typical stale-listing flexibility.
Risks & watch-outs
- Watch-outs: built in 1930 — expect roof / HVAC / electrical / plumbing capex.
- Climate carrying-cost: extreme-heat days projected 7→19/yr by 2055 (HVAC capex compounding) — expect insurance premiums to compound above CPI over the hold.
Questions for the listing agent
- It's been on market 31 days. Have you received any prior offers? Is the seller open to a 3% concession, seller financing, or rate buy-down credit?
- Built in 1930 — when were the roof, HVAC, electrical panel, plumbing, and water heater last replaced?
- Is there a deadline driving the sale (1031 exchange, divorce, estate, relocation)? That informs how much negotiation room exists.
- Schools are D-rated, which usually means shorter tenancies and higher turnover. Who's the typical renter profile here, and what's been the actual vacancy rate?
- What's the average days-on-market for RENTAL listings here right now (not sales)? A rising rental-DOM trend means longer vacancies and softer asking-rent achievability than the comps imply.
- What's the recent tenant-quality profile in this submarket — average credit score on applications, eviction rate, late-payment / NSF rate, and stable-employment percentage? A property-management company in the area should have these aggregated.
- How much new for-sale + rental construction is in the pipeline within 1–3 miles? Heavy new supply typically softens prices + rents 12–24 months out; constrained supply supports both.
Investment metrics
- 1% rule
- 1.68% ✓
- Cap rate
- 14.76%
- Cash-on-cash
- 30.24%
- DSCR
- 2.35
- GRM
- 5.0
CMA / ARV
No comps found within radius.
Projected returns pro-forma
6.05% appreciation · 3.0% rent growth · sell at horizon
- IRR
- 41.1%
- Equity multiple
- 3.65×
- Total profit
- $50,738
- Equity at exit
- $43,266
- IRR
- 38.2%
- Equity multiple
- 7.52×
- Total profit
- $125,063
- Equity at exit
- $78,636
Cash invested: $19,180 (down + closing). Projections, not guarantees.
Landlord ↔ Tenant lean methodology
- Overall (STATE)
- 81 Strongly Landlord-Friendly
- State Missouri
- 81 Strongly Landlord-Friendly · R+10
- County
- — inherits STATE
- City
- — inherits STATE
ZIP-level market 65674
- Home prices YoY
- 1.9%
- Active inventory
- 42
- Price-to-rent
- 5.0×
Monthly cashflow live
- Estimated rent
- $1,149 medium interval (Pro) →
- Mortgage (P&I)
- −$359
- Tax from tax record
- −$37 /mo · $440/yr
- Insurance
- −$29
- HOA
- −$0
- Vacancy / Maint / Mgmt
- −$241
- Net cashflow
- $483
Break-even live
UW: 25.0% down · 7.5% · 30yr · 1.5% tax · 5.0% vac · 8.0% maint · 8.0% mgmt
Financing live
Cash to close
- Down payment
- $17,125
- Closing costs
- $2,055
- Reserves months
- —
- Total cash needed
- —
Loan-product check · same deal, 3 products live
Conventional
25% down · 7.5% · 30yr
- Down + closing
- —
- Monthly P&I
- —
- Monthly cashflow
- —
- DSCR
- —
- Eligible?
- —
Personal DTI + credit; lowest rate.
DSCR
20% down · 8.5% · 30yr
- Down + closing
- —
- Monthly P&I
- —
- Monthly cashflow
- —
- DSCR
- —
- Eligible?
- —
No personal income docs; deal must DSCR.
Hard money
10% down · 12.0% · 12mo
- Down + closing
- —
- Monthly P&I
- —
- Monthly cashflow
- —
- DSCR
- —
- Eligible?
- —
Short-term bridge; refi at stabilization.
Listing history 17 events
-
2026-06-18days on market $68,500 Active 31 DOM
-
2026-06-17days on market $68,500 Active 30 DOM
-
2026-06-16days on market $68,500 Active 29 DOM
-
2026-06-15days on market $68,500 Active 28 DOM
-
2026-06-14pricedays on market $68,500 Active 26 DOM
-
2026-06-10days on market $70,000 Active 23 DOM
-
2026-06-09days on market $70,000 Active 22 DOM
-
2026-06-08days on market $70,000 Active 21 DOM
-
2026-06-07days on market $70,000 Active 20 DOM
-
2026-06-05days on market $70,000 Active 17 DOM
-
2026-06-03days on market $70,000 Active 16 DOM
-
2026-06-02days on market $70,000 Active 15 DOM
-
2026-06-01days on market $70,000 Active 14 DOM
-
2026-05-31days on market $70,000 Active 13 DOM
-
2026-05-30statusdays on market $70,000 Active 12 DOM
-
2026-04-24status Pending
-
2026-04-12$70,000 Active
ⓘ Source: listings_history table (triggers on properties + properties_extension) + one-shot
backfill from property_details.listing_events for pre-trigger history.
Tax reassessment forecast MO · Resets to sale price
- Current annual tax
- $440 · $37/mo
- Projected year-2 tax
- $664 · $55/mo
- Expected delta
- +$224/yr (+$19/mo · 50.9%)
ⓘ Screening estimate from a state-policy table — verify with the county assessor before closing.
Climate risk First Street
- Flood 1/10 Low FEMA zone X (unshaded) · 0% chance over 30 yrs
- Wildfire 3/10 Moderate
- Heat 5/10 Major 7 d/yr ≥107°F today · 19 d/yr by 30 yrs out
- Wind 2/10 Low 100% chance of damaging wind over 30 yrs
- Air quality 2/10 Low 1 unhealthy d/yr today · 1 by 30 yrs out
Nearby sold comps map
Loading sold comps map…
Walkable amenities ~0.75 mi
Loading nearby amenities…
Taxation est. · year 1
- Rental income
- $13,789
- − Mortgage interest
- −$3,837
- − Property taxes
- −$440
- − Insurance
- −$342
- − Repairs & maintenance
- −$1,103
- − Management
- −$1,103
- − Depreciation
- −$1,993
- Taxable income
- $4,970
- Est. tax owed @ 24.0%
- −$1,193
- After-tax cash flow
- $4,607/yr
For passive investors: Depreciation is non-cash, so a rental often shows a tax loss while cash-flowing — sheltering income. Rental losses are passive: they offset passive income freely, and up to $25,000/yr can offset ordinary (W-2) income if you actively participate and your MAGI is under $100k (phasing out to $0 by $150k); unused losses carry forward. On sale, claimed depreciation is recaptured at up to 25%, and gains may owe capital-gains tax (a 1031 exchange can defer both). Figures are a year-1 estimate at your 24.0% rate — not tax advice; consult a CPA.
Schools (NCES district)
- District
- Humansville R-IV
- NCES district ID
- 2915300
- Math proficiency
- 28% ▼ -7.00%
- Reading proficiency
- 39% ▼ -1.00%
- Median HH income
- $31,710
- Composite
- 27.32/100
- National rank
- #6994
- State rank
- #247 of 324 in MO
Livability — Humansville
- Score
- 67/100
- State rank
- #209
- US rank
- #10507
Category grades
Schools grade is shown separately in the Schools card above.
Census & demographics
- Census place
- Humansville, MO
- Population (ZIP)
- 2,760
Population outlook (Polk County) Hauer SSP2
- Today (2025)
- 31,229 people
- By 2030
- 31,227 · +-0.0%
- By 2040
- 31,104 · -0.4%
- By 2050
- 30,553 · -2.2%
- By 2075
- 29,332 · -6.1%
- By 2100
- 26,387 · -15.5%
Race, ethnicity, and origin ACS 2023
- Neighborhood character
- Predominantly White (84%)
- Race & ethnicity
- White 84% Two or more races 14% Hispanic / Latino 8%
- Hispanic origin (detail)
- Mexican 5%
- Common ancestry
- Slovak 6% German 2% Italian 1%
- Foreign-born
- 1%
Political lean MEDSL · Polk
- 2024 margin
- Solid R (+61.6) · D 18.6% · R 80.2% · Other 1.1%
- 2008→2024 swing
- -29.5pp toward R · 2008: -32.1pp · 2024: -61.6pp
- All cycles
- 2024: R+61.6 2020: R+59.5 2016: R+56.9 2012: R+43.2 2008: R+32.1
Not yet ingested
- Civics
- —
Market trends
- HPI YoY
- ▲ 6.05%
- Current HPI
- 322.9732
- Rent YoY
- —
- Metro
- —
- State GDP YoY
- ▲ 1.84%
- F500 in state
- 20
Industry mix (Fortune 500 HQ in MO)
| Industry | F500 HQs | Revenue |
|---|---|---|
| Healthcare | 1 | $163B |
|
||
| Insurance | 1 | $21B |
|
||
| Industrial Technology | 1 | $17B |
|
||
| Retail | 1 | $16B |
|
||
| Industrial Distribution | 1 | $10B |
|
||
| Utilities | 1 | $9B |
|
||
Price history
2 events — show timeline
- 2026-04-24 Pending — SOMO
- 2026-04-12 Listed $70,000 SOMO
Property tax history
+5.8%/yrLatest (2025): $440 · -2.6% YoY. Source: county tax records.
Cash-flow waterfall
monthlySold comps — $/sqft
last 12 mo · ≤1 miLoading sold comps…