 Duplex
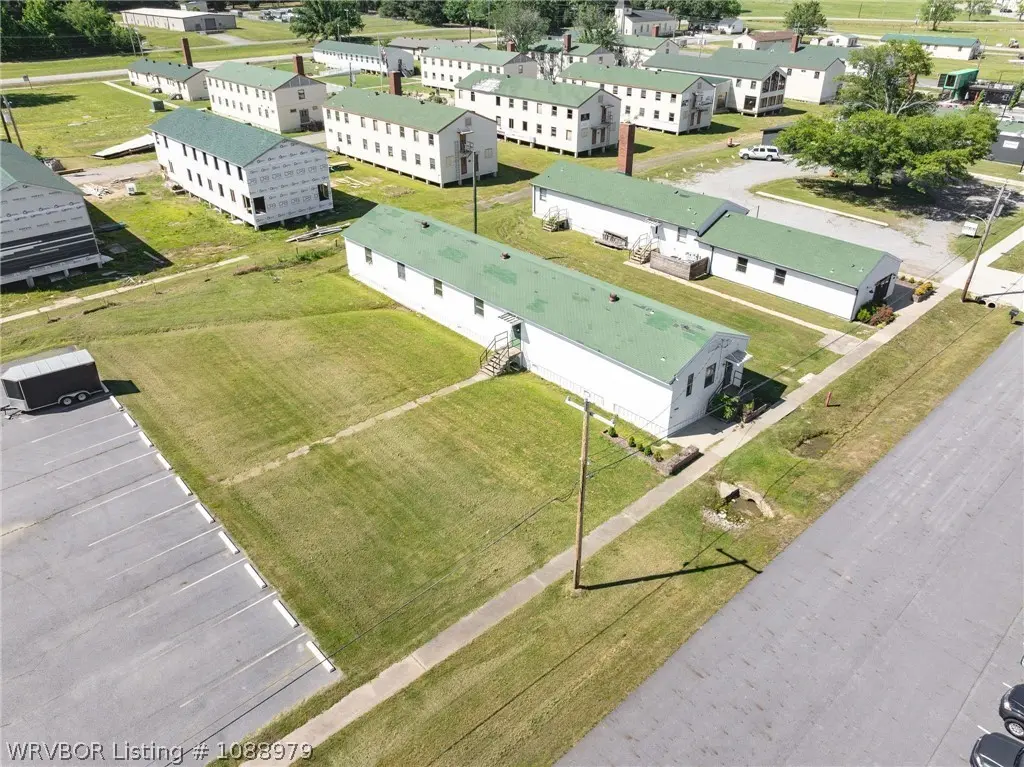
7406 Ellis St · Fort Smith, AR
Flood risk No data
- FEMA flood zone
- —
- Chance of flooding over 30 yrs
- —
- Est. flood insurance / yr
- —
Fire risk No data
- Est. fire insurance / yr
- —
Heat risk No data
- Hot days now (above threshold)
- —
- Hot days in 30 yrs
- —
Wind risk No data
- Chance of severe wind over 30 yrs
- —
Air-quality risk No data
- Unhealthy air days now
- —
- Unhealthy air days in 30 yrs
- —
Risk factors via First Street. Map © Google.
Why this score? — see what drove the C grade
The composite is a weighted blend of 9 inputs, each scored 0–100. Each bar is that input's sub-score; the figure is the points it added to the 100-point composite (weight × sub-score).
- Cash flow +25.1/30.0
- DSCR +8.2/10.0
- ARV discount +7.5/15.0
- 1% rule +6.5/10.0
- Schools +5.0/10.0
- Livability +3.2/5.0
- Rent growth +2.9/5.0
- Condition / age +1.0/5.0
- Appreciation +0.0/10.0
$299,000
🖨 Deal sheet (PDF) 📄 Offer letter ✓ Due diligence
Multi-family units
County records classify this as Multi-Family (2-4 Unit). Listing-text estimate: 2 units. confirmed
Listing remarks
7406 Ellis Street offers a rare investor opportunity in the heart of Chaffee Crossing. Originally part of historic Fort Chaffee, this former military barracks/office building is approved for conversion into three modern townhome-style residences and is being sold AS-IS for an investor or developer to purchase and complete. All permitting and architectural plans have been approved by the City of Fort Smith and will convey with the sale. Plans include elevated individual front porches with stair access, white exterior siding, black roofing, dedicated parking, composite decking, open living areas, kitchens with islands, updated baths, LVT flooring, and three separate residential units. Early e
Key facts
- Updated baths
- Open living areas
- Lvt flooring
Tags
Property features AI
Finance
- Financial info: Multiple 2-bedroom units currently shown with rent of $1,750 each
Exterior
- Parking: Parking lot with asphalt surface; Parking adjacent to a large parking lot
- Home design: Residential triplex; Single-story (one level); Property listed as a fixer
- Construction: Metal siding; Slab foundation; Asphalt shingle roof
- Exterior features: Level lot; Paved road access; No fencing; Curbs in the community
Interior
- Bedrooms: Multiple 2-bedroom units (each with 2 bedrooms)
- Flooring: Vinyl
- Bathrooms: Each unit has 2 bathrooms
- Interior features: Vinyl flooring; No basement
- Laundry & utility: No laundry in units
Neighborhood map
What this means for you Summary
Snapshot
- This is a 2 × 3-bed/3.0-bath units multifamily listed at $299k. Condition is rated poor.
Deal economics
- At list price, monthly cash flow is $658 ($8k/yr) — positive. Per door: $329/mo.
- The deal already cash-flows at list — no discount required.
- Meets the 1% rule at list price ($3k rent vs $299k).
- Recommended offer: $290k (3.0% below list) — sets the bar for market timing.
- Cap rate 8.9% vs local median 4.3% in Fort Smith — top-decile yield for the area; either an underpriced asset or a hidden risk that comps aren't pricing in. Stress-test before assuming the spread holds.
Location & tenants
- Location reads 65/100 on livability (#151 in AR) — a middle-class / working-renter tenant base. Strengths: cost of living A+, housing A+, health & safety A+; Watch: schools D, crime F, amenities F.
- Greenwood School District (town): math 59% / reading 58% proficiency, ranked #5 of 238 in AR (top 2%) — acceptable for families but not a draw, mixed tenant base, ~2y average lease.
- Market conditions: Rents rising (+1.6%/yr); 235 active listings in the ZIP; solid renter incomes; 388 units permitted in Sebastian County in 2024 (16 in 5+ unit buildings).
- At $3,448/mo this rent would consume 47% of the median local household income ($88k/yr) (locally 141% of renters already pay >50% of income on rent) — very limited rent-growth headroom before tenants either downsize or default.
Forward outlook
- Local home prices are declining (-3.0%/yr); year-one equity from $2k of loan paydown is wiped out by about $9k of value loss. Plan a longer hold.
- Sebastian County population projected at +7% by 2050 — modest demand growth; plan on rents tracking national, not racing it.
Negotiation context
- It's been on market 40 days — a 3% lower offer ($290k) is reasonable based on typical stale-listing flexibility.
Risks & watch-outs
- Watch-outs: built in 1940 — expect roof / HVAC / electrical / plumbing capex.
Questions for the listing agent
- It's been on market 40 days. Have you received any prior offers? Is the seller open to a 3% concession, seller financing, or rate buy-down credit?
- Can we see the unit-by-unit rent roll, current vacancy, and any below-market leases? What's the average tenancy length?
- What capital expenditures (roof, boiler, parking lot, exteriors) have been made in the last 5 years, and what's planned in the next 2?
- Have any recent inspections been done? Can we get a copy of the seller's disclosures and any deferred-maintenance estimates?
- Built in 1940 — when were the roof, HVAC, electrical panel, plumbing, and water heater last replaced?
- Is there a deadline driving the sale (1031 exchange, divorce, estate, relocation)? That informs how much negotiation room exists.
- Schools are D-rated, which usually means shorter tenancies and higher turnover. Who's the typical renter profile here, and what's been the actual vacancy rate?
- Crime grade is F in this area — have there been break-ins, vandalism, or insurance claims at this property in the last 3 years? What carrier currently insures it and at what premium?
- What's the average days-on-market for RENTAL listings here right now (not sales)? A rising rental-DOM trend means longer vacancies and softer asking-rent achievability than the comps imply.
- What's the recent tenant-quality profile in this submarket — average credit score on applications, eviction rate, late-payment / NSF rate, and stable-employment percentage? A property-management company in the area should have these aggregated.
- How much new apartment / multifamily construction is in the pipeline within 1–3 miles? Heavy new supply (>2% of stock underway) typically softens rents 12–24 months out; light construction supports rent growth.
Investment metrics
- 1% rule
- 1.15% ✓
- Cap rate
- 8.93%
- Cash-on-cash
- 9.43%
- DSCR
- 1.42
- GRM
- 7.2
CMA / ARV
No comps found within radius.
Projected returns pro-forma
-3.0% appreciation · 1.57% rent growth · sell at horizon
- IRR
- -3.7%
- Equity multiple
- 0.86×
- Total profit
- $-11,408
- Equity at exit
- $44,582
- IRR
- 4.3%
- Equity multiple
- 1.30×
- Total profit
- $24,706
- Equity at exit
- $25,852
Cash invested: $83,720 (down + closing). Projections, not guarantees.
Landlord ↔ Tenant lean methodology
- Overall (STATE)
- 92 Strongly Landlord-Friendly
- State Arkansas
- 92 Strongly Landlord-Friendly · R+14
- County
- — inherits STATE
- City
- — inherits STATE
ZIP-level market 72916
- Home prices YoY
- -20.1%
- Rents YoY
- 1.6%
- Active inventory
- 235
- Price-to-rent
- 14.5×
Monthly cashflow live
- Estimated rent
- $3,448 medium interval (Pro) →
- Mortgage (P&I)
- −$1,568
- Tax est. 1.5%
- −$374 /mo · $4,485/yr
- Insurance
- −$125
- HOA
- −$0
- Vacancy / Maint / Mgmt
- −$724
- Net cashflow
- $658
Break-even live
Sensitivity live
| Price | -10% $864 | -5% $761 | +0% $658 | +5% $554 | +10% $451 |
|---|---|---|---|---|---|
| Rent | -10% $385 | -5% $521 | +0% $658 | +5% $794 | +10% $930 |
| Rate | -1.0pp $808 | -0.5pp $734 | base $658 | +0.5pp $580 | +1.0pp $501 |
2-unit breakdown (identical units grouped — click to expand)
| Units | Beds | Baths | Est. rent |
|---|---|---|---|
| 2× units | 3 | 3 | $3,448 |
| #1 | 3 | 3 | $1,724 |
| #2 | 3 | 3 | $1,724 |
| Total (2 units) | $3,448 | ||
UW: 25.0% down · 7.5% · 30yr · 1.5% tax · 5.0% vac · 8.0% maint · 8.0% mgmt
Financing live
Cash to close
- Down payment
- $74,750
- Closing costs
- $8,970
- Reserves months
- —
- Total cash needed
- —
Loan-product check · same deal, 3 products live
Conventional
25% down · 7.5% · 30yr
- Down + closing
- —
- Monthly P&I
- —
- Monthly cashflow
- —
- DSCR
- —
- Eligible?
- —
Personal DTI + credit; lowest rate.
DSCR
20% down · 8.5% · 30yr
- Down + closing
- —
- Monthly P&I
- —
- Monthly cashflow
- —
- DSCR
- —
- Eligible?
- —
No personal income docs; deal must DSCR.
Hard money
10% down · 12.0% · 12mo
- Down + closing
- —
- Monthly P&I
- —
- Monthly cashflow
- —
- DSCR
- —
- Eligible?
- —
Short-term bridge; refi at stabilization.
Listing history 17 events
-
2026-06-19days on market $299,000 Active 40 DOM
-
2026-06-18days on market $299,000 Active 39 DOM
-
2026-06-17days on market $299,000 Active 38 DOM
-
2026-06-16days on market $299,000 Active 37 DOM
-
2026-06-15days on market $299,000 Active 36 DOM
-
2026-06-14days on market $299,000 Active 34 DOM
-
2026-06-13days on market $299,000 Active 33 DOM
-
2026-06-10days on market $299,000 Active 31 DOM
-
2026-06-09days on market $299,000 Active 30 DOM
-
2026-06-08days on market $299,000 Active 29 DOM
-
2026-06-07days on market $299,000 Active 28 DOM
-
2026-06-03days on market $299,000 Active 24 DOM
-
2026-06-02days on market $299,000 Active 23 DOM
-
2026-06-01days on market $299,000 Active 22 DOM
-
2026-05-31days on market $299,000 Active 21 DOM
-
2026-05-30days on market $299,000 Active 20 DOM
-
2026-05-11$299,000 Active
ⓘ Source: listings_history table (triggers on properties + properties_extension) + one-shot
backfill from property_details.listing_events for pre-trigger history.
Nearby sold comps map
Loading sold comps map…
Walkable amenities ~0.75 mi
Loading nearby amenities…
Taxation est. · year 1
- Rental income
- $41,376
- − Mortgage interest
- −$16,749
- − Property taxes
- −$4,485
- − Insurance
- −$1,495
- − Repairs & maintenance
- −$3,310
- − Management
- −$3,310
- − Depreciation
- −$8,698
- Taxable income
- $3,329
- Est. tax owed @ 24.0%
- −$799
- After-tax cash flow
- $7,092/yr
For passive investors: Depreciation is non-cash, so a rental often shows a tax loss while cash-flowing — sheltering income. Rental losses are passive: they offset passive income freely, and up to $25,000/yr can offset ordinary (W-2) income if you actively participate and your MAGI is under $100k (phasing out to $0 by $150k); unused losses carry forward. On sale, claimed depreciation is recaptured at up to 25%, and gains may owe capital-gains tax (a 1031 exchange can defer both). Figures are a year-1 estimate at your 24.0% rate — not tax advice; consult a CPA.
Condition & rehab AI · 16 photos
This property requires extensive repairs and renovations to be habitable and marketable. Immediate focus should be on the roof and exterior to ensure structural integrity and improve curb appeal.
Repairs flagged
- Major roof — Exposed framing, missing roof shingles
- Major exterior siding — Weathered siding, exposed framing
- Major interior walls — Exposed framing, unfinished interior
- Major flooring — Exposed subfloor, no flooring
Value-add opportunities
- Both roof replacement — Critical to the structural integrity and appearance of the property
- Both exterior siding repair/replacement — Improves curb appeal and structural integrity
- Both interior framing and drywall installation — Creates a livable space and improves the property's value
- Both flooring installation — Completes the interior and improves the property's livability
Renovation cost estimate screening
| Repair item | Severity | Est. cost |
|---|---|---|
| roof · Exposed framing, missing roof shingles | Major | $15,000–50,000 |
| exterior siding · Weathered siding, exposed framing | Major | $15,000–50,000 |
| interior walls · Exposed framing, unfinished interior | Major | $15,000–50,000 |
| flooring · Exposed subfloor, no flooring | Major | $15,000–50,000 |
| Total estimated repair cost · 4 items | $60,000–200,000 |
Value-add ROI direction
- Both roof replacement — Critical to the structural integrity and appearance of the property ↑
- Both exterior siding repair/replacement — Improves curb appeal and structural integrity ↑
- Both interior framing and drywall installation — Creates a livable space and improves the property's value ↑
- Both flooring installation — Completes the interior and improves the property's livability ↑
ⓘ Cost ranges are severity-bucket heuristics (US national rule-of-thumb). Get contractor quotes + a written scope before underwriting a rehab budget.
Schools (NCES district)
- District
- Greenwood School District
- NCES district ID
- 0506990
- Math proficiency
- 59% ▼ -9.00%
- Reading proficiency
- 58% ▼ -4.00%
- Median HH income
- $55,015
- Composite
- 50.33/100
- National rank
- #1879
- State rank
- #5 of 238 in AR
Livability — Fort Smith
- Score
- 65/100
- State rank
- #151
- US rank
- #13185
Category grades
Schools grade is shown separately in the Schools card above.
Census & demographics
- Census place
- Fort Smith, AR
- County
- Sebastian County · 99,312 people
- City population
- 94,356
- Metro
- Fort Smith, AR-OK
- Population (ZIP)
- 11,711
- Household income
- $87,983
- Rent vs Own
- Severe rent burden
- 141.0
Population outlook (Sebastian County) Hauer SSP2
- Today (2025)
- 133,992 people
- By 2030
- 136,620 · +2.0%
- By 2040
- 140,832 · +5.1%
- By 2050
- 143,301 · +6.9%
- By 2075
- 147,964 · +10.4%
- By 2100
- 145,848 · +8.8%
Race, ethnicity, and origin ACS 2023
- Neighborhood character
- Predominantly White (75%)
- Race & ethnicity
- White 75% Two or more races 10% Asian 7% Hispanic / Latino 6% Black 4%
- Hispanic origin (detail)
- Mexican 5%
- Common ancestry
- Italian 4% Scandinavian 2% Slovak 2%
- Foreign-born
- 6% · Canada
- Languages at home
- 89% English-only · Spanish 3% Other Asian/Pacific 3% German/W. Germanic 2%
Political lean MEDSL · Sebastian
- 2024 margin
- Solid R (+37.5) · D 30.0% · R 67.6% · Other 2.4%
- 2008→2024 swing
- -2.9pp toward R · 2008: -34.6pp · 2024: -37.5pp
- All cycles
- 2024: R+37.5 2020: R+35.5 2016: R+38.1 2012: R+37.1 2008: R+34.6
Not yet ingested
- Civics
- —
Market trends
- HPI YoY
- ▼ -54.92%
- Current HPI
- 218.0302
- Rent YoY
- ▲ 1.57%
- Metro
- Fort Smith, AR-OK
- State GDP YoY
- ▲ 3.80%
- F500 in state
- 10
Industry mix (Fortune 500 HQ in AR)
| Industry | F500 HQs | Revenue |
|---|---|---|
| Retail | 1 | $681B |
|
||
| Food / Agriculture | 1 | $53B |
|
||
| Retail / Energy | 1 | $22B |
|
||
| Transportation / Logistics | 1 | $12B |
|
||
| Energy | 1 | $4B |
|
||
Price history
1 event — show timeline
- 2026-05-11 Listed $299,000 WRVBOR
Cash-flow waterfall
monthlySold comps — $/sqft
last 12 mo · ≤1 miLoading sold comps…