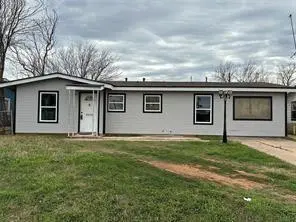
5281 Taos Dr · Abilene, TX
Flood risk 1/10 · Minimal
- FEMA flood zone
- X (unshaded)
- Chance of flooding over 30 yrs
- 0.0%
- Est. flood insurance / yr
- $507 – $1,088
Fire risk 4/10 · Minor
- Est. fire insurance / yr
- $1,222 – $2,270
Heat risk 7/10 · Major
- Hot days now (above 104°F)
- 7 days/yr
- Hot days in 30 yrs
- 24 days/yr
Wind risk 4/10 · Minor
- Chance of severe wind over 30 yrs
- 11.0%
Air-quality risk 1/10 · Minimal
- Unhealthy air days now
- 0 days/yr
- Unhealthy air days in 30 yrs
- 0 days/yr
Risk factors via First Street. Map © Google.
Why this score? — see what drove the C grade
The composite is a weighted blend of 9 inputs, each scored 0–100. Each bar is that input's sub-score; the figure is the points it added to the 100-point composite (weight × sub-score).
- Cash flow +27.4/30.0
- DSCR +9.6/10.0
- 1% rule +6.7/10.0
- Rent growth +5.0/5.0
- Livability +3.8/5.0
- Schools +2.8/10.0
- Condition / age +2.5/5.0
- ARV discount +0.0/15.0
- Appreciation +0.0/10.0
$184,900
🖨 Deal sheet 📄 Offer letter ✓ Due diligence
Listing remarks MLS
Owner Agent--Vacant and easy to show...Will lease till closing for one time move--100% FINANCING AVAILABLE NEW WINDOWS, COMPLETELY RE SKINNED, EXTERIOR & INTERIOR PAINT & SO MUCH MORE. ALL HARD SURFACE FLOORING W NO CARPET. HOME WILL BE ABLE TO GO FHA OR VA AND WE ARE FINISHED W REMODEL.BEAUTIFUL, CLEAN AND READY FOR OCCUPANCY...LOCATED CLOSE TO DYESS & EASY ACCESS TO HWY.--CURRENTLY USED AS A SHORT TERM FURNISHED RENTAL $300 PER NIGHT--SO MAY HAVE TO WORK BETWEEN BOOKINGS
Key facts
- 7,013 sq ft lot
- Built 1959
- Listed 55 days
Neighborhood map
What this means for you Summary
Snapshot
- This is a 4-bed/1.0-bath single-family listed at $185k.
Deal economics
- At list price, monthly cash flow is $543 ($7k/yr) — positive.
- The deal already cash-flows at list — no discount required.
- Meets the 1% rule at list price ($2k rent vs $185k).
- Recommended offer: $179k (3.0% below list) — sets the bar for market timing.
- Cap rate 9.8% vs local median 6.7% in Abilene — top-decile yield for the area; either an underpriced asset or a hidden risk that comps aren't pricing in. Stress-test before assuming the spread holds.
Location & tenants
- Location reads 75/100 on livability (#142 in TX, #4,037 nationally) — a middle-class / working-renter tenant base. Strengths: cost of living A+, housing A+, health & safety A+; Watch: schools D+, crime D, commute F.
- Abilene ISD (urban): math 32% / reading 34% proficiency, ranked #575 of 826 in TX (top 70%) — families likely to look elsewhere, expect single-tenant / working-renter base with shorter leases.
- Market conditions: Rents rising fast (+32.1%/yr); 109 active listings in the ZIP; 6 comparable units currently listed for rent nearby; rentals at typical pace (median 21d on market — plan ~3-4 weeks tenant-placement turnaround); 508 units permitted in Taylor County in 2024 (0 in 5+ unit buildings).
- This rent runs 41% of the median local income ($63k/yr) — at the standard rent-burdened threshold; future hikes will face affordability resistance.
Forward outlook
- Local home prices are declining (-3.0%/yr); year-one equity from $1k of loan paydown is wiped out by about $6k of value loss. Plan a longer hold.
- Taylor County population projected at +16% by 2050 — long-run rental-demand tailwind backs the buy-and-hold thesis.
- At projected returns (-3.0% appreciation + 8.0% rent growth), your $52k cash investment doubles in ~7 years — after that, you're playing with house money.
Negotiation context
- It's been on market 56 days — a 3% lower offer ($179k) is reasonable based on typical stale-listing flexibility.
- 8 sale attempts since 3y ago with the ask held roughly flat each time — persistent listings suggest the price (not the market) is what's stuck; bring a comps-based counter.
Risks & watch-outs
- Watch-outs: built in 1959 — expect roof / HVAC / electrical / plumbing capex.
- Climate carrying-cost: extreme-heat days projected 7→24/yr by 2055 (HVAC capex compounding) — expect insurance premiums to compound above CPI over the hold.
Questions for the listing agent
- It's been on market 56 days. Have you received any prior offers? Is the seller open to a 3% concession, seller financing, or rate buy-down credit?
- Built in 1959 — when were the roof, HVAC, electrical panel, plumbing, and water heater last replaced?
- Is there a deadline driving the sale (1031 exchange, divorce, estate, relocation)? That informs how much negotiation room exists.
- Schools are D-rated, which usually means shorter tenancies and higher turnover. Who's the typical renter profile here, and what's been the actual vacancy rate?
- Crime grade is D in this area — have there been break-ins, vandalism, or insurance claims at this property in the last 3 years? What carrier currently insures it and at what premium?
- What's the average days-on-market for RENTAL listings here right now (not sales)? A rising rental-DOM trend means longer vacancies and softer asking-rent achievability than the comps imply.
- What's the recent tenant-quality profile in this submarket — average credit score on applications, eviction rate, late-payment / NSF rate, and stable-employment percentage? A property-management company in the area should have these aggregated.
- How much new for-sale + rental construction is in the pipeline within 1–3 miles? Heavy new supply typically softens prices + rents 12–24 months out; constrained supply supports both.
Investment metrics
- 1% rule
- 1.17% ✓
- Cap rate
- 9.81%
- Cash-on-cash
- 12.58%
- DSCR
- 1.56
- GRM
- 7.1
CMA / ARV
- ARV (median comp)
- $136,807
- List price
- $184,900
- Delta
- 35.15%
- Verdict
- OVERPRICED
- Comps
- 20 within 1.0 mi
Show comp detail 12 sales within ~0.75 mi
| Address | Dist | Beds/Ba | Sqft | Sold | Price | $/sf | Match |
|---|---|---|---|---|---|---|---|
| 5250 Taos Dr | 0.05mi | 3/1.0 (-1) | 1,128 (-0%) | 2mo | $145,000 | $129 | 90 |
| 5417 Encino Rd | 0.26mi | 3/1.0 (-1) | 1,125 (-1%) | 2mo | $171,900 | $153 | 80 |
| 5273 Pueblo Dr | 0.18mi | 3/2.0 (-1) | 1,140 (+0%) | 3mo | $170,000 | $149 | 79 |
| 5410 Laguna Dr | 0.22mi | 3/1.0 (-1) | 1,104 (-3%) | 3mo | $171,900 | $156 | 78 |
| 5131 Durango Dr | 0.25mi | 3/1.0 (-1) | 1,176 (+4%) | 2mo | $165,000 | $140 | 75 |
| 5333 Fairmont St | 0.64mi | 3/2.0 (-1) | 1,117 (-2%) | 2mo | $215,000 | $192 | 57 |
| 817 S La Salle Dr | 0.60mi | 3/1.0 (-1) | 1,070 (-6%) | 3mo | $130,000 | $121 | 55 |
| 5317 Fairmont St | 0.64mi | 3/2.0 (-1) | 1,166 (+3%) | 2mo | $215,000 | $184 | 55 |
| 5348 Fairmont St | 0.62mi | 3/2.0 (-1) | 1,088 (-4%) | 2mo | $165,000 | $152 | 54 |
| 733 S Crockett Dr | 0.41mi | 3/1.5 (-1) | 1,020 (-10%) | 4mo | $170,000 | $167 | 53 |
| 5208 Aztec Dr | 0.32mi | 3/2.0 (-1) | 1,300 (+15%) | 0mo | $189,000 | $145 | 52 |
| 1226 S Bowie Dr | 0.68mi | 3/1.0 (-1) | 1,021 (-10%) | 2mo | $110,000 | $108 | 45 |
Match score weights: distance 35% · size 25% · config 20% · recency 20%. Top-matched comps best support the ARV.
Projected returns pro-forma
-3.0% appreciation · 8.0% rent growth · sell at horizon
- IRR
- 7.5%
- Equity multiple
- 1.31×
- Total profit
- $15,948
- Equity at exit
- $27,569
- IRR
- 20.5%
- Equity multiple
- 3.13×
- Total profit
- $110,083
- Equity at exit
- $15,987
Cash invested: $51,772 (down + closing). Projections, not guarantees.
Landlord ↔ Tenant lean methodology
- Overall (STATE)
- 87 Strongly Landlord-Friendly
- State Texas
- 87 Strongly Landlord-Friendly · R+5
- County
- — inherits STATE
- City
- — inherits STATE
ZIP-level market 79605
- Rents YoY
- 32.1%
- Active inventory
- 109
- Price-to-rent
- 7.1×
Monthly cashflow live
- Estimated rent
- $2,156 high interval (Pro) →
- Mortgage (P&I)
- −$970
- Tax from tax record
- −$114 /mo · $1,370/yr
- Insurance
- −$77
- HOA
- −$0
- Vacancy / Maint / Mgmt
- −$453
- Net cashflow
- $543
Break-even live
UW: 25.0% down · 7.5% · 30yr · 1.5% tax · 5.0% vac · 8.0% maint · 8.0% mgmt
Financing live
Cash to close
- Down payment
- $46,225
- Closing costs
- $5,547
- Reserves months
- —
- Total cash needed
- —
Loan-product check · same deal, 3 products live
Conventional
25% down · 7.5% · 30yr
- Down + closing
- —
- Monthly P&I
- —
- Monthly cashflow
- —
- DSCR
- —
- Eligible?
- —
Personal DTI + credit; lowest rate.
DSCR
20% down · 8.5% · 30yr
- Down + closing
- —
- Monthly P&I
- —
- Monthly cashflow
- —
- DSCR
- —
- Eligible?
- —
No personal income docs; deal must DSCR.
Hard money
10% down · 12.0% · 12mo
- Down + closing
- —
- Monthly P&I
- —
- Monthly cashflow
- —
- DSCR
- —
- Eligible?
- —
Short-term bridge; refi at stabilization.
Rent comps 6 comps
| Address | Beds | Baths | Sqft | Rent | $/sqft | DOM | Units | Dist |
|---|---|---|---|---|---|---|---|---|
| 5348 Benbrook St Abilene, TX | 3.0 | 2.0 | 1164 | $2,100 | $1.80 | 44d | 1 | 0.59mi |
| 5850 Hartford St Lot 123 Abilene, TX | 3.0 | 2.0 | 1280 | $1,495 | $1.17 | 13d | 1 | 0.91mi |
| 5441 N 10th St Abilene, TX | 3.0 | 2.0 | 1270 | $2,500 | $1.97 | 13d | 1 | 1.10mi |
| 438 Benjamin Ln Abilene, TX | 3.0 | 2.0 | 1216 | $2,299 | $1.89 | 21d | 1 | 1.12mi |
| 402 Arnold Blvd Abilene, TX | 3.0 | 2.0 | 1216 | $2,299 | $1.89 | 21d | 1 | 1.14mi |
| 234 Clyde St Abilene, TX | 3.0 | 1.0 | 998 | $1,995 | $2.00 | 13d | 1 | 1.47mi |
Listing history 26 events
-
2026-05-31days on market $184,900 Active 56 DOM
-
2026-05-30days on market $184,900 Active 55 DOM
-
2026-05-05price $184,900 492-char remark
Show marketing remark (492 chars)
Owner Agent--Vacant and easy to show...Will lease till closing for one time move--100% FINANCING AVAILABLE NEW WINDOWS, COMPLETELY RE SKINNED, EXTERIOR & INTERIOR PAINT & SO MUCH MORE. ALL HARD SURFACE FLOORING W NO CARPET. HOME WILL BE ABLE TO GO FHA OR VA AND WE ARE FINISHED W REMODEL.BEAUTIFUL, CLEAN AND READY FOR OCCUPANCY...LOCATED CLOSE TO DYESS & EASY ACCESS TO HWY.--CURRENTLY USED AS A SHORT TERM FURNISHED RENTAL $300 PER NIGHT--SO MAY HAVE TO WORK BETWEEN BOOKINGS
-
2026-04-05$189,900 Active 492-char remark
Show marketing remark (492 chars)
Owner Agent--Vacant and easy to show...Will lease till closing for one time move--100% FINANCING AVAILABLE NEW WINDOWS, COMPLETELY RE SKINNED, EXTERIOR & INTERIOR PAINT & SO MUCH MORE. ALL HARD SURFACE FLOORING W NO CARPET. HOME WILL BE ABLE TO GO FHA OR VA AND WE ARE FINISHED W REMODEL.BEAUTIFUL, CLEAN AND READY FOR OCCUPANCY...LOCATED CLOSE TO DYESS & EASY ACCESS TO HWY.--CURRENTLY USED AS A SHORT TERM FURNISHED RENTAL $300 PER NIGHT--SO MAY HAVE TO WORK BETWEEN BOOKINGS
-
2025-01-30$149,900 Active
-
2024-12-31historical $1,400
-
2024-12-30historical
-
2024-10-17price $1,400
-
2024-10-08price $1,500
-
2024-04-03
-
2024-04-02status Active
-
2024-03-31historical
-
2024-02-28price $149,900
-
2024-02-02status Active
-
2024-01-31historical
-
2023-12-30price $153,900
-
2023-12-12status Active
-
2023-11-16historical
-
2023-09-01price $149,900
-
2023-07-02historical
-
2023-06-05$89,900 Active
-
2023-05-31historical
-
2023-05-22price $100,000
-
2023-02-22$110,000 Active
-
2013-04-04soldstatus
-
2003-04-17soldstatus
ⓘ Source: listings_history table (triggers on properties + properties_extension) + one-shot
backfill from property_details.listing_events for pre-trigger history.
Tax reassessment forecast TX · Resets to sale price
- Current annual tax
- $1,370 · $114/mo
- Projected year-2 tax
- $3,384 · $282/mo
- Expected delta
- +$2,014/yr (+$168/mo · 147.0%)
ⓘ Screening estimate from a state-policy table — verify with the county assessor before closing.
Climate risk First Street
- Flood 1/10 Low FEMA zone X (unshaded) · 0% chance over 30 yrs
- Wildfire 4/10 Moderate
- Heat 7/10 Severe 7 d/yr ≥104°F today · 24 d/yr by 30 yrs out
- Wind 4/10 Moderate 11% chance of damaging wind over 30 yrs
- Air quality 1/10 Low 0 unhealthy d/yr today · 0 by 30 yrs out
Nearby sold comps map
Loading sold comps map…
Walkable amenities ~0.75 mi
Loading nearby amenities…
Taxation est. · year 1
- Rental income
- $25,874
- − Mortgage interest
- −$10,357
- − Property taxes
- −$1,370
- − Insurance
- −$924
- − Repairs & maintenance
- −$2,070
- − Management
- −$2,070
- − Depreciation
- −$5,379
- Taxable income
- $3,703
- Est. tax owed @ 24.0%
- −$889
- After-tax cash flow
- $5,622/yr
For passive investors: Depreciation is non-cash, so a rental often shows a tax loss while cash-flowing — sheltering income. Rental losses are passive: they offset passive income freely, and up to $25,000/yr can offset ordinary (W-2) income if you actively participate and your MAGI is under $100k (phasing out to $0 by $150k); unused losses carry forward. On sale, claimed depreciation is recaptured at up to 25%, and gains may owe capital-gains tax (a 1031 exchange can defer both). Figures are a year-1 estimate at your 24.0% rate — not tax advice; consult a CPA.
Schools (NCES district)
- District
- Abilene ISD
- NCES district ID
- 4807440
- Math proficiency
- 32% ▼ -11.00%
- Reading proficiency
- 34% ▼ -5.00%
- Median HH income
- $39,782
- Composite
- 27.71/100
- National rank
- #6909
- State rank
- #575 of 826 in TX
Livability — Abilene
- Score
- 75/100
- State rank
- #142
- US rank
- #4037
Category grades
Schools grade is shown separately in the Schools card above.
Census & demographics
- Census place
- Abilene, TX
- County
- Taylor County · 136,672 people
- City population
- 136,672
- Metro
- Abilene, TX
- Population (ZIP)
- 28,467
- Household income
- $62,929
- Rent vs Own
- Severe rent burden
- 1096.0
Population outlook (Taylor County) Hauer SSP2
- Today (2025)
- 145,270 people
- By 2030
- 150,050 · +3.3%
- By 2040
- 159,417 · +9.7%
- By 2050
- 168,883 · +16.3%
- By 2075
- 194,436 · +33.8%
- By 2100
- 203,163 · +39.9%
Race, ethnicity, and origin ACS 2023
- Neighborhood character
- Majority White (63%)
- Race & ethnicity
- White 63% Hispanic / Latino 22% Two or more races 12% Black 8% Asian 2%
- Hispanic origin (detail)
- Mexican 19%
- Common ancestry
- Slovak 2% Lithuanian 1% Serbian 1%
- Foreign-born
- 6% · Canada
- Languages at home
- 84% English-only · Spanish 14% German/W. Germanic 1% Other Asian/Pacific 0%
Political lean MEDSL · Taylor
- 2024 margin
- Solid R (+49.8) · D 24.6% · R 74.4% · Other 1.0%
- 2008→2024 swing
- -4.2pp toward R · 2008: -45.6pp · 2024: -49.8pp
- All cycles
- 2024: R+49.8 2020: R+45.3 2016: R+51.1 2012: R+53.6 2008: R+45.6
Not yet ingested
- Civics
- —
Market trends
- HPI YoY
- ▼ -181.75%
- Current HPI
- 201.2341
- Rent YoY
- ▲ 32.08%
- Metro
- Abilene, TX
- State GDP YoY
- ▲ 3.95%
- F500 in state
- 110
Industry mix (Fortune 500 HQ in TX)
| Industry | F500 HQs | Revenue |
|---|---|---|
| Energy | 16 | $1,198B |
|
||
| Technology | 5 | $198B |
|
||
| Engineering / Construction | 4 | $72B |
|
||
| Energy Services | 3 | $60B |
|
||
| Utilities | 3 | $41B |
|
||
| Healthcare | 2 | $330B |
|
||
Price history
+68.1% since first listed24 events — show timeline
- 2026-05-05 Price Changed $184,900 NTREIS
- 2026-04-05 Listed $189,900 NTREIS
- 2025-01-30 Listed $149,900 NTREIS
- 2024-12-31 Rental Removed $1,400 NTREIS
- 2024-12-30 Listing Removed — NTREIS
- 2024-10-17 Price Changed $1,400 NTREIS
- 2024-10-08 Price Changed $1,500 NTREIS
- 2024-04-03 Listed for Rent — NTREIS
- 2024-04-02 Relisted — NTREIS
- 2024-03-31 Listing Removed — NTREIS
- 2024-02-28 Price Changed $149,900 NTREIS
- 2024-02-02 Relisted — NTREIS
- 2024-01-31 Listing Removed — NTREIS
- 2023-12-30 Price Changed $153,900 NTREIS
- 2023-12-12 Relisted — NTREIS
- 2023-11-16 Listing Removed — NTREIS
- 2023-09-01 Price Changed $149,900 NTREIS
- 2023-07-02 Rental Removed — NTREIS
- 2023-06-05 Listed $89,900 NTREIS
- 2023-05-31 Listing Removed — NTREIS
- 2023-05-22 Price Changed $100,000 NTREIS
- 2023-02-22 Listed $110,000 NTREIS
- 2013-04-04 Sold (Public Records) — Public Records
- 2003-04-17 Sold (Public Records) — Public Records
Property tax history
+4.8%/yrLatest (2025): $1,370 · +18.2% YoY. Source: county tax records.
Cash-flow waterfall
monthlySold comps — $/sqft
last 12 mo · ≤1 miLoading sold comps…