37707 EL Sol Ave · Pasadena Hills, FL
Flood risk 1/10 · Minimal
- FEMA flood zone
- X (unshaded)
- Chance of flooding over 30 yrs
- 0.0%
- Est. flood insurance / yr
- $507 – $1,088
Fire risk 4/10 · Minor
- Est. fire insurance / yr
- $947 – $1,759
Heat risk 9/10 · Severe
- Hot days now (above 108°F)
- 7 days/yr
- Hot days in 30 yrs
- 24 days/yr
Wind risk 9/10 · Severe
- Chance of severe wind over 30 yrs
- 99.0%
Air-quality risk 2/10 · Minimal
- Unhealthy air days now
- 1 days/yr
- Unhealthy air days in 30 yrs
- 1 days/yr
Risk factors via First Street. Map © Google.
Why this score? — see what drove the B+ grade
The composite is a weighted blend of 9 inputs, each scored 0–100. Each bar is that input's sub-score; the figure is the points it added to the 100-point composite (weight × sub-score).
- Cash flow +30.0/30.0
- ARV discount +15.0/15.0
- 1% rule +10.0/10.0
- DSCR +10.0/10.0
- Schools +4.3/10.0
- Livability +3.2/5.0
- Condition / age +2.5/5.0
- Rent growth +1.9/5.0
- Appreciation +0.0/10.0
$120,000
🖨 Deal sheet 📄 Offer letter ✓ Due diligence
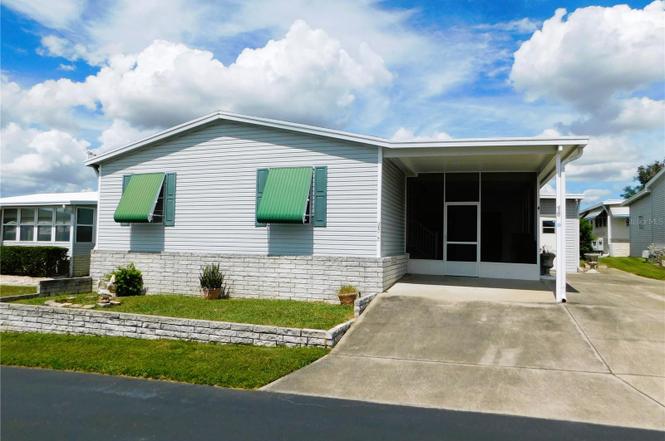
Listing remarks
Under contract-accepting backup offers. Charming 3-Bedroom Home in Spanish Trails West 55+ Community – Now Reduced to $140,000! Don’t miss this fantastic opportunity! This 2004 Fleetwood doublewide manufactured home has just been price reduced from $145,000 to $120,000, making it an exceptional value in the highly desirable Spanish Trails West 55+ community. Offering 1,296 sq. ft. of living space, this home features 3 bedrooms, 2 bathrooms, a spacious family room, and a bright Florida room—providing a solid foundation for updates and personal customization. Major upgrades are already taken care of, including a 2019 roof and 2017 AC/heating system, giving buyers peace of m
Key facts
- Community pool
- Carport
- 2019 roof
Tags
Neighborhood map
What this means for you Summary
Snapshot
- This is a 3-bed/2.0-bath manufactured listed at $120k.
Deal economics
- At list price, monthly cash flow is $668 ($8k/yr) — positive.
- The deal already cash-flows at list — no discount required.
- Meets the 1% rule at list price ($2k rent vs $120k).
- Recommended offer: $106k (12.0% below list) — sets the bar for market timing.
- Cap rate 13.0% vs local median 3.7% in Pasadena Hills — top-decile yield for the area; either an underpriced asset or a hidden risk that comps aren't pricing in. Stress-test before assuming the spread holds.
Location & tenants
- Location reads 63/100 on livability (#723 in FL) — a middle-class / working-renter tenant base. Strengths: housing A+, crime A-, cost of living A-; Watch: schools F, amenities F, commute F.
- Pasco (suburban): math 50% / reading 52% proficiency, ranked #32 of 73 in FL (top 44%) — acceptable for families but not a draw, mixed tenant base, ~2y average lease.
- Market conditions: Rents soft (-2.5%/yr); 856 active listings in the ZIP; 21 comparable units currently listed for rent nearby; rentals at typical pace (median 24d on market — plan ~3-4 weeks tenant-placement turnaround); 6,765 units permitted in Pasco County in 2024 (1,250 in 5+ unit buildings).
- This rent runs 42% of the median local income ($57k/yr) — at the standard rent-burdened threshold; future hikes will face affordability resistance.
Forward outlook
- Local home prices are declining (-3.0%/yr); year-one equity from $830 of loan paydown is wiped out by about $4k of value loss. Plan a longer hold.
- Pasco County population projected at +29% by 2050 — long-run rental-demand tailwind backs the buy-and-hold thesis.
- At projected returns (-3.0% appreciation + 0.0% rent growth), your $34k cash investment doubles in ~7 years — after that, you're playing with house money.
Negotiation context
- It's been on market 194 days — a 12% lower offer ($106k) is reasonable based on typical stale-listing flexibility.
- 5 sale attempts since 17y ago; this cycle's ask has dropped $25k (17%) from the opening price — seller is motivated, your offer sets the floor, not the list.
Risks & watch-outs
- Climate carrying-cost: severe wind risk, 99% chance of damaging wind over 30y; extreme-heat days projected 7→24/yr by 2055 (HVAC capex compounding) — expect insurance premiums to compound above CPI over the hold.
Questions for the listing agent
- It's been on market 194 days. Have you received any prior offers? Is the seller open to a 12% concession, seller financing, or rate buy-down credit?
- What does the HOA fee cover, when was the last increase, and are there any pending special assessments or reserve-fund shortfalls?
- Why hasn't it sold? Are there any deal-killer items the seller is aware of (foundation, flood, title, zoning, code violations)?
- Is there a deadline driving the sale (1031 exchange, divorce, estate, relocation)? That informs how much negotiation room exists.
- Schools are F-rated, which usually means shorter tenancies and higher turnover. Who's the typical renter profile here, and what's been the actual vacancy rate?
- What's the average days-on-market for RENTAL listings here right now (not sales)? A rising rental-DOM trend means longer vacancies and softer asking-rent achievability than the comps imply.
- What's the recent tenant-quality profile in this submarket — average credit score on applications, eviction rate, late-payment / NSF rate, and stable-employment percentage? A property-management company in the area should have these aggregated.
- How much new for-sale + rental construction is in the pipeline within 1–3 miles? Heavy new supply typically softens prices + rents 12–24 months out; constrained supply supports both.
Investment metrics
- 1% rule
- 1.65% ✓
- Cap rate
- 12.97%
- Cash-on-cash
- 23.85%
- DSCR
- 2.06
- GRM
- 5.1
CMA / ARV
- ARV (on-the-fly)
- $160,704
- Comps found
- 12
Show comp detail 12 sales within ~0.75 mi
| Address | Dist | Beds/Ba | Sqft | Sold | Price | $/sf | Match |
|---|---|---|---|---|---|---|---|
| 37501 Campo Ave | 0.21mi | 2/2.0 (-1) | 1,296 (0%) | 2mo | $140,000 | $108 | 84 |
| 7109 EL Matador St | 0.10mi | 2/2.0 (-1) | 1,332 (+3%) | 9mo | $128,000 | $96 | 78 |
| 37539 Rio Ln | 0.14mi | 2/2.0 (-1) | 1,344 (+4%) | 14mo | $175,000 | $130 | 71 |
| 7131 EL Dewitt St | 0.11mi | 2/2.0 (-1) | 1,440 (+11%) | 6mo | $150,000 | $104 | 66 |
| 37526 Rio Ln | 0.16mi | 2/2.0 (-1) | 1,448 (+12%) | 3mo | $180,000 | $124 | 66 |
| 37611 Amigo Dr | 0.14mi | 2/2.0 (-1) | 1,196 (-8%) | 14mo | $140,000 | $117 | 64 |
| 37838 Barcelona Ave | 0.21mi | 2/2.0 (-1) | 1,128 (-13%) | 4mo | $136,000 | $121 | 60 |
| 37652 New Horizons Blvd | 0.47mi | 2/2.0 (-1) | 1,396 (+8%) | 3mo | $240,000 | $172 | 58 |
| 6902 Orlo Dr | 0.40mi | 2/2.0 (-1) | 1,104 (-15%) | 2mo | $75,000 | $68 | 50 |
| 37635 Gill Ave | 0.61mi | 2/2.0 (-1) | 1,407 (+9%) | 3mo | $217,000 | $154 | 49 |
| 37510 New Horizons Blvd | 0.54mi | 3/2.0 | 1,488 (+15%) | 2mo | $215,000 | $144 | 48 |
| 37551 Gill Ave | 0.63mi | 3/2.0 | 1,488 (+15%) | 9mo | $235,000 | $158 | 38 |
Match score weights: distance 35% · size 25% · config 20% · recency 20%. Top-matched comps best support the ARV.
Projected returns pro-forma
-3.0% appreciation · 0.0% rent growth · sell at horizon
- IRR
- 13.5%
- Equity multiple
- 1.52×
- Total profit
- $17,350
- Equity at exit
- $17,892
- IRR
- 19.8%
- Equity multiple
- 2.42×
- Total profit
- $47,733
- Equity at exit
- $10,375
Cash invested: $33,600 (down + closing). Projections, not guarantees.
Landlord ↔ Tenant lean methodology
- Overall (STATE)
- 87 Strongly Landlord-Friendly
- State Florida
- 87 Strongly Landlord-Friendly · R+3
- County
- — inherits STATE
- City
- — inherits STATE
ZIP-level market 33541
- Home prices YoY
- -15.2%
- Rents YoY
- -2.5%
- Active inventory
- 856
- Price-to-rent
- 5.1×
Monthly cashflow live
- Estimated rent
- $1,980 high interval (Pro) →
- Mortgage (P&I)
- −$629
- Tax from tax record
- −$75 /mo · $901/yr
- Insurance
- −$50
- HOA
- −$142
- Vacancy / Maint / Mgmt
- −$416
- Net cashflow
- $668
Break-even live
UW: 25.0% down · 7.5% · 30yr · 1.5% tax · 5.0% vac · 8.0% maint · 8.0% mgmt
Financing live
Cash to close
- Down payment
- $30,000
- Closing costs
- $3,600
- Reserves months
- —
- Total cash needed
- —
Loan-product check · same deal, 3 products live
Conventional
25% down · 7.5% · 30yr
- Down + closing
- —
- Monthly P&I
- —
- Monthly cashflow
- —
- DSCR
- —
- Eligible?
- —
Personal DTI + credit; lowest rate.
DSCR
20% down · 8.5% · 30yr
- Down + closing
- —
- Monthly P&I
- —
- Monthly cashflow
- —
- DSCR
- —
- Eligible?
- —
No personal income docs; deal must DSCR.
Hard money
10% down · 12.0% · 12mo
- Down + closing
- —
- Monthly P&I
- —
- Monthly cashflow
- —
- DSCR
- —
- Eligible?
- —
Short-term bridge; refi at stabilization.
Rent comps 21 comps
| Address | Beds | Baths | Sqft | Rent | $/sqft | DOM | Units | Dist |
|---|---|---|---|---|---|---|---|---|
| 37814 Daughtery Rd Zephyrhills, FL | 2.0 | 1.0 | 1070 | $1,395 | $1.30 | 5d | 1 | 0.24mi |
| 7660 Emerson Hill Cir Zephyrhills, FL | 1.0–3.0 | 1.0–2.0 | 1077 | $2,315 | $2.15 | 1d | 34 | 0.63mi |
| 6633 Foxmoor Dr Zephyrhills, FL | 3.0 | 2.0 | 1300 | $2,000 | $1.54 | 24d | 1 | 0.76mi |
| 6335 Maisie Rd Zephyrhills, FL | 3.0 | 2.5 | 1363 | $1,650 | $1.21 | 20d | 1 | 0.85mi |
| 38350 Ironwood Pl #5 Zephyrhills, FL | 2.0 | 2.0 | 1094 | $1,800 | $1.65 | 24d | 1 | 0.87mi |
| 6788 Basswood Cir Zephyrhills, FL | 2.0 | 2.0 | 1067 | $1,250 | $1.17 | 24d | 1 | 0.89mi |
| 6262 Maisie Rd Zephyrhills, FL | 3.0 | 2.5 | 1363 | $1,700 | $1.25 | 24d | 1 | 0.90mi |
| 37732 Cecil Ln Zephyrhills, FL | 3.0 | 1.0 | 1040 | $1,800 | $1.73 | 24d | 1 | 0.90mi |
| 6246 Timberly Ln Zephyrhills, FL | 3.0 | 2.5 | 1363 | $1,900 | $1.39 | 24d | 1 | 0.90mi |
| 37661 Aaralyn Rd Zephyrhills, FL | 3.0 | 2.5 | 1363 | $1,800 | $1.32 | 24d | 1 | 0.91mi |
| 6249 Maisai Rd #6 Zephyrhills, FL | 3.0 | 2.5 | 1561 | $1,550 | $0.99 | 2d | 1 | 0.92mi |
| 6773 Branham Mill Ct Zephyrhills, FL | 3.0 | 2.0 | 1454 | $1,950 | $1.34 | 24d | 1 | 0.96mi |
| 6302 Abbott Station Dr Zephyrhills, FL | 3.0 | 1.0–2.5 | 855 | $1,999 | $2.34 | 1d | 142 | 0.99mi |
| 7064 Ripple Pond Loop Zephyrhills, FL | 3.0 | 2.5 | 1787 | $2,047 | $1.15 | 14d | 1 | 1.07mi |
| 6195 Daerr Ridge St Zephyrhills, FL | 3.0 | 2.5 | 1386 | $2,000 | $1.44 | 17d | 1 | 1.07mi |
| 38300 Henry Dr Zephyrhills, FL | 2.0 | 1.0 | 1152 | $1,650 | $1.43 | 5d | 1 | 1.13mi |
| 6136 Pina Colada St Zephyrhills, FL | 3.0 | 2.5 | 1386 | $2,100 | $1.52 | 12d | 1 | 1.16mi |
| 8313 Wheat Stone Dr Zephyrhills, FL | 3.0 | 2.0 | 1864 | $2,275 | $1.22 | 24d | 1 | 1.25mi |
| 36887 Highland Meadows Ct Zephyrhills, FL | 4.0 | 2.0 | 1828 | $2,250 | $1.23 | 24d | 1 | 1.39mi |
| 37812 15th Ave Zephyrhills, FL | 2.0 | 2.0 | 1000 | $1,850 | $1.85 | 24d | 1 | 1.43mi |
| 36507 Camp Fire Ter Zephyrhills, FL | 3.0 | 2.0 | 1537 | $2,500 | $1.63 | 24d | 1 | 1.49mi |
HOA detail
- Monthly dues
- $142 · $1,704/yr
Listing history 11 events
-
2026-04-17status Pending
-
2026-04-11status Active
-
2026-04-07status Pending
-
2026-04-01status Active
-
2026-03-31status Pending
-
2026-03-25price $120,000
-
2026-03-25status Active
-
2026-03-18historical
-
2026-03-07price $140,000
-
2025-09-23$145,000 Active
-
2009-09-24$125,000
ⓘ Source: listings_history table (triggers on properties + properties_extension) + one-shot
backfill from property_details.listing_events for pre-trigger history.
Tax reassessment forecast FL · Resets to sale price
- Current annual tax
- $901 · $75/mo
- Projected year-2 tax
- $996 · $83/mo
- Expected delta
- +$95/yr (+$8/mo · 10.5%)
ⓘ Screening estimate from a state-policy table — verify with the county assessor before closing.
Climate risk First Street
- Flood 1/10 Low FEMA zone X (unshaded) · 0% chance over 30 yrs
- Wildfire 4/10 Moderate
- Heat 9/10 Extreme 7 d/yr ≥108°F today · 24 d/yr by 30 yrs out
- Wind 9/10 Extreme 99% chance of damaging wind over 30 yrs
- Air quality 2/10 Low 1 unhealthy d/yr today · 1 by 30 yrs out
Nearby sold comps map
Loading sold comps map…
Walkable amenities ~0.75 mi
Loading nearby amenities…
Taxation est. · year 1
- Rental income
- $23,758
- − Mortgage interest
- −$6,722
- − Property taxes
- −$901
- − Insurance
- −$600
- − Repairs & maintenance
- −$1,901
- − Management
- −$1,901
- − HOA
- −$1,704
- − Depreciation
- −$3,491
- Taxable income
- $6,539
- Est. tax owed @ 24.0%
- −$1,569
- After-tax cash flow
- $6,443/yr
For passive investors: Depreciation is non-cash, so a rental often shows a tax loss while cash-flowing — sheltering income. Rental losses are passive: they offset passive income freely, and up to $25,000/yr can offset ordinary (W-2) income if you actively participate and your MAGI is under $100k (phasing out to $0 by $150k); unused losses carry forward. On sale, claimed depreciation is recaptured at up to 25%, and gains may owe capital-gains tax (a 1031 exchange can defer both). Figures are a year-1 estimate at your 24.0% rate — not tax advice; consult a CPA.
Schools (NCES district)
- District
- Pasco
- NCES district ID
- 1201530
- Math proficiency
- 50% ▼ -10.00%
- Reading proficiency
- 52% ▼ -5.00%
- Median HH income
- $45,039
- Composite
- 43.14/100
- National rank
- #3074
- State rank
- #32 of 73 in FL
Livability — Pasadena Hills
- Score
- 63/100
- State rank
- #723
- US rank
- #15499
Category grades
Schools grade is shown separately in the Schools card above.
Census & demographics
- Census place
- Pasadena Hills, FL
- County
- Pasco County · 524,098 people
- Metro
- Tampa-St. Petersburg-Clearwater, FL
- Population (ZIP)
- 24,654
- Household income
- $56,579
- Rent vs Own
- Severe rent burden
- 393.0
Population outlook (Pasco County) Hauer SSP2
- Today (2025)
- 570,045 people
- By 2030
- 605,844 · +6.3%
- By 2040
- 674,806 · +18.4%
- By 2050
- 736,022 · +29.1%
- By 2075
- 862,900 · +51.4%
- By 2100
- 906,364 · +59.0%
Race, ethnicity, and origin ACS 2023
- Neighborhood character
- Predominantly White (72%)
- Race & ethnicity
- White 72% Hispanic / Latino 15% Two or more races 8% Black 5% Asian 5%
- Hispanic origin (detail)
- Mexican 4% Puerto Rican 9%
- Common ancestry
- Lithuanian 4% Romanian 3% Serbian 3%
- Foreign-born
- 9% · Canada, Vietnam
- Languages at home
- 85% English-only · Spanish 9% Tagalog/Filipino 1% Other Asian/Pacific 1%
Political lean MEDSL · Pasco
- 2024 margin
- Strong R (+25.2) · D 36.9% · R 62.1% · Other 1.0%
- 2008→2024 swing
- -21.6pp toward R · 2008: -3.6pp · 2024: -25.2pp
- All cycles
- 2024: R+25.2 2020: R+20.1 2016: R+21.6 2012: R+6.7 2008: R+3.6
Not yet ingested
- Civics
- —
Market trends
- HPI YoY
- ▼ -55.21%
- Current HPI
- 308.0619
- Rent YoY
- ▼ -2.51%
- Metro
- Tampa-St. Petersburg-Clearwater, FL
- State GDP YoY
- ▲ 3.28%
- F500 in state
- 36
Industry mix (Fortune 500 HQ in FL)
| Industry | F500 HQs | Revenue |
|---|---|---|
| Industrial Technology | 2 | $29B |
|
||
| Insurance | 2 | $17B |
|
||
| Retail | 1 | $60B |
|
||
| Technology Distribution | 1 | $58B |
|
||
| Homebuilding | 1 | $35B |
|
||
| Technology Manufacturing | 1 | $35B |
|
||
Price history
-4.0% since first listed11 events — show timeline
- 2026-04-17 Pending — Stellar MLS as Distributed by MLS Grid
- 2026-04-11 Relisted — Stellar MLS as Distributed by MLS Grid
- 2026-04-07 Pending — Stellar MLS as Distributed by MLS Grid
- 2026-04-01 Relisted — Stellar MLS as Distributed by MLS Grid
- 2026-03-31 Pending — Stellar MLS as Distributed by MLS Grid
- 2026-03-25 Price Changed $120,000 Stellar MLS as Distributed by MLS Grid
- 2026-03-25 Relisted — Stellar MLS as Distributed by MLS Grid
- 2026-03-18 Listing Removed — Stellar MLS as Distributed by MLS Grid
- 2026-03-07 Price Changed $140,000 Stellar MLS as Distributed by MLS Grid
- 2025-09-23 Listed $145,000 Stellar MLS as Distributed by MLS Grid
- 2009-09-24 Listed $125,000 Stellar MLS as Distributed by MLS Grid
Property tax history
+2.3%/yrLatest (2025): $901 · +3.8% YoY. Source: county tax records.
Cash-flow waterfall
monthlySold comps — $/sqft
last 12 mo · ≤1 miLoading sold comps…