 Multi-family
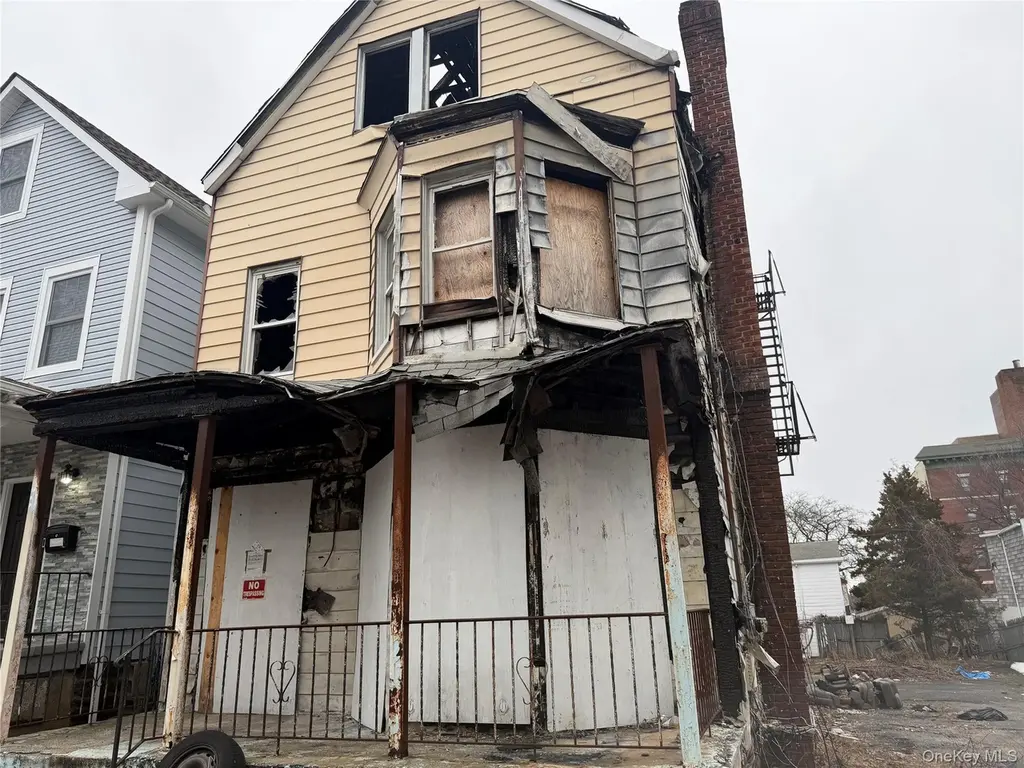
111 N 7th Ave · Mount Vernon, NY
Flood risk 1/10 · Minimal
- FEMA flood zone
- X (unshaded)
- Chance of flooding over 30 yrs
- 0.0%
- Est. flood insurance / yr
- $507 – $1,088
Fire risk 1/10 · Minimal
- Est. fire insurance / yr
- $691 – $1,283
Heat risk 6/10 · Moderate
- Hot days now (above 98°F)
- 7 days/yr
- Hot days in 30 yrs
- 15 days/yr
Wind risk 6/10 · Moderate
- Chance of severe wind over 30 yrs
- 27.0%
Air-quality risk 5/10 · Moderate
- Unhealthy air days now
- 6 days/yr
- Unhealthy air days in 30 yrs
- 8 days/yr
Risk factors via First Street. Map © Google.
Why this score? — see what drove the C+ grade
The composite is a weighted blend of 9 inputs, each scored 0–100. Each bar is that input's sub-score; the figure is the points it added to the 100-point composite (weight × sub-score).
- Cash flow +25.9/30.0
- DSCR +8.7/10.0
- 1% rule +7.6/10.0
- ARV discount +7.5/15.0
- Schools +3.7/10.0
- Livability +3.6/5.0
- Rent growth +3.3/5.0
- Condition / age +2.5/5.0
- Appreciation +0.0/10.0
$350,000
🖨 Deal sheet 📄 Offer letter ✓ Due diligence
Multi-family units
County records classify this as Multi-Family (2-4 Unit). Listing-text estimate: 1 unit. estimate disagrees with records
Listing remarks MLS
Great Home Or Investment Property Parking For At Least 1015 Cars,
Key facts
- Three gas meters
- Multi-unit potential
- Four electric meters
Tags
Property features AI
Exterior
- Parking: Off-street oversized parking
- Utilities: Public sewer; Electricity connected
- Home design: Single family residence; Property listed as fixer condition; Living area source: public records
- Construction: Frame construction
- Exterior features: Frame construction; Not waterfront
Interior
- Kitchen: No appliances listed
- Bedrooms: First-floor bedroom included in layout
- Bathrooms: 3 full bathrooms
- Heating & cooling: Oil heating; No central cooling
- Interior features: First-floor bedroom; Full attic; Basement (see remarks)
- Laundry & utility: No appliances listed
Neighborhood map
What this means for you Summary
Snapshot
- This is a 6-bed/3.0-bath multifamily listed at $350k.
Deal economics
- At list price, monthly cash flow is $860 ($10k/yr) — positive.
- The deal already cash-flows at list — no discount required.
- Meets the 1% rule at list price ($4k rent vs $350k).
- Recommended offer: $329k (6.0% below list) — sets the bar for market timing.
- Cap rate 9.2% vs local median 5.3% in Mount Vernon — top-decile yield for the area; either an underpriced asset or a hidden risk that comps aren't pricing in. Stress-test before assuming the spread holds.
Location & tenants
- Location reads 71/100 on livability (#397 in NY) — a middle-class / working-renter tenant base. Strengths: commute A+, health & safety A, employment B; Watch: crime D-, cost of living F.
- Mount Vernon School District (suburban): math 35% / reading 50% proficiency, ranked #485 of 590 in NY (top 82%) — families likely to look elsewhere, expect single-tenant / working-renter base with shorter leases; 62% free/reduced lunch — lower-income household profile, screen leases tightly.
- Market conditions: Rents rising (+3.4%/yr); 130 active listings in the ZIP; 6 comparable units currently listed for rent nearby; rentals at typical pace (median 24d on market — plan ~3-4 weeks tenant-placement turnaround); 954 units permitted in Westchester County in 2024 (649 in 5+ unit buildings).
- At $4,396/mo this rent would consume 87% of the median local household income ($61k/yr) (locally 2963% of renters already pay >50% of income on rent) — very limited rent-growth headroom before tenants either downsize or default.
Forward outlook
- Local home prices are declining (-3.0%/yr); year-one equity from $2k of loan paydown is wiped out by about $10k of value loss. Plan a longer hold.
- Westchester County population projected at +10% by 2050 — modest demand growth; plan on rents tracking national, not racing it.
- At projected returns (-3.0% appreciation + 3.4% rent growth), your $98k cash investment doubles in ~10 years — after that, you're playing with house money.
Negotiation context
- It's been on market 78 days — a 6% lower offer ($329k) is reasonable based on typical stale-listing flexibility.
- 3 sale attempts since 30y ago with the ask held roughly flat each time — persistent listings suggest the price (not the market) is what's stuck; bring a comps-based counter.
- Current owner paid $237k; 48% above their basis — modest negotiation headroom, anchor on the comps not their cost.
Risks & watch-outs
- Watch-outs: built in 1925 — expect roof / HVAC / electrical / plumbing capex.
- Climate carrying-cost: major wind risk, 27% chance of damaging wind over 30y; extreme-heat days projected 7→15/yr by 2055 (HVAC capex compounding) — expect insurance premiums to compound above CPI over the hold.
Questions for the listing agent
- It's been on market 78 days. Have you received any prior offers? Is the seller open to a 6% concession, seller financing, or rate buy-down credit?
- Built in 1925 — when were the roof, HVAC, electrical panel, plumbing, and water heater last replaced?
- Why hasn't it sold? Are there any deal-killer items the seller is aware of (foundation, flood, title, zoning, code violations)?
- Is there a deadline driving the sale (1031 exchange, divorce, estate, relocation)? That informs how much negotiation room exists.
- Crime grade is D in this area — have there been break-ins, vandalism, or insurance claims at this property in the last 3 years? What carrier currently insures it and at what premium?
- What's the average days-on-market for RENTAL listings here right now (not sales)? A rising rental-DOM trend means longer vacancies and softer asking-rent achievability than the comps imply.
- What's the recent tenant-quality profile in this submarket — average credit score on applications, eviction rate, late-payment / NSF rate, and stable-employment percentage? A property-management company in the area should have these aggregated.
- How much new apartment / multifamily construction is in the pipeline within 1–3 miles? Heavy new supply (>2% of stock underway) typically softens rents 12–24 months out; light construction supports rent growth.
Investment metrics
- 1% rule
- 1.26% ✓
- Cap rate
- 9.24%
- Cash-on-cash
- 10.53%
- DSCR
- 1.47
- GRM
- 6.6
CMA / ARV
No comps found within radius.
Show comp detail 12 sales within ~0.75 mi
| Address | Dist | Beds/Ba | Sqft | Sold | Price | $/sf | Match |
|---|---|---|---|---|---|---|---|
| 248 Westchester Ave | 0.43mi | 6/4.0 | 2,674 | 0mo | $855,000 | $320 | 63 |
| 407 N Macquesten Pkwy | 0.40mi | 6/4.0 | 3,347 | 5mo | $850,000 | $254 | 61 |
| 112 S 7th Ave | 0.47mi | 5/3.0 (-1) | 2,200 | 0mo | $445,000 | $202 | 60 |
| 51 S High St | 0.53mi | 6/3.0 | 2,470 | 5mo | $640,000 | $259 | 59 |
| 19 Primrose Ave | 0.48mi | 6/4.0 | 3,759 | 4mo | $1,175,000 | $313 | 58 |
| 28 Grove St | 0.59mi | 6/2.0 | — | 1mo | $600,000 | — | 55 |
| 14 S Terrace Ave | 0.49mi | 5/2.0 (-1) | — | 2mo | $685,000 | — | 54 |
| 93 Edgewood Ave | 0.73mi | 6/3.0 | 4,500 | 3mo | $974,000 | $216 | 51 |
| 262 N Fulton Ave | 0.61mi | 5/4.0 (-1) | 3,965 | 3mo | $949,000 | $239 | 48 |
| 111 S Fulton Ave | 0.68mi | 5/2.0 (-1) | — | 1mo | $415,000 | — | 46 |
| 307 N Fulton Ave | 0.70mi | 6/6.0 | 3,100 | 1mo | $1,050,000 | $339 | 42 |
| 290 E Sidney Ave | 0.73mi | 5/4.0 (-1) | — | 4mo | $900,000 | — | 41 |
Match score weights: distance 35% · size 25% · config 20% · recency 20%. Top-matched comps best support the ARV.
Projected returns pro-forma
-3.0% appreciation · 3.37% rent growth · sell at horizon
- IRR
- -0.0%
- Equity multiple
- 1.00×
- Total profit
- $-96
- Equity at exit
- $52,186
- IRR
- 10.1%
- Equity multiple
- 1.80×
- Total profit
- $78,013
- Equity at exit
- $30,262
Cash invested: $98,000 (down + closing). Projections, not guarantees.
Landlord ↔ Tenant lean methodology
- Overall (STATE)
- 15 Strongly Tenant-Friendly
- State New York
- 15 Strongly Tenant-Friendly · D+10
- County
- — inherits STATE
- City
- — inherits STATE
ZIP-level market 10550
- Rents YoY
- 3.4%
- Active inventory
- 130
- Price-to-rent
- 6.6×
Monthly cashflow live
- Estimated rent
- $4,396 high interval (Pro) →
- Mortgage (P&I)
- −$1,835
- Tax from tax record
- −$631 /mo · $7,578/yr
- Insurance
- −$146
- HOA
- −$0
- Vacancy / Maint / Mgmt
- −$923
- Net cashflow
- $860
Break-even live
UW: 25.0% down · 7.5% · 30yr · 1.5% tax · 5.0% vac · 8.0% maint · 8.0% mgmt
Financing live
Cash to close
- Down payment
- $87,500
- Closing costs
- $10,500
- Reserves months
- —
- Total cash needed
- —
Loan-product check · same deal, 3 products live
Conventional
25% down · 7.5% · 30yr
- Down + closing
- —
- Monthly P&I
- —
- Monthly cashflow
- —
- DSCR
- —
- Eligible?
- —
Personal DTI + credit; lowest rate.
DSCR
20% down · 8.5% · 30yr
- Down + closing
- —
- Monthly P&I
- —
- Monthly cashflow
- —
- DSCR
- —
- Eligible?
- —
No personal income docs; deal must DSCR.
Hard money
10% down · 12.0% · 12mo
- Down + closing
- —
- Monthly P&I
- —
- Monthly cashflow
- —
- DSCR
- —
- Eligible?
- —
Short-term bridge; refi at stabilization.
Rent comps 6 comps
| Address | Beds | Baths | Sqft | Rent | $/sqft | DOM | Units | Dist |
|---|---|---|---|---|---|---|---|---|
| 222 Primrose Ave Unit 2 Mt Vernon, NY | 5.0 | 2.0 | 1900 | $5,250 | $2.76 | 18d | 1 | 0.67mi |
| 310 S 7th Ave Mount Vernon, NY | 5.0 | 2.0 | 1000 | $4,800 | $4.80 | 24d | 1 | 0.82mi |
| 142 W 5th St Mount Vernon, NY | 6.0 | 2.0 | 1250 | $3,756 | $3.00 | 18d | 1 | 1.00mi |
| 33 Union Ln Unit 2 Mt Vernon, NY | 5.0 | 1.0 | — | $4,000 | — | 24d | 1 | 1.02mi |
| 33 Union Ln Mount Vernon, NY | 5.0 | 1.0 | 1200 | $4,200 | $3.50 | 24d | 1 | 1.02mi |
| 641 S 5th Ave Unit 2nd/3rd Floor Mt Vernon, NY | 5.0 | 2.0 | 1800 | $3,900 | $2.17 | 4d | 1 | 1.42mi |
Listing history 23 events
-
2026-06-18days on market $350,000 Active 78 DOM
-
2026-06-17days on market $350,000 Active 77 DOM
-
2026-06-16days on market $350,000 Active 76 DOM
-
2026-06-15days on market $350,000 Active 75 DOM
-
2026-06-13days on market $350,000 Active 73 DOM
-
2026-06-09days on market $350,000 Active 69 DOM
-
2026-06-08days on market $350,000 Active 68 DOM
-
2026-06-07days on market $350,000 Active 67 DOM
-
2026-06-04days on market $350,000 Active 64 DOM
-
2026-06-03days on market $350,000 Active 63 DOM
-
2026-06-02days on market $350,000 Active 62 DOM
-
2026-06-01days on market $350,000 Active 61 DOM
-
2026-05-31days on market $350,000 Active 60 DOM
-
2026-03-31$350,000 Active
-
2021-10-22status Pending
-
2021-10-22historical
-
2021-10-19$400,000 Active
-
2000-09-20soldstatus $237,000
-
2000-09-20soldstatus $265,000
-
1997-05-05soldstatus $165,000
-
1997-04-15price $175,000 65-char remark
Show marketing remark (65 chars)
Great Home Or Investment Property Parking For At Least 1015 Cars,
-
1997-04-15soldstatus $165,000 65-char remark
Show marketing remark (65 chars)
Great Home Or Investment Property Parking For At Least 1015 Cars,
-
1996-12-12$165,000 65-char remark
Show marketing remark (65 chars)
Great Home Or Investment Property Parking For At Least 1015 Cars,
ⓘ Source: listings_history table (triggers on properties + properties_extension) + one-shot
backfill from property_details.listing_events for pre-trigger history.
Tax reassessment forecast NY · Partial reset (capped growth)
- Current annual tax
- $7,578 · $631/mo
- Projected year-2 tax
- $7,578 · $631/mo
- Expected delta
- $0/yr ($0/mo · 0.0%)
ⓘ Screening estimate from a state-policy table — verify with the county assessor before closing.
Climate risk First Street
- Flood 1/10 Low FEMA zone X (unshaded) · 0% chance over 30 yrs
- Wildfire 1/10 Low
- Heat 6/10 Major 7 d/yr ≥98°F today · 15 d/yr by 30 yrs out
- Wind 6/10 Major 27% chance of damaging wind over 30 yrs
- Air quality 5/10 Major 6 unhealthy d/yr today · 8 by 30 yrs out
Nearby sold comps map
Loading sold comps map…
Walkable amenities ~0.75 mi
Loading nearby amenities…
Taxation est. · year 1
- Rental income
- $52,754
- − Mortgage interest
- −$19,605
- − Property taxes
- −$7,578
- − Insurance
- −$1,750
- − Repairs & maintenance
- −$4,220
- − Management
- −$4,220
- − Depreciation
- −$10,182
- Taxable income
- $5,199
- Est. tax owed @ 24.0%
- −$1,248
- After-tax cash flow
- $9,075/yr
For passive investors: Depreciation is non-cash, so a rental often shows a tax loss while cash-flowing — sheltering income. Rental losses are passive: they offset passive income freely, and up to $25,000/yr can offset ordinary (W-2) income if you actively participate and your MAGI is under $100k (phasing out to $0 by $150k); unused losses carry forward. On sale, claimed depreciation is recaptured at up to 25%, and gains may owe capital-gains tax (a 1031 exchange can defer both). Figures are a year-1 estimate at your 24.0% rate — not tax advice; consult a CPA.
Schools (NCES district)
- District
- Mount Vernon School District
- NCES district ID
- 3620100
- Math proficiency
- 35% ▼ -3.00%
- Reading proficiency
- 50% ▲ 6.00%
- Median HH income
- $50,890
- Composite
- 36.59/100
- National rank
- #4631
- State rank
- #485 of 590 in NY
Livability — Mount Vernon
- Score
- 71/100
- State rank
- #397
- US rank
- #6876
Category grades
Schools grade is shown separately in the Schools card above.
Census & demographics
- Census place
- Mount Vernon, NY
- County
- Westchester County · 709,332 people
- City population
- 61,313
- Metro
- New York-Newark-Jersey City, NY-NJ-PA
- Population (ZIP)
- 38,972
- Household income
- $60,701
- Rent vs Own
- Severe rent burden
- 2963.0
Population outlook (Westchester County) Hauer SSP2
- Today (2025)
- 1,028,035 people
- By 2030
- 1,051,636 · +2.3%
- By 2040
- 1,098,520 · +6.9%
- By 2050
- 1,136,044 · +10.5%
- By 2075
- 1,196,925 · +16.4%
- By 2100
- 1,175,147 · +14.3%
Race, ethnicity, and origin ACS 2023
- Neighborhood character
- Predominantly Black (66%)
- Race & ethnicity
- Black 66% Hispanic / Latino 20% Two or more races 12% White 7% Asian 1%
- Hispanic origin (detail)
- Mexican 3% Puerto Rican 5% Dominican 4%
- Common ancestry
- Estonian 2% Hispanic 1% Russian 1%
- Foreign-born
- 34% · Canada, China, Jamaica
- Languages at home
- 73% English-only · Spanish 16% Other Indo-European 4% French/Haitian/Cajun 2%
Political lean MEDSL · Westchester
- 2024 margin
- Strong D (+26.3) · D 63.1% · R 36.9%
- 2008→2024 swing
- -1.3pp toward R · 2008: 27.6pp · 2024: 26.3pp
- All cycles
- 2024: D+26.3 2020: D+36.3 2016: D+32.8 2012: D+22.2 2008: D+27.6
Not yet ingested
- Civics
- —
Market trends
- HPI YoY
- ▼ -140.69%
- Current HPI
- 191.5235
- Rent YoY
- ▲ 3.37%
- Metro
- New York-Newark-Jersey City, NY-NJ-PA
- State GDP YoY
- ▲ 2.60%
- F500 in state
- 92
Industry mix (Fortune 500 HQ in NY)
| Industry | F500 HQs | Revenue |
|---|---|---|
| Financial Services | 10 | $950B |
|
||
| Consumer Goods | 9 | $162B |
|
||
| Insurance | 4 | $225B |
|
||
| Telecommunications | 2 | $144B |
|
||
| Pharmaceuticals | 2 | $112B |
|
||
| Media / Entertainment | 2 | $69B |
|
||
Price history
+112.1% since first listed10 events — show timeline
- 2026-03-31 Listed $350,000 OneKey® MLS as Distributed by MLS Grid
- 2021-10-22 Pending — OneKey® MLS as Distributed by MLS Grid
- 2021-10-22 Listing Removed — OneKey® MLS as Distributed by MLS Grid
- 2021-10-19 Listed $400,000 OneKey® MLS as Distributed by MLS Grid
- 2000-09-20 Sold (Public Records) $265,000 Public Records
- 2000-09-20 Sold (Public Records) $237,000 Public Records
- 1997-05-05 Sold (Public Records) $165,000 Public Records
- 1997-04-15 Sold (MLS) $165,000 HGMLS
- 1997-04-15 Price Changed $175,000 HGMLS
- 1996-12-12 Listed $165,000 HGMLS
Property tax history
-16.6%/yrLatest (2025): $7,578 · +2.1% YoY. Source: county tax records.
Cash-flow waterfall
monthlySold comps — $/sqft
last 12 mo · ≤1 miLoading sold comps…