 🏷️ Likely Rental
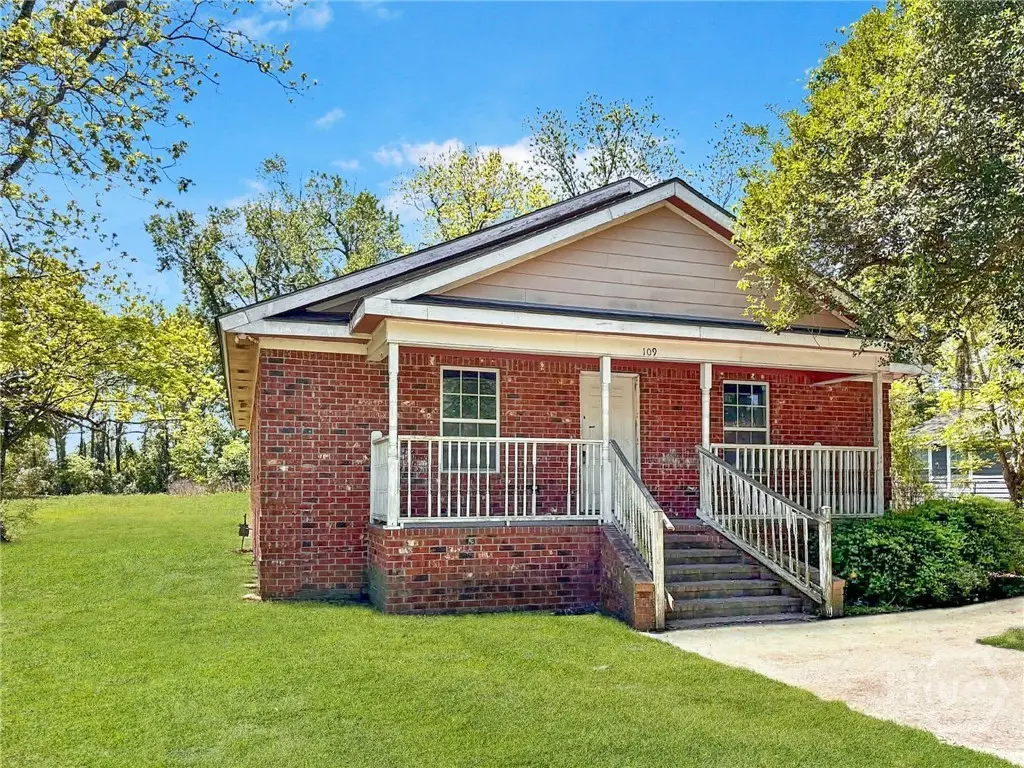
109 Darling St · Savannah, GA
Flood risk 1/10 · Minimal
- FEMA flood zone
- X (unshaded)
- Chance of flooding over 30 yrs
- 0.0%
- Est. flood insurance / yr
- $507 – $1,088
Fire risk 1/10 · Minimal
- Est. fire insurance / yr
- $963 – $1,789
Heat risk 9/10 · Severe
- Hot days now (above 109°F)
- 7 days/yr
- Hot days in 30 yrs
- 18 days/yr
Wind risk 8/10 · Major
- Chance of severe wind over 30 yrs
- 99.0%
Air-quality risk 5/10 · Moderate
- Unhealthy air days now
- 7 days/yr
- Unhealthy air days in 30 yrs
- 8 days/yr
Risk factors via First Street. Map © Google.
Why this score? — see what drove the D+ grade
The composite is a weighted blend of 9 inputs, each scored 0–100. Each bar is that input's sub-score; the figure is the points it added to the 100-point composite (weight × sub-score).
- ARV discount +15.0/15.0
- Cash flow +14.7/30.0
- DSCR +4.5/10.0
- Livability +4.3/5.0
- 1% rule +4.0/10.0
- Rent growth +2.5/5.0
- Condition / age +2.5/5.0
- Schools +2.0/10.0
- Appreciation +0.0/10.0
$177,500
🖨 Deal sheet 📄 Offer letter ✓ Due diligence
Listing remarks
Opportunity for a lucrative investment property! Close to the ports, Savannah Film Studio, Bay St. and more, this home is laid out well to convert each bedroom to an ensuite for rent-by-the-room situation. Home has a large crawl space for easier access to plumbing etc. HVAC only one year old! Otherwise in need of a full renovation and located in an area that just continues to grow and improve! Flip or add to your portfolio! Seller is licensed real estate agent in the state of Georgia.
Key facts
- Investment property
- Large crawl space
- Full renovation
Tags
Property features AI
Exterior
- Parking: Off-street parking
- Utilities: Public water; Public sewer
- Home design: Single-family residence; 1 story; Has a view; Located on a city lot; Public maintained road access; Zoned R2
- Construction: Brick construction
- Exterior features: Front porch
Interior
- Bathrooms: 2 full bathrooms; 1 half bathroom
- Heating & cooling: Central heating (electric); Central air conditioning (electric)
- Interior features: Electric water heater; Crawl space basement
- Laundry & utility: Washer hookup
Neighborhood map
What this means for you Summary
Snapshot
- This is a 3-bed/1.0-bath single-family listed at $178k.
Deal economics
- At list price, monthly cash flow is $46 ($547/yr) — positive.
- The deal already cash-flows at list — no discount required.
- To meet the 1% rule (rent ≥ 1% of price), the offer needs to be $159k (10.4% below list).
- Recommended offer: $159k (10.4% below list) — sets the bar for 1% rule.
- Cap rate 6.6% vs local median 4.0% in Savannah — top-decile yield for the area; either an underpriced asset or a hidden risk that comps aren't pricing in. Stress-test before assuming the spread holds.
Location & tenants
- Location reads 86/100 on livability (#1 in GA, #397 nationally) — a professional / high-income tenant draw. Strengths: crime A+, amenities A+, commute A+; Watch: employment D, schools F.
- Savannah-Chatham County (urban): math 20% / reading 26% proficiency, ranked #134 of 174 in GA (top 77%) — low school quality limits family demand, transient renter base, plan for 1-2y turnover.
- Market conditions: 36 active listings in the ZIP; 5 comparable units currently listed for rent nearby; rentals at typical pace (median 24d on market — plan ~3-4 weeks tenant-placement turnaround); 40% of comp listings sitting > 30 days — soft ceiling on asking rent; 2,694 units permitted in Chatham County in 2024 (973 in 5+ unit buildings).
Forward outlook
- Local home prices are declining (-3.0%/yr); year-one equity from $1k of loan paydown is wiped out by about $5k of value loss. Plan a longer hold.
- Chatham County population projected at +33% by 2050 — long-run rental-demand tailwind backs the buy-and-hold thesis.
Negotiation context
- It's been on market 29 days — a 2% lower offer ($175k) is reasonable based on typical stale-listing flexibility.
- Current owner paid $145k; 22% above their basis — modest negotiation headroom, anchor on the comps not their cost.
Risks & watch-outs
- Climate carrying-cost: severe wind risk, 99% chance of damaging wind over 30y; extreme-heat days projected 7→18/yr by 2055 (HVAC capex compounding) — expect insurance premiums to compound above CPI over the hold.
Questions for the listing agent
- Is there a deadline driving the sale (1031 exchange, divorce, estate, relocation)? That informs how much negotiation room exists.
- Schools are F-rated, which usually means shorter tenancies and higher turnover. Who's the typical renter profile here, and what's been the actual vacancy rate?
- The area grade is low — what's the realistic commute time and amenity access for the typical tenant pool here? Any planned neighborhood developments (good or bad) we should know about?
- What's the average days-on-market for RENTAL listings here right now (not sales)? A rising rental-DOM trend means longer vacancies and softer asking-rent achievability than the comps imply.
- What's the recent tenant-quality profile in this submarket — average credit score on applications, eviction rate, late-payment / NSF rate, and stable-employment percentage? A property-management company in the area should have these aggregated.
- How much new for-sale + rental construction is in the pipeline within 1–3 miles? Heavy new supply typically softens prices + rents 12–24 months out; constrained supply supports both.
Investment metrics
- 1% rule
- 0.90% ✗
- Cap rate
- 6.60%
- Cash-on-cash
- 1.10%
- DSCR
- 1.05
- GRM
- 9.3
CMA / ARV
- ARV (on-the-fly)
- $344,080
- Comps found
- 4
Show comp detail 4 sales within ~0.75 mi
| Address | Dist | Beds/Ba | Sqft | Sold | Price | $/sf | Match |
|---|---|---|---|---|---|---|---|
| 121 King St | 0.08mi | 3/2.0 | 1,720 (-8%) | 2mo | $315,000 | $183 | 77 |
| 17 Fair St | 0.44mi | 4/3.0 (+1) | 1,890 (+1%) | 11mo | $269,000 | $142 | 55 |
| 22 King St | 0.25mi | 4/2.0 (+1) | 1,633 (-13%) | 18mo | $306,000 | $187 | 43 |
| 20 King St | 0.26mi | 4/2.0 (+1) | 1,633 (-13%) | 20mo | $300,000 | $184 | 42 |
Match score weights: distance 35% · size 25% · config 20% · recency 20%. Top-matched comps best support the ARV.
Projected returns pro-forma
-3.0% appreciation · 3.0% rent growth · sell at horizon
- IRR
- -14.5%
- Equity multiple
- 0.48×
- Total profit
- $-25,845
- Equity at exit
- $26,466
- IRR
- -5.8%
- Equity multiple
- 0.62×
- Total profit
- $-18,709
- Equity at exit
- $15,347
Cash invested: $49,700 (down + closing). Projections, not guarantees.
Landlord ↔ Tenant lean methodology
- Overall (STATE)
- 90 Strongly Landlord-Friendly
- State Georgia
- 90 Strongly Landlord-Friendly · R+3
- County
- — inherits STATE
- City
- — inherits STATE
ZIP-level market 31408
- Home prices YoY
- -10.4%
- Active inventory
- 36
- Price-to-rent
- 9.3×
Monthly cashflow live
- Estimated rent
- $1,590 high interval (Pro) →
- Mortgage (P&I)
- −$931
- Tax from tax record
- −$206 /mo · $2,471/yr
- Insurance
- −$74
- HOA
- −$0
- Vacancy / Maint / Mgmt
- −$334
- Net cashflow
- $46
Break-even live
UW: 25.0% down · 7.5% · 30yr · 1.5% tax · 5.0% vac · 8.0% maint · 8.0% mgmt
Financing live
Cash to close
- Down payment
- $44,375
- Closing costs
- $5,325
- Reserves months
- —
- Total cash needed
- —
Loan-product check · same deal, 3 products live
Conventional
25% down · 7.5% · 30yr
- Down + closing
- —
- Monthly P&I
- —
- Monthly cashflow
- —
- DSCR
- —
- Eligible?
- —
Personal DTI + credit; lowest rate.
DSCR
20% down · 8.5% · 30yr
- Down + closing
- —
- Monthly P&I
- —
- Monthly cashflow
- —
- DSCR
- —
- Eligible?
- —
No personal income docs; deal must DSCR.
Hard money
10% down · 12.0% · 12mo
- Down + closing
- —
- Monthly P&I
- —
- Monthly cashflow
- —
- DSCR
- —
- Eligible?
- —
Short-term bridge; refi at stabilization.
Rent comps 5 comps
| Address | Beds | Baths | Sqft | Rent | $/sqft | DOM | Units | Dist |
|---|---|---|---|---|---|---|---|---|
| 1325 Exley St Savannah, GA | 3.0 | 2.0 | 1327 | $1,156 | $0.87 | 44d | 2 | 1.46mi |
| 1325 Exley St Savannah, GA | 2.0–3.0 | 1.0–2.5 | 1193 | $1,432 | $1.20 | 21d | 6 | 1.46mi |
| 1603 Eleanor St Savannah, GA | 3.0 | 1.5 | 1506 | $1,795 | $1.19 | 23d | 1 | 1.47mi |
| 4035 Kessler Ave Savannah, GA | 2.0–3.0 | 1.0–2.0 | 1164 | $1,925 | $1.65 | 23d | 1 | 1.47mi |
| 320 Chatham Villa Dr Savannah, GA | 3.0 | 1.5 | 1250 | $1,650 | $1.32 | 44d | 1 | 1.47mi |
Listing history 20 events
-
2026-06-18days on market $177,500 Active 29 DOM
-
2026-06-17days on market $177,500 Active 28 DOM
-
2026-06-16days on market $177,500 Active 27 DOM
-
2026-06-15days on market $177,500 Active 26 DOM
-
2026-06-14days on market $177,500 Active 24 DOM
-
2026-06-13days on market $177,500 Active 23 DOM
-
2026-06-10days on market $177,500 Active 21 DOM
-
2026-06-09days on market $177,500 Active 20 DOM
-
2026-06-08days on market $177,500 Active 19 DOM
-
2026-06-07days on market $177,500 Active 18 DOM
-
2026-06-05days on market $177,500 Active 15 DOM
-
2026-06-03days on market $177,500 Active 14 DOM
-
2026-06-02days on market $177,500 Active 13 DOM
-
2026-06-01days on market $177,500 Active 12 DOM
-
2026-05-31days on market $177,500 Active 11 DOM
-
2026-05-30days on market $177,500 Active 10 DOM
-
2026-05-20$177,500 Active
-
2021-10-18soldstatus $145,000
-
2008-09-09soldstatus $37,500
-
2004-08-11soldstatus $17,500
ⓘ Source: listings_history table (triggers on properties + properties_extension) + one-shot
backfill from property_details.listing_events for pre-trigger history.
Tax reassessment forecast GA · Resets to sale price
- Current annual tax
- $2,471 · $206/mo
- Projected year-2 tax
- $2,471 · $206/mo
- Expected delta
- $0/yr ($0/mo · 0.0%)
ⓘ Screening estimate from a state-policy table — verify with the county assessor before closing.
Climate risk First Street
- Flood 1/10 Low FEMA zone X (unshaded) · 0% chance over 30 yrs
- Wildfire 1/10 Low
- Heat 9/10 Extreme 7 d/yr ≥109°F today · 18 d/yr by 30 yrs out
- Wind 8/10 Severe 99% chance of damaging wind over 30 yrs
- Air quality 5/10 Major 7 unhealthy d/yr today · 8 by 30 yrs out
Nearby sold comps map
Loading sold comps map…
Walkable amenities ~0.75 mi
Loading nearby amenities…
Taxation est. · year 1
- Rental income
- $19,083
- − Mortgage interest
- −$9,943
- − Property taxes
- −$2,471
- − Insurance
- −$888
- − Repairs & maintenance
- −$1,527
- − Management
- −$1,527
- − Depreciation
- −$5,164
- Taxable loss
- −$2,435
- Est. tax savings @ 24.0%
- +$584
- After-tax cash flow
- $1,132/yr
For passive investors: Depreciation is non-cash, so a rental often shows a tax loss while cash-flowing — sheltering income. Rental losses are passive: they offset passive income freely, and up to $25,000/yr can offset ordinary (W-2) income if you actively participate and your MAGI is under $100k (phasing out to $0 by $150k); unused losses carry forward. On sale, claimed depreciation is recaptured at up to 25%, and gains may owe capital-gains tax (a 1031 exchange can defer both). Figures are a year-1 estimate at your 24.0% rate — not tax advice; consult a CPA.
Schools (NCES district)
- District
- Savannah-Chatham County
- NCES district ID
- 1301020
- Math proficiency
- 20% ▼ -11.00%
- Reading proficiency
- 26% ▼ -5.00%
- Median HH income
- $47,443
- Composite
- 20.14/100
- National rank
- #8639
- State rank
- #134 of 174 in GA
Livability — Savannah
- Score
- 86/100
- State rank
- #1
- US rank
- #397
Category grades
Schools grade is shown separately in the Schools card above.
Census & demographics
- Census place
- Savannah, GA
- City population
- 216,564
- Population (ZIP)
- 11,791
Population outlook (Chatham County) Hauer SSP2
- Today (2025)
- 332,584 people
- By 2030
- 355,508 · +6.9%
- By 2040
- 400,030 · +20.3%
- By 2050
- 443,019 · +33.2%
- By 2075
- 534,579 · +60.7%
- By 2100
- 583,863 · +75.6%
Race, ethnicity, and origin ACS 2023
- Neighborhood character
- Diverse neighborhood (Simpson 0.66)
- Race & ethnicity
- Black 47% White 29% Hispanic / Latino 19% Two or more races 7% Asian 2%
- Hispanic origin (detail)
- Mexican 11%
- Common ancestry
- Iranian 1% Serbian 1% Slovak 1%
- Foreign-born
- 12% · Canada
- Languages at home
- 83% English-only · Spanish 15% Other Asian/Pacific 1% Arabic 1%
Political lean MEDSL · Chatham
- 2024 margin
- D (+18.0) · D 58.6% · R 40.6%
- 2008→2024 swing
- +3.6pp toward D · 2008: 14.4pp · 2024: 18.0pp
- All cycles
- 2024: D+18.0 2020: D+18.8 2016: D+14.5 2012: D+12.0 2008: D+14.4
Not yet ingested
- Civics
- —
Market trends
- HPI YoY
- ▼ -35.98%
- Current HPI
- 309.1601
- Rent YoY
- —
- Metro
- —
- State GDP YoY
- ▲ 2.66%
- F500 in state
- 28
Industry mix (Fortune 500 HQ in GA)
| Industry | F500 HQs | Revenue |
|---|---|---|
| Paper / Packaging | 2 | $29B |
|
||
| Retail | 1 | $160B |
|
||
| Transportation / Logistics | 1 | $91B |
|
||
| Airlines | 1 | $62B |
|
||
| Consumer Goods | 1 | $47B |
|
||
| Utilities | 1 | $25B |
|
||
Price history
+914.3% since first listed4 events — show timeline
- 2026-05-20 Listed $177,500 Hive MLS
- 2021-10-18 Sold (Public Records) $145,000 Public Records
- 2008-09-09 Sold (Public Records) $37,500 Public Records
- 2004-08-11 Sold (Public Records) $17,500 Public Records
Property tax history
+4.8%/yrLatest (2025): $2,471 · -10.0% YoY. Source: county tax records.
Cash-flow waterfall
monthlySold comps — $/sqft
last 12 mo · ≤1 miLoading sold comps…