36 Los Angeles 104 St #104 · June Lake, CA
Flood risk 1/10 · Minimal
- FEMA flood zone
- D
- Chance of flooding over 30 yrs
- 0.0%
- Est. flood insurance / yr
- $544 – $1,084
Fire risk 5/10 · Moderate
- Est. fire insurance / yr
- $659 – $1,223
Heat risk 1/10 · Minimal
- Hot days now (above 72°F)
- 12 days/yr
- Hot days in 30 yrs
- 34 days/yr
Wind risk 1/10 · Minimal
- Chance of severe wind over 30 yrs
- —
Air-quality risk 10/10 · Severe
- Unhealthy air days now
- 38 days/yr
- Unhealthy air days in 30 yrs
- 44 days/yr
Risk factors via First Street. Map © Google.
Why this score? — see what drove the C grade
The composite is a weighted blend of 9 inputs, each scored 0–100. Each bar is that input's sub-score; the figure is the points it added to the 100-point composite (weight × sub-score).
- Cash flow +23.7/30.0
- DSCR +7.6/10.0
- ARV discount +7.5/15.0
- 1% rule +6.9/10.0
- Schools +3.9/10.0
- Livability +3.0/5.0
- Rent growth +2.5/5.0
- Condition / age +2.5/5.0
- Appreciation +0.0/10.0
$715,000
🖨 Deal sheet 📄 Offer letter ✓ Due diligence
Listing remarks MLS
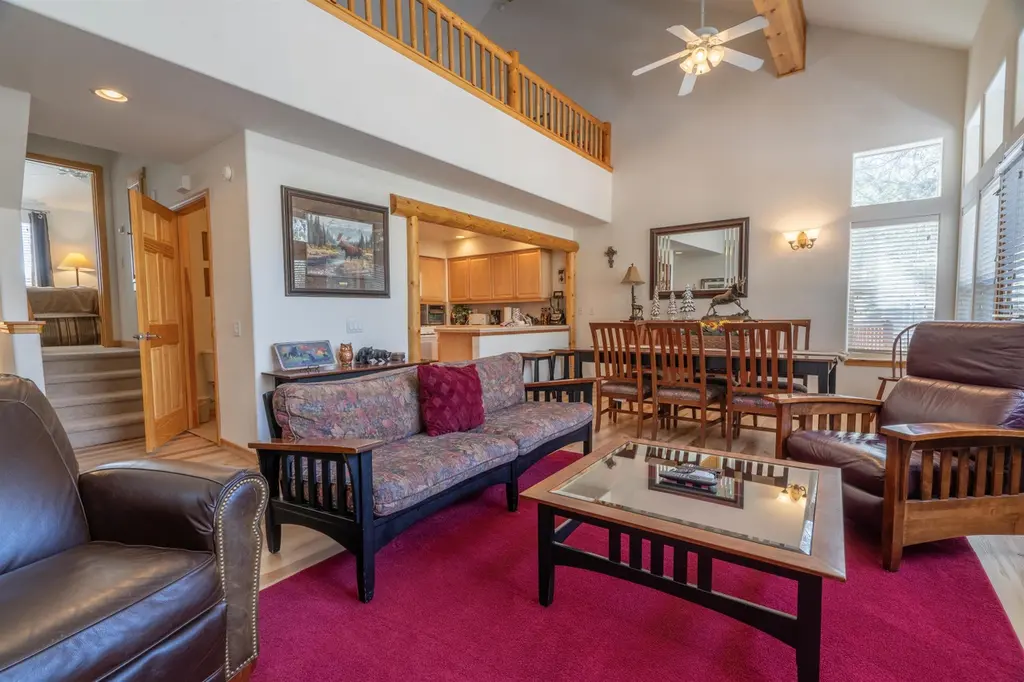
Beautiful unit, looks brand new, upgraded furniture to be sold with unit. Very spacious unit with two decks and mountain view. Home is in a quiet area.
Key facts
- Open-concept design
- Private lower patio
- Primary suite
Tags
Neighborhood map
What this means for you Summary
Snapshot
- This is a 3-bed/2.5-bath condo listed at $715k.
Deal economics
- At list price, monthly cash flow is $1k ($16k/yr) — positive.
- The deal already cash-flows at list — no discount required.
- Meets the 1% rule at list price ($8k rent vs $715k).
- Recommended offer: $704k (1.5% below list) — sets the bar for market timing.
Location & tenants
- Location reads 59/100 on livability (#639 in CA) — a working-class tenant base; expect higher turnover. Strengths: employment A+, housing A+, crime B; Watch: schools D+, amenities F, commute F.
- Eastern Sierra Unified (rural): math 33% / reading 54% proficiency, ranked #626 of 1,400 in CA (top 45%) — families likely to look elsewhere, expect single-tenant / working-renter base with shorter leases.
- Market conditions: 23 active listings in the ZIP; 1 comparable units currently listed for rent nearby; 123 units permitted in Mono County in 2024 (76 in 5+ unit buildings).
Forward outlook
- Local home prices are declining (-3.0%/yr); year-one equity from $5k of loan paydown is wiped out by about $21k of value loss. Plan a longer hold.
- Mono County population projected at -25% by 2050 — secular population decline; favor cash flow + early exit over multi-decade hold.
Negotiation context
- It's been on market 20 days — a 2% lower offer ($704k) is reasonable based on typical stale-listing flexibility.
- 6 sale attempts since 21y ago; this cycle's ask has dropped $74k (9%) from the opening price — seller is motivated, your offer sets the floor, not the list.
Risks & watch-outs
- Climate carrying-cost: moderate wildfire risk — expect insurance premiums to compound above CPI over the hold.
Questions for the listing agent
- What does the HOA fee cover, when was the last increase, and are there any pending special assessments or reserve-fund shortfalls?
- Any open or pending special assessments — roof, HVAC, plumbing, elevator, façade? What's the per-unit balance and payoff schedule, and is the seller paying it off at close or rolling it to the buyer?
- Is there a deadline driving the sale (1031 exchange, divorce, estate, relocation)? That informs how much negotiation room exists.
- Schools are D-rated, which usually means shorter tenancies and higher turnover. Who's the typical renter profile here, and what's been the actual vacancy rate?
- What's the average days-on-market for RENTAL listings here right now (not sales)? A rising rental-DOM trend means longer vacancies and softer asking-rent achievability than the comps imply.
- What's the recent tenant-quality profile in this submarket — average credit score on applications, eviction rate, late-payment / NSF rate, and stable-employment percentage? A property-management company in the area should have these aggregated.
- How much new apartment / multifamily construction is in the pipeline within 1–3 miles? Heavy new supply (>2% of stock underway) typically softens rents 12–24 months out; light construction supports rent growth.
Investment metrics
- 1% rule
- 1.19% ✓
- Cap rate
- 8.57%
- Cash-on-cash
- 8.15%
- DSCR
- 1.36
- GRM
- 7.0
CMA / ARV
No comps found within radius.
Projected returns pro-forma
-3.0% appreciation · 3.0% rent growth · sell at horizon
- IRR
- -3.9%
- Equity multiple
- 0.86×
- Total profit
- $-28,921
- Equity at exit
- $106,609
- IRR
- 5.9%
- Equity multiple
- 1.44×
- Total profit
- $87,829
- Equity at exit
- $61,820
Cash invested: $200,200 (down + closing). Projections, not guarantees.
Landlord ↔ Tenant lean methodology
- Overall (STATE)
- 18 Strongly Tenant-Friendly
- State California
- 18 Strongly Tenant-Friendly · D+13
- County
- — inherits STATE
- City
- — inherits STATE
ZIP-level market 93529
- Active inventory
- 23
- Price-to-rent
- 7.0×
Monthly cashflow live
- Estimated rent
- $8,500 medium interval (Pro) →
- Mortgage (P&I)
- −$3,750
- Tax from tax record
- −$609 /mo · $7,302/yr
- Insurance
- −$298
- HOA
- −$700
- Vacancy / Maint / Mgmt
- −$1,785
- Net cashflow
- $1,359
Break-even live
UW: 25.0% down · 7.5% · 30yr · 1.5% tax · 5.0% vac · 8.0% maint · 8.0% mgmt
Financing live
Cash to close
- Down payment
- $178,750
- Closing costs
- $21,450
- Reserves months
- —
- Total cash needed
- —
Loan-product check · same deal, 3 products live
Conventional
25% down · 7.5% · 30yr
- Down + closing
- —
- Monthly P&I
- —
- Monthly cashflow
- —
- DSCR
- —
- Eligible?
- —
Personal DTI + credit; lowest rate.
DSCR
20% down · 8.5% · 30yr
- Down + closing
- —
- Monthly P&I
- —
- Monthly cashflow
- —
- DSCR
- —
- Eligible?
- —
No personal income docs; deal must DSCR.
Hard money
10% down · 12.0% · 12mo
- Down + closing
- —
- Monthly P&I
- —
- Monthly cashflow
- —
- DSCR
- —
- Eligible?
- —
Short-term bridge; refi at stabilization.
Rent comps 1 comps
| Address | Beds | Baths | Sqft | Rent | $/sqft | DOM | Units | Dist |
|---|---|---|---|---|---|---|---|---|
| 19 Willow Ave June Lake, CA | 2.0 | 2.5 | 1515 | $8,500 | $5.61 | 2d | 1 | 0.25mi |
HOA detail condo
- Monthly dues
- $700 · $8,400/yr
- Assessments
- None detected in remarks — confirm with the listing agent.
Listing history 18 events
-
2026-06-01days on market $715,000 Active 20 DOM
-
2026-05-31days on market $715,000 Active 19 DOM
-
2026-05-31days on market $715,000 Active 18 DOM
-
2026-05-12$715,000 Active 1797-char remark
-
2024-04-02soldstatus $675,000
-
2023-09-11historical
-
2023-08-29price $749,000
-
2023-08-19$789,000 Active
-
2018-07-20soldstatus $430,000
Show marketing remark (151 chars)
Beautiful unit, looks brand new, upgraded furniture to be sold with unit. Very spacious unit with two decks and mountain view. Home is in a quiet area.
-
2018-07-16soldstatus $400,000
-
2018-07-12soldstatus $400,000
-
2017-12-07$430,000
Show marketing remark (151 chars)
Beautiful unit, looks brand new, upgraded furniture to be sold with unit. Very spacious unit with two decks and mountain view. Home is in a quiet area.
-
2017-11-16$430,000
-
2012-08-19$455,000
-
2006-10-16soldstatus $580,000
-
2006-10-16soldstatus $580,000
-
2006-09-14$580,000
-
2005-04-13$695,000
ⓘ Source: listings_history table (triggers on properties + properties_extension) + one-shot
backfill from property_details.listing_events for pre-trigger history.
Tax reassessment forecast CA · Resets to sale price
- Current annual tax
- $7,302 · $609/mo
- Projected year-2 tax
- $7,302 · $609/mo
- Expected delta
- $0/yr ($0/mo · 0.0%)
ⓘ Screening estimate from a state-policy table — verify with the county assessor before closing.
Climate risk First Street
- Flood 1/10 Low FEMA zone D · 0% chance over 30 yrs
- Wildfire 5/10 Major
- Heat 1/10 Low 12 d/yr ≥72°F today · 34 d/yr by 30 yrs out
- Wind 1/10 Low
- Air quality 10/10 Extreme 38 unhealthy d/yr today · 44 by 30 yrs out
Nearby sold comps map
Loading sold comps map…
Walkable amenities ~0.75 mi
Loading nearby amenities…
Taxation est. · year 1
- Rental income
- $102,000
- − Mortgage interest
- −$40,051
- − Property taxes
- −$7,302
- − Insurance
- −$3,575
- − Repairs & maintenance
- −$8,160
- − Management
- −$8,160
- − HOA
- −$8,400
- − Depreciation
- −$20,800
- Taxable income
- $5,552
- Est. tax owed @ 24.0%
- −$1,332
- After-tax cash flow
- $14,976/yr
For passive investors: Depreciation is non-cash, so a rental often shows a tax loss while cash-flowing — sheltering income. Rental losses are passive: they offset passive income freely, and up to $25,000/yr can offset ordinary (W-2) income if you actively participate and your MAGI is under $100k (phasing out to $0 by $150k); unused losses carry forward. On sale, claimed depreciation is recaptured at up to 25%, and gains may owe capital-gains tax (a 1031 exchange can defer both). Figures are a year-1 estimate at your 24.0% rate — not tax advice; consult a CPA.
Schools (NCES district)
- District
- Eastern Sierra Unified
- NCES district ID
- 0611870
- Math proficiency
- 33% ▲ 6.00%
- Reading proficiency
- 54% ▲ 8.00%
- Median HH income
- $47,977
- Composite
- 39.44/100
- National rank
- #8119
- State rank
- #626 of 1400 in CA
Livability — June Lake
- Score
- 59/100
- State rank
- #639
- US rank
- #20103
Category grades
Schools grade is shown separately in the Schools card above.
Census & demographics
- Census place
- June Lake, CA
- Population (ZIP)
- 209
Population outlook (Mono County) Hauer SSP2
- Today (2025)
- 13,077 people
- By 2030
- 12,478 · -4.6%
- By 2040
- 11,119 · -15.0%
- By 2050
- 9,769 · -25.3%
- By 2075
- 6,861 · -47.5%
- By 2100
- 5,762 · -55.9%
Race, ethnicity, and origin ACS 2023
- Neighborhood character
- Diverse neighborhood (Simpson 0.64)
- Race & ethnicity
- White 60% Native American 40%
- Common ancestry
- Romanian 10% Lithuanian 5%
- Foreign-born
- 10%
- Languages at home
- 52% English-only · Spanish 8%
Political lean MEDSL · Mono
- 2024 margin
- Strong D (+20.2) · D 58.1% · R 37.8% · Other 4.1%
- 2008→2024 swing
- +7.0pp toward D · 2008: 13.3pp · 2024: 20.2pp
- All cycles
- 2024: D+20.2 2020: D+22.3 2016: D+11.9 2012: D+7.6 2008: D+13.3
Not yet ingested
- Civics
- —
Market trends
- HPI YoY
- ▼ -170.67%
- Current HPI
- 184.5663
- Rent YoY
- —
- Metro
- —
- State GDP YoY
- ▲ 3.21%
- F500 in state
- 116
Industry mix (Fortune 500 HQ in CA)
| Industry | F500 HQs | Revenue |
|---|---|---|
| Technology | 27 | $1,492B |
|
||
| Financial Services | 3 | $174B |
|
||
| Retail | 3 | $44B |
|
||
| Insurance | 3 | $26B |
|
||
| Media / Entertainment | 2 | $115B |
|
||
| Pharmaceuticals / Biotech | 2 | $62B |
|
||
Price history
-2.9% since first listed14 events — show timeline
- 2024-04-02 Sold (Public Records) $675,000 Public Records
- 2023-09-11 Delisted — MLBOR
- 2023-08-29 Price Changed $749,000 MLBOR
- 2023-08-19 Listed $789,000 MLBOR
- 2018-07-20 Sold (MLS) $430,000 GPSMLS
- 2018-07-16 Sold (Public Records) $400,000 Public Records
- 2018-07-12 Sold (MLS) $400,000 MLBOR
- 2017-12-07 Listed $430,000 GPSMLS
- 2017-11-16 Listed $430,000 MLBOR
- 2012-08-19 Listed $455,000 MLBOR
- 2006-10-16 Sold (Public Records) $580,000 Public Records
- 2006-10-16 Sold (MLS) $580,000 MLBOR
- 2006-09-14 Listed $580,000 MLBOR
- 2005-04-13 Listed $695,000 MLBOR
Property tax history
+5.9%/yrLatest (2025): $7,302 · +58.1% YoY. Source: county tax records.
Cash-flow waterfall
monthlySold comps — $/sqft
last 12 mo · ≤1 miLoading sold comps…