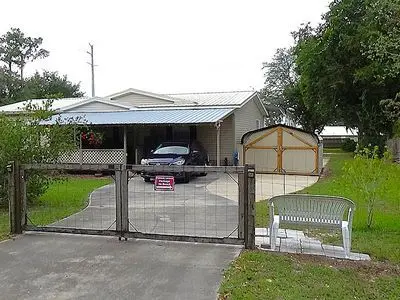
234 SE Rachel Way · Lake City, FL
Flood risk 1/10 · Minimal
- FEMA flood zone
- X (unshaded)
- Chance of flooding over 30 yrs
- 0.0%
- Est. flood insurance / yr
- $507 – $1,088
Fire risk 6/10 · Moderate
- Est. fire insurance / yr
- $947 – $1,759
Heat risk 8/10 · Major
- Hot days now (above 107°F)
- 7 days/yr
- Hot days in 30 yrs
- 21 days/yr
Wind risk 9/10 · Severe
- Chance of severe wind over 30 yrs
- 99.0%
Air-quality risk 5/10 · Moderate
- Unhealthy air days now
- 9 days/yr
- Unhealthy air days in 30 yrs
- 10 days/yr
Risk factors via First Street. Map © Google.
Why this score? — see what drove the D+ grade
The composite is a weighted blend of 9 inputs, each scored 0–100. Each bar is that input's sub-score; the figure is the points it added to the 100-point composite (weight × sub-score).
- Cash flow +17.6/30.0
- Appreciation +10.0/10.0
- DSCR +5.5/10.0
- Schools +4.5/10.0
- Livability +3.7/5.0
- 1% rule +3.6/10.0
- Rent growth +2.5/5.0
- Condition / age +2.5/5.0
- ARV discount +0.0/15.0
$209,900
🖨 Deal sheet 📄 Offer letter ✓ Due diligence
Listing remarks
Motivated Seller! What you would love about this 3BR/2BA home is not just the attractive interior but also the 18×30 graveled RV port with full RV hookups, the paved 12×20 carport, and 2 storage sheds, and that's not all; this home also had a new drain field installed in 2023 and a metal roof installed in 2020, offering years of low-maintenance living and peace of mind. In addition, you can relax on the welcoming covered front porch complete with a swing, enjoy grilling on your covered back porch, or hang out in a man cave lean-to. The fully fenced yard is also accented by fruit trees providing privacy and enjoyment. It is conveniently located 9 minutes to Winn-Dixie and 14 minu
Key facts
- Metal roof
- Vaulted ceiling
- Front porch
Tags
Neighborhood map
What this means for you Summary
Snapshot
- This is a 3-bed/2.0-bath manufactured listed at $210k.
Deal economics
- At list price, monthly cash flow is $164 ($2k/yr) — positive.
- The deal already cash-flows at list — no discount required.
- To meet the 1% rule (rent ≥ 1% of price), the offer needs to be $180k (14.1% below list).
- Recommended offer: $180k (14.1% below list) — sets the bar for 1% rule.
- Cap rate 7.2% vs local median 3.7% in Lake City — top-decile yield for the area; either an underpriced asset or a hidden risk that comps aren't pricing in. Stress-test before assuming the spread holds.
Location & tenants
- Location reads 73/100 on livability (#304 in FL) — a middle-class / working-renter tenant base. Strengths: cost of living A+, housing A+, health & safety A+; Watch: amenities C-, commute F, employment F.
- Columbia (town): math 53% / reading 54% proficiency, ranked #25 of 73 in FL (top 34%) — acceptable for families but not a draw, mixed tenant base, ~2y average lease.
- Market conditions: 143 active listings in the ZIP; 178 units permitted in Columbia County in 2024 (0 in 5+ unit buildings).
- This rent runs 39% of the median local income ($55k/yr) — at the standard rent-burdened threshold; future hikes will face affordability resistance.
Forward outlook
- In year one you build about $22k of equity ($1k loan paydown + $21k appreciation (10.0% local appreciation)).
- Columbia County population projected to shrink 7% by 2050 — rents likely to lag national; underwrite the cash flow, not the appreciation.
- At projected returns (10.0% appreciation + 3.0% rent growth), your $59k cash investment doubles in ~3 years — after that, you're playing with house money.
- By year 2, paydown + projected appreciation supports a ~$36k cash-out refi (75% LTV) — recoverable capital for the next deal without selling this one.
Negotiation context
- Only 12 days on market — expect competitive offers; lowballing is unlikely to land.
- Current owner paid $60k; list at $210k implies a 247% gain — meaningful room to come down on a strong offer.
Risks & watch-outs
- Climate carrying-cost: severe wind risk, 99% chance of damaging wind over 30y; major wildfire risk; extreme-heat days projected 7→21/yr by 2055 (HVAC capex compounding) — expect insurance premiums to compound above CPI over the hold.
Questions for the listing agent
- Is there a deadline driving the sale (1031 exchange, divorce, estate, relocation)? That informs how much negotiation room exists.
- Schools are B-rated — typically a magnet for longer-tenancy family renters. What's the average tenant stay here, and is there a school-zone premium baked into asking?
- The area grade is low — what's the realistic commute time and amenity access for the typical tenant pool here? Any planned neighborhood developments (good or bad) we should know about?
- What's the average days-on-market for RENTAL listings here right now (not sales)? A rising rental-DOM trend means longer vacancies and softer asking-rent achievability than the comps imply.
- What's the recent tenant-quality profile in this submarket — average credit score on applications, eviction rate, late-payment / NSF rate, and stable-employment percentage? A property-management company in the area should have these aggregated.
- How much new for-sale + rental construction is in the pipeline within 1–3 miles? Heavy new supply typically softens prices + rents 12–24 months out; constrained supply supports both.
Investment metrics
- 1% rule
- 0.86% ✗
- Cap rate
- 7.23%
- Cash-on-cash
- 3.35%
- DSCR
- 1.15
- GRM
- 9.7
CMA / ARV
- ARV (on-the-fly)
- $150,228
- Comps found
- 5
Show comp detail 5 sales within ~0.75 mi
| Address | Dist | Beds/Ba | Sqft | Sold | Price | $/sf | Match |
|---|---|---|---|---|---|---|---|
| 168 SE Faye Ln | 0.17mi | 4/2.0 (+1) | 1,560 (+11%) | 9mo | $205,000 | $131 | 61 |
| 217 SE Pearl Ter | 0.60mi | 2/2.0 (-1) | 1,370 (-2%) | 3mo | $125,000 | $91 | 60 |
| 220 SE Pearl Ter | 0.60mi | 2/2.0 (-1) | 1,456 (+4%) | 4mo | $156,000 | $107 | 57 |
| 244 SE Becky Ter | 0.47mi | 3/2.0 | 1,352 (-4%) | 20mo | $95,000 | $70 | 55 |
| 324 SE Pearl Ter | 0.50mi | 2/2.0 (-1) | 1,200 (-14%) | 6mo | $135,000 | $113 | 43 |
Match score weights: distance 35% · size 25% · config 20% · recency 20%. Top-matched comps best support the ARV.
Projected returns pro-forma
10.0% appreciation · 3.0% rent growth · sell at horizon
- IRR
- 26.7%
- Equity multiple
- 3.12×
- Total profit
- $124,664
- Equity at exit
- $189,095
- IRR
- 23.3%
- Equity multiple
- 7.10×
- Total profit
- $358,731
- Equity at exit
- $407,790
Cash invested: $58,772 (down + closing). Projections, not guarantees.
Landlord ↔ Tenant lean methodology
- Overall (STATE)
- 87 Strongly Landlord-Friendly
- State Florida
- 87 Strongly Landlord-Friendly · R+3
- County
- — inherits STATE
- City
- — inherits STATE
ZIP-level market 32025
- Home prices YoY
- 6.8%
- Active inventory
- 143
- Price-to-rent
- 9.7×
Monthly cashflow live
- Estimated rent
- $1,804 medium interval (Pro) →
- Mortgage (P&I)
- −$1,101
- Tax from tax record
- −$73 /mo · $876/yr
- Insurance
- −$87
- HOA
- −$0
- Vacancy / Maint / Mgmt
- −$379
- Net cashflow
- $164
Break-even live
UW: 25.0% down · 7.5% · 30yr · 1.5% tax · 5.0% vac · 8.0% maint · 8.0% mgmt
Financing live
Cash to close
- Down payment
- $52,475
- Closing costs
- $6,297
- Reserves months
- —
- Total cash needed
- —
Loan-product check · same deal, 3 products live
Conventional
25% down · 7.5% · 30yr
- Down + closing
- —
- Monthly P&I
- —
- Monthly cashflow
- —
- DSCR
- —
- Eligible?
- —
Personal DTI + credit; lowest rate.
DSCR
20% down · 8.5% · 30yr
- Down + closing
- —
- Monthly P&I
- —
- Monthly cashflow
- —
- DSCR
- —
- Eligible?
- —
No personal income docs; deal must DSCR.
Hard money
10% down · 12.0% · 12mo
- Down + closing
- —
- Monthly P&I
- —
- Monthly cashflow
- —
- DSCR
- —
- Eligible?
- —
Short-term bridge; refi at stabilization.
Listing history 19 events
-
2026-06-19remarks 687-char remark
-
2026-06-19pricedays on market $209,900 Active 12 DOM
-
2026-06-18days on market $214,900 Active 11 DOM
-
2026-06-17days on market $214,900 Active 10 DOM
-
2026-06-16days on market $214,900 Active 9 DOM
-
2026-06-15days on market $214,900 Active 8 DOM
-
2026-06-14days on market $214,900 Active 6 DOM
-
2026-06-12pricedays on market $214,900 Active 5 DOM
-
2026-06-09days on market $219,900 Active 2 DOM
-
2026-06-08pricedays on market $219,900 Active 1 DOM
-
2026-06-07days on market $240,000 Active 19 DOM
-
2026-06-05days on market $240,000 Active 16 DOM
-
2026-06-03days on market $240,000 Active 15 DOM
-
2026-06-02days on market $240,000 Active 14 DOM
-
2026-06-01days on market $240,000 Active 13 DOM
-
2026-05-31days on market $240,000 Active 12 DOM
-
2026-05-30days on market $240,000 Active 11 DOM
-
2026-05-20$240,000 Active
-
2014-10-27soldstatus $60,500
ⓘ Source: listings_history table (triggers on properties + properties_extension) + one-shot
backfill from property_details.listing_events for pre-trigger history.
Tax reassessment forecast FL · Resets to sale price
- Current annual tax
- $876 · $73/mo
- Projected year-2 tax
- $1,742 · $145/mo
- Expected delta
- +$866/yr (+$72/mo · 98.8%)
ⓘ Screening estimate from a state-policy table — verify with the county assessor before closing.
Climate risk First Street
- Flood 1/10 Low FEMA zone X (unshaded) · 0% chance over 30 yrs
- Wildfire 6/10 Major
- Heat 8/10 Severe 7 d/yr ≥107°F today · 21 d/yr by 30 yrs out
- Wind 9/10 Extreme 99% chance of damaging wind over 30 yrs
- Air quality 5/10 Major 9 unhealthy d/yr today · 10 by 30 yrs out
Nearby sold comps map
Loading sold comps map…
Walkable amenities ~0.75 mi
Loading nearby amenities…
Taxation est. · year 1
- Rental income
- $21,647
- − Mortgage interest
- −$11,758
- − Property taxes
- −$876
- − Insurance
- −$1,050
- − Repairs & maintenance
- −$1,732
- − Management
- −$1,732
- − Depreciation
- −$6,106
- Taxable loss
- −$1,606
- Est. tax savings @ 24.0%
- +$386
- After-tax cash flow
- $2,352/yr
For passive investors: Depreciation is non-cash, so a rental often shows a tax loss while cash-flowing — sheltering income. Rental losses are passive: they offset passive income freely, and up to $25,000/yr can offset ordinary (W-2) income if you actively participate and your MAGI is under $100k (phasing out to $0 by $150k); unused losses carry forward. On sale, claimed depreciation is recaptured at up to 25%, and gains may owe capital-gains tax (a 1031 exchange can defer both). Figures are a year-1 estimate at your 24.0% rate — not tax advice; consult a CPA.
Schools (NCES district)
- District
- Columbia
- NCES district ID
- 1200360
- Math proficiency
- 53% ▼ -10.00%
- Reading proficiency
- 54% ▼ -3.00%
- Median HH income
- $40,053
- Composite
- 44.74/100
- National rank
- #2750
- State rank
- #25 of 73 in FL
Livability — Lake City
- Score
- 73/100
- State rank
- #304
- US rank
- #5154
Category grades
Schools grade is shown separately in the Schools card above.
Census & demographics
- County
- Columbia County · 40,507 people
- City population
- 40,507
- Metro
- Lake City, FL
- Population (ZIP)
- 22,948
- Household income
- $55,004
- Rent vs Own
- Severe rent burden
- 754.0
Population outlook (Columbia County) Hauer SSP2
- Today (2025)
- 68,129 people
- By 2030
- 67,501 · -0.9%
- By 2040
- 65,465 · -3.9%
- By 2050
- 63,058 · -7.4%
- By 2075
- 56,291 · -17.4%
- By 2100
- 45,243 · -33.6%
Race, ethnicity, and origin ACS 2023
- Neighborhood character
- Predominantly White (67%)
- Race & ethnicity
- White 67% Black 20% Hispanic / Latino 8% Two or more races 7%
- Hispanic origin (detail)
- Mexican 1% Puerto Rican 3% Cuban 1%
- Common ancestry
- Serbian 2% Lithuanian 2% Romanian 2%
- Foreign-born
- 3% · Canada
- Languages at home
- 91% English-only · Spanish 6% French/Haitian/Cajun 2%
Political lean MEDSL · Columbia
- 2024 margin
- Solid R (+50.2) · D 24.6% · R 74.7%
- 2008→2024 swing
- -16.4pp toward R · 2008: -33.8pp · 2024: -50.2pp
- All cycles
- 2024: R+50.2 2020: R+45.2 2016: R+44.5 2012: R+36.7 2008: R+33.8
Not yet ingested
- Civics
- —
Market trends
- HPI YoY
- ▲ 17.57%
- Current HPI
- 276.7253
- Rent YoY
- —
- Metro
- Lake City, FL
- State GDP YoY
- ▲ 3.28%
- F500 in state
- 36
Industry mix (Fortune 500 HQ in FL)
| Industry | F500 HQs | Revenue |
|---|---|---|
| Industrial Technology | 2 | $29B |
|
||
| Insurance | 2 | $17B |
|
||
| Retail | 1 | $60B |
|
||
| Technology Distribution | 1 | $58B |
|
||
| Homebuilding | 1 | $35B |
|
||
| Technology Manufacturing | 1 | $35B |
|
||
Price history
+296.7% since first listed2 events — show timeline
- 2026-05-20 Listed $240,000 FSBO.com
- 2014-10-27 Sold (Public Records) $60,500 Public Records
Property tax history
-3.1%/yrLatest (2025): $876 · -0.8% YoY. Source: county tax records.
Cash-flow waterfall
monthlySold comps — $/sqft
last 12 mo · ≤1 miLoading sold comps…