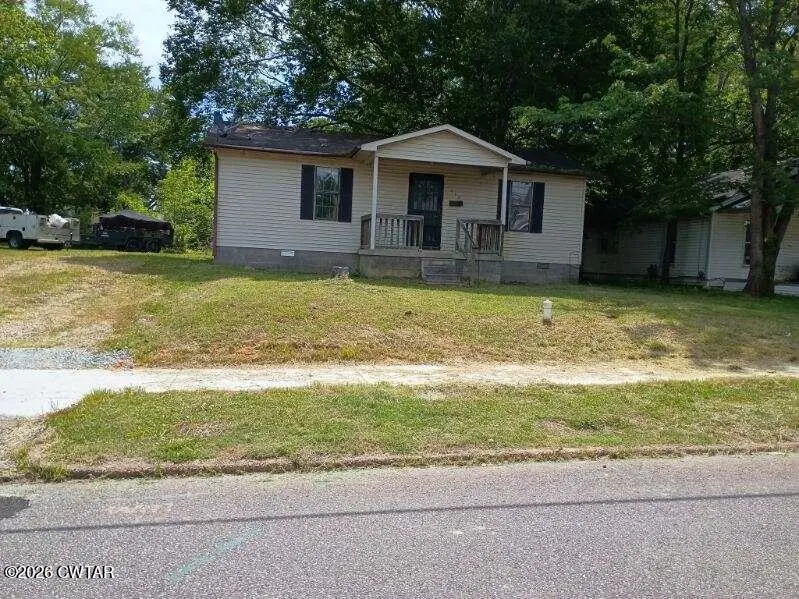
217 Irvine St · Paris, TN
Flood risk 1/10 · Minimal
- FEMA flood zone
- X (unshaded)
- Chance of flooding over 30 yrs
- 0.0%
- Est. flood insurance / yr
- $507 – $1,088
Fire risk 3/10 · Minor
- Est. fire insurance / yr
- $949 – $1,763
Heat risk 6/10 · Moderate
- Hot days now (above 107°F)
- 7 days/yr
- Hot days in 30 yrs
- 20 days/yr
Wind risk 4/10 · Minor
- Chance of severe wind over 30 yrs
- 10.0%
Air-quality risk 1/10 · Minimal
- Unhealthy air days now
- 0 days/yr
- Unhealthy air days in 30 yrs
- 0 days/yr
Risk factors via First Street. Map © Google.
Why this score? — see what drove the B- grade
The composite is a weighted blend of 9 inputs, each scored 0–100. Each bar is that input's sub-score; the figure is the points it added to the 100-point composite (weight × sub-score).
- Cash flow +30.0/30.0
- 1% rule +10.0/10.0
- DSCR +10.0/10.0
- ARV discount +7.5/15.0
- Livability +3.8/5.0
- Schools +3.0/10.0
- Rent growth +2.5/5.0
- Condition / age +2.5/5.0
- Appreciation +0.0/10.0
$35,000
🖨 Deal sheet (PDF) 📄 Offer letter ✓ Due diligence
Listing remarks
Calling all investors, flippers, and handy buyers! This 2-bedroom, 1-bath home is the perfect opportunity to bring your vision to life. Whether you're looking to fix and flip, create a rental, or rebuild, the possibilities are there. Property is being sold as-is. Seller is not making any repairs. The roof will also need repaired/replaced. Bring your imagination and your best offer before its gone! Agent has an ownership interest in Owner/Entity. All information deemed reliable but not guaranteed. Buyer/Buyers Agent to verify.
Key facts
- 7,405 sq ft lot
- Parking
- Built 1992
Property features AI
Finance
- Financial info: Annual tax amount approximately $324.53
Exterior
- Parking: Gravel parking; 1 parking space
- Home design: Single-family residence; Single-story
- Exterior features: Level lot; Lot dimensions approximately 50 x 150; Lot size about 0.17 acres
Interior
- Bedrooms: 2 main-level bedrooms
- Bathrooms: 1 full bathroom on the main level
- Interior features: One-level layout; 3 total rooms; Level lot (yard)
Neighborhood map
What this means for you Summary
Snapshot
- This is a 2-bed/1.0-bath single-family listed at $35k.
Deal economics
- At list price, monthly cash flow is $445 ($5k/yr) — positive.
- The deal already cash-flows at list — no discount required.
- Meets the 1% rule at list price ($848 rent vs $35k).
Location & tenants
- Location reads 75/100 on livability (#13 in TN, #4,115 nationally) — a middle-class / working-renter tenant base. Strengths: cost of living A+, housing A+, health & safety A+; Watch: amenities C-, schools D, commute F.
- Paris (town): math 42% / reading 32% proficiency, ranked #28 of 139 in TN (top 20%) — families likely to look elsewhere, expect single-tenant / working-renter base with shorter leases.
- Market conditions: 186 active listings in the ZIP; 19 units permitted in Henry County in 2024 (0 in 5+ unit buildings).
Forward outlook
- Local home prices are declining (-3.0%/yr); year-one equity from $242 of loan paydown is wiped out by about $1k of value loss. Plan a longer hold.
- Henry County population projected to shrink 10% by 2050 — rents likely to lag national; underwrite the cash flow, not the appreciation.
- At projected returns (-3.0% appreciation + 3.0% rent growth), your $10k cash investment doubles in ~3 years — after that, you're playing with house money.
Negotiation context
- Only 5 days on market — expect competitive offers; lowballing is unlikely to land.
- Current owner paid $26k; 35% above their basis — modest negotiation headroom, anchor on the comps not their cost.
Risks & watch-outs
- Climate carrying-cost: extreme-heat days projected 7→20/yr by 2055 (HVAC capex compounding) — expect insurance premiums to compound above CPI over the hold.
Questions for the listing agent
- Is there a deadline driving the sale (1031 exchange, divorce, estate, relocation)? That informs how much negotiation room exists.
- Schools are D-rated, which usually means shorter tenancies and higher turnover. Who's the typical renter profile here, and what's been the actual vacancy rate?
- What's the average days-on-market for RENTAL listings here right now (not sales)? A rising rental-DOM trend means longer vacancies and softer asking-rent achievability than the comps imply.
- What's the recent tenant-quality profile in this submarket — average credit score on applications, eviction rate, late-payment / NSF rate, and stable-employment percentage? A property-management company in the area should have these aggregated.
- How much new for-sale + rental construction is in the pipeline within 1–3 miles? Heavy new supply typically softens prices + rents 12–24 months out; constrained supply supports both.
Investment metrics
- 1% rule
- 2.42% ✓
- Cap rate
- 21.54%
- Cash-on-cash
- 54.47%
- DSCR
- 3.42
- GRM
- 3.4
CMA / ARV
No comps found within radius.
Projected returns pro-forma
-3.0% appreciation · 3.0% rent growth · sell at horizon
- IRR
- 52.7%
- Equity multiple
- 3.31×
- Total profit
- $22,664
- Equity at exit
- $5,219
- IRR
- 57.9%
- Equity multiple
- 6.74×
- Total profit
- $56,228
- Equity at exit
- $3,026
Cash invested: $9,800 (down + closing). Projections, not guarantees.
Landlord ↔ Tenant lean methodology
- Overall (STATE)
- 87 Strongly Landlord-Friendly
- State Tennessee
- 87 Strongly Landlord-Friendly · R+13
- County
- — inherits STATE
- City
- — inherits STATE
ZIP-level market 38242
- Home prices YoY
- -17.6%
- Active inventory
- 186
- Price-to-rent
- 3.4×
Monthly cashflow live
- Estimated rent
- $848 medium interval (Pro) →
- Mortgage (P&I)
- −$184
- Tax from tax record
- −$27 /mo · $324/yr
- Insurance
- −$15
- HOA
- −$0
- Vacancy / Maint / Mgmt
- −$178
- Net cashflow
- $445
Break-even live
Sensitivity live
| Price | -10% $465 | -5% $455 | +0% $445 | +5% $435 | +10% $425 |
|---|---|---|---|---|---|
| Rent | -10% $378 | -5% $411 | +0% $445 | +5% $478 | +10% $512 |
| Rate | -1.0pp $462 | -0.5pp $454 | base $445 | +0.5pp $436 | +1.0pp $427 |
UW: 25.0% down · 7.5% · 30yr · 1.5% tax · 5.0% vac · 8.0% maint · 8.0% mgmt
Financing live
Cash to close
- Down payment
- $8,750
- Closing costs
- $1,050
- Reserves months
- —
- Total cash needed
- —
Loan-product check · same deal, 3 products live
Conventional
25% down · 7.5% · 30yr
- Down + closing
- —
- Monthly P&I
- —
- Monthly cashflow
- —
- DSCR
- —
- Eligible?
- —
Personal DTI + credit; lowest rate.
DSCR
20% down · 8.5% · 30yr
- Down + closing
- —
- Monthly P&I
- —
- Monthly cashflow
- —
- DSCR
- —
- Eligible?
- —
No personal income docs; deal must DSCR.
Hard money
10% down · 12.0% · 12mo
- Down + closing
- —
- Monthly P&I
- —
- Monthly cashflow
- —
- DSCR
- —
- Eligible?
- —
Short-term bridge; refi at stabilization.
Listing history 3 events
-
2026-05-18status Pending
-
2026-05-13$35,000 Active
-
1992-06-12soldstatus $25,975
ⓘ Source: listings_history table (triggers on properties + properties_extension) + one-shot
backfill from property_details.listing_events for pre-trigger history.
Tax reassessment forecast TN · Resets to sale price
- Current annual tax
- $324 · $27/mo
- Projected year-2 tax
- $324 · $27/mo
- Expected delta
- $0/yr ($0/mo · 0.0%)
ⓘ Screening estimate from a state-policy table — verify with the county assessor before closing.
Climate risk First Street
- Flood 1/10 Low FEMA zone X (unshaded) · 0% chance over 30 yrs
- Wildfire 3/10 Moderate
- Heat 6/10 Major 7 d/yr ≥107°F today · 20 d/yr by 30 yrs out
- Wind 4/10 Moderate 10% chance of damaging wind over 30 yrs
- Air quality 1/10 Low 0 unhealthy d/yr today · 0 by 30 yrs out
Nearby sold comps map
Loading sold comps map…
Walkable amenities ~0.75 mi
Loading nearby amenities…
Taxation est. · year 1
- Rental income
- $10,177
- − Mortgage interest
- −$1,961
- − Property taxes
- −$324
- − Insurance
- −$175
- − Repairs & maintenance
- −$814
- − Management
- −$814
- − Depreciation
- −$1,018
- Taxable income
- $5,071
- Est. tax owed @ 24.0%
- −$1,217
- After-tax cash flow
- $4,121/yr
For passive investors: Depreciation is non-cash, so a rental often shows a tax loss while cash-flowing — sheltering income. Rental losses are passive: they offset passive income freely, and up to $25,000/yr can offset ordinary (W-2) income if you actively participate and your MAGI is under $100k (phasing out to $0 by $150k); unused losses carry forward. On sale, claimed depreciation is recaptured at up to 25%, and gains may owe capital-gains tax (a 1031 exchange can defer both). Figures are a year-1 estimate at your 24.0% rate — not tax advice; consult a CPA.
Schools (NCES district)
- District
- Paris
- NCES district ID
- 4703360
- Math proficiency
- 42% ▼ -4.00%
- Reading proficiency
- 32% ▼ -2.00%
- Median HH income
- $30,045
- Composite
- 30.15/100
- National rank
- #6330
- State rank
- #28 of 139 in TN
Livability — Paris
- Score
- 75/100
- State rank
- #13
- US rank
- #4115
Category grades
Schools grade is shown separately in the Schools card above.
Census & demographics
- Census place
- Paris, TN
- City population
- 19,619
- Population (ZIP)
- 19,619
Population outlook (Henry County) Hauer SSP2
- Today (2025)
- 31,750 people
- By 2030
- 31,277 · -1.5%
- By 2040
- 30,064 · -5.3%
- By 2050
- 28,675 · -9.7%
- By 2075
- 25,767 · -18.8%
- By 2100
- 22,318 · -29.7%
Race, ethnicity, and origin ACS 2023
- Neighborhood character
- Predominantly White (84%)
- Race & ethnicity
- White 84% Black 10% Two or more races 4% Hispanic / Latino 2%
- Common ancestry
- Slovak 2% Italian 1% Serbian 1%
- Foreign-born
- 1% · Canada
- Languages at home
- 96% English-only · German/W. Germanic 2% Spanish 2%
Political lean MEDSL · Henry
- 2024 margin
- Solid R (+55.3) · D 21.8% · R 77.1% · Other 1.1%
- 2008→2024 swing
- -33.0pp toward R · 2008: -22.4pp · 2024: -55.3pp
- All cycles
- 2024: R+55.3 2020: R+51.1 2016: R+49.8 2012: R+30.2 2008: R+22.4
Not yet ingested
- Civics
- —
Market trends
- HPI YoY
- ▼ -49.93%
- Current HPI
- 234.3442
- Rent YoY
- —
- Metro
- —
- State GDP YoY
- ▲ 2.78%
- F500 in state
- 22
Industry mix (Fortune 500 HQ in TN)
| Industry | F500 HQs | Revenue |
|---|---|---|
| Healthcare | 3 | $91B |
|
||
| Retail | 3 | $72B |
|
||
| Transportation / Logistics | 1 | $88B |
|
||
| Paper / Packaging | 1 | $19B |
|
||
| Insurance | 1 | $13B |
|
||
| Energy | 1 | $12B |
|
||
Price history
+34.7% since first listed3 events — show timeline
- 2026-05-18 Pending — CWTAR
- 2026-05-13 Listed $35,000 CWTAR
- 1992-06-12 Sold (Public Records) $25,975 Public Records
Property tax history
+0.7%/yrLatest (2025): $324 · +1.9% YoY. Source: county tax records.
Cash-flow waterfall
monthlySold comps — $/sqft
last 12 mo · ≤1 miLoading sold comps…