15509 SE Mill Plain Blvd #73 · Vancouver, WA
Flood risk No data
- FEMA flood zone
- —
- Chance of flooding over 30 yrs
- —
- Est. flood insurance / yr
- —
Fire risk No data
- Est. fire insurance / yr
- —
Heat risk No data
- Hot days now (above threshold)
- —
- Hot days in 30 yrs
- —
Wind risk No data
- Chance of severe wind over 30 yrs
- —
Air-quality risk No data
- Unhealthy air days now
- —
- Unhealthy air days in 30 yrs
- —
Risk factors via First Street. Map © Google.
Why this score? — see what drove the B grade
The composite is a weighted blend of 9 inputs, each scored 0–100. Each bar is that input's sub-score; the figure is the points it added to the 100-point composite (weight × sub-score).
- Cash flow +30.0/30.0
- 1% rule +10.0/10.0
- DSCR +10.0/10.0
- ARV discount +6.6/15.0
- Schools +4.3/10.0
- Livability +4.1/5.0
- Rent growth +2.8/5.0
- Condition / age +2.5/5.0
- Appreciation +0.0/10.0
$97,000
🖨 Deal sheet (PDF) 📄 Offer letter ✓ Due diligence
Listing remarks
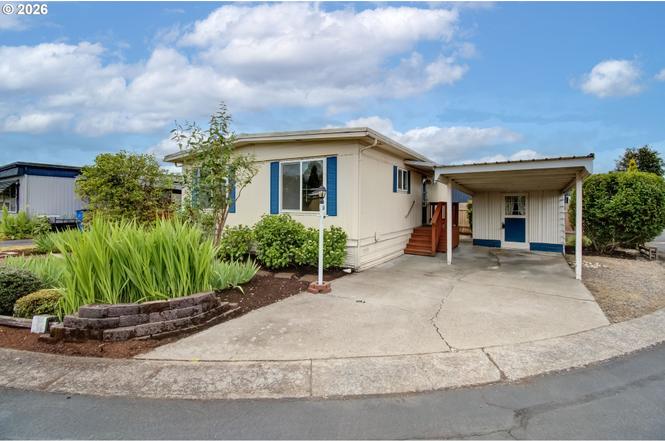
Affordable Living in a Convenient Vancouver Location! Welcome to Space #73 at Fran Mar Mobile Home Park, a well-maintained 2-bedroom, 1-bath home offering 942 square feet of comfortable living space. Inside, you'll find a functional floor plan with laminate flooring throughout the main living areas and bedrooms, freshly painted interior, new kitchen cabinets and counter tops creating a clean and low-maintenance living environment. The kitchen comes equipped with a free-standing range, refrigerator, dishwasher, and range hood, while the washer and dryer are included for added convenience. Central air conditioning and forced-air heating provide year-round comfort. Enjoy outdoor living on the
Key facts
- Covered deck
- Laminate flooring
- Spacious deck area
Tags
Property features AI
Finance
- Other: Property is a resale manufactured home; not attached
- Financial info: Land lease expires December 31, 2026
- HOA & community: Fran-Mar park (senior community); Association provides grounds maintenance, management, meeting room, sewer, trash and water services; Land lease (monthly lot rent) — land lease in effect
Exterior
- Parking: Carport; On-street parking
- Utilities: Public water; Community sewer and septic tank; Electric service (electric hot water and fuel)
- Home design: Manufactured home in a park (residential); Single-story main living area; Seasonal view
- Construction: Built in 1971; Skirting foundation
- Exterior features: Metal roof; Covered deck and open deck; Tool shed; Aluminum exterior siding; Level, seasonal lot; Concrete and paved road access
Interior
- Kitchen: Dishwasher; Free‑standing range; Free‑standing refrigerator; Range hood
- Bedrooms: Primary bedroom on the main level with closet and laminate flooring; Second bedroom on the main level with closet and laminate flooring
- Flooring: Laminate flooring
- Bathrooms: One full bathroom (main level)
- Heating & cooling: Forced air heating; Central air conditioning
- Interior features: Laminate flooring throughout main living areas; Washer and dryer present; Vinyl window frames; Crawl space foundation access
- Laundry & utility: Washer and dryer included; Electric hot water
Neighborhood map
What this means for you Summary
Snapshot
- This is a 2-bed/2.0-bath manufactured listed at $97k.
Deal economics
- At list price, monthly cash flow is $796 ($10k/yr) — positive.
- The deal already cash-flows at list — no discount required.
- Meets the 1% rule at list price ($2k rent vs $97k).
- Cap rate 16.1% vs local median 2.7% in Vancouver — top-decile yield for the area; either an underpriced asset or a hidden risk that comps aren't pricing in. Stress-test before assuming the spread holds.
Location & tenants
- Location reads 82/100 on livability (#62 in WA, #1,133 nationally) — a professional / high-income tenant draw. Strengths: amenities A+, commute A+, housing A+; Watch: crime F, cost of living D-.
- Evergreen School District (Clark) (urban): math 41% / reading 51% proficiency, ranked #164 of 291 in WA (top 56%) — families likely to look elsewhere, expect single-tenant / working-renter base with shorter leases.
- Zoned schools: Mill Plain Elementary School (284 students, 70% FRL); Shahala Middle School (874 students, 44% FRL); Open Doors Evergreen (109 students, 72% FRL) — zoned schools average 62% FRL vs 39% district-wide (23 pts higher); higher-poverty schools than district average — tighter screening recommended.
- Market conditions: Rents rising (+1.2%/yr); 304 active listings in the ZIP; 40 comparable units currently listed for rent nearby; rentals leasing fast (median 9d on market — plan ~1-2 weeks tenant-placement turnaround); solid renter incomes; 3,547 units permitted in Clark County in 2024 (1,361 in 5+ unit buildings).
Forward outlook
- Local home prices are declining (-3.0%/yr); year-one equity from $671 of loan paydown is wiped out by about $3k of value loss. Plan a longer hold.
- Clark County population projected at +29% by 2050 — long-run rental-demand tailwind backs the buy-and-hold thesis.
- At projected returns (-3.0% appreciation + 1.2% rent growth), your $27k cash investment doubles in ~4 years — after that, you're playing with house money.
Negotiation context
- Only 11 days on market — expect competitive offers; lowballing is unlikely to land.
Questions for the listing agent
- Built in 1971 — when were the roof, HVAC, electrical panel, plumbing, and water heater last replaced?
- Is there a deadline driving the sale (1031 exchange, divorce, estate, relocation)? That informs how much negotiation room exists.
- Crime grade is F in this area — have there been break-ins, vandalism, or insurance claims at this property in the last 3 years? What carrier currently insures it and at what premium?
- What's the average days-on-market for RENTAL listings here right now (not sales)? A rising rental-DOM trend means longer vacancies and softer asking-rent achievability than the comps imply.
- What's the recent tenant-quality profile in this submarket — average credit score on applications, eviction rate, late-payment / NSF rate, and stable-employment percentage? A property-management company in the area should have these aggregated.
- How much new for-sale + rental construction is in the pipeline within 1–3 miles? Heavy new supply typically softens prices + rents 12–24 months out; constrained supply supports both.
Investment metrics
- 1% rule
- 1.79% ✓
- Cap rate
- 16.13%
- Cash-on-cash
- 35.15%
- DSCR
- 2.56
- GRM
- 4.7
CMA / ARV
- ARV (on-the-fly)
- $95,142
- Comps found
- 5
Show comp detail 5 sales within ~0.75 mi
| Address | Dist | Beds/Ba | Sqft | Sold | Price | $/sf | Match |
|---|---|---|---|---|---|---|---|
| 15509 SE Mill Plain Blvd | 0.00mi | 2/1.0 | 928 (-2%) | 3mo | $80,000 | $86 | 91 |
| 15509 SE Mill Plain Blvd #98 | 0.00mi | 2/2.0 | 1,000 (+6%) | 13mo | $130,000 | $130 | 79 |
| 15411 SE Mill Plain Blvd Blvd Unit A-9 | 0.09mi | 2/1.0 | 840 (-11%) | 1mo | $75,000 | $89 | 73 |
| 15411 SE Mill Plain Blvd Unit B12 | 0.09mi | 2/1.0 | 910 (-3%) | 17mo | $95,000 | $104 | 72 |
| 15509 SE Mill Plain Blvd #18 | 0.00mi | 2/1.0 | 800 (-15%) | 6mo | $80,500 | $101 | 66 |
Match score weights: distance 35% · size 25% · config 20% · recency 20%. Top-matched comps best support the ARV.
Projected returns pro-forma
-3.0% appreciation · 1.16% rent growth · sell at horizon
- IRR
- 28.7%
- Equity multiple
- 2.17×
- Total profit
- $31,765
- Equity at exit
- $14,463
- IRR
- 35.1%
- Equity multiple
- 3.96×
- Total profit
- $80,311
- Equity at exit
- $8,387
Cash invested: $27,160 (down + closing). Projections, not guarantees.
Landlord ↔ Tenant lean methodology
- Overall (STATE)
- 28 Tenant-Leaning
- State Washington
- 28 Tenant-Leaning · D+8
- County
- — inherits STATE
- City
- — inherits STATE
ZIP-level market 98684
- Rents YoY
- 1.2%
- Active inventory
- 304
- Price-to-rent
- 4.7×
Monthly cashflow live
- Estimated rent
- $1,732 high interval (Pro) →
- Mortgage (P&I)
- −$509
- Tax from tax record
- −$24 /mo · $288/yr
- Insurance
- −$40
- HOA
- −$0
- Vacancy / Maint / Mgmt
- −$364
- Net cashflow
- $796
Break-even live
Sensitivity live
| Price | -10% $850 | -5% $823 | +0% $796 | +5% $768 | +10% $741 |
|---|---|---|---|---|---|
| Rent | -10% $659 | -5% $727 | +0% $796 | +5% $864 | +10% $932 |
| Rate | -1.0pp $844 | -0.5pp $820 | base $796 | +0.5pp $770 | +1.0pp $745 |
UW: 25.0% down · 7.5% · 30yr · 1.5% tax · 5.0% vac · 8.0% maint · 8.0% mgmt
Financing live
Cash to close
- Down payment
- $24,250
- Closing costs
- $2,910
- Reserves months
- —
- Total cash needed
- —
Loan-product check · same deal, 3 products live
Conventional
25% down · 7.5% · 30yr
- Down + closing
- —
- Monthly P&I
- —
- Monthly cashflow
- —
- DSCR
- —
- Eligible?
- —
Personal DTI + credit; lowest rate.
DSCR
20% down · 8.5% · 30yr
- Down + closing
- —
- Monthly P&I
- —
- Monthly cashflow
- —
- DSCR
- —
- Eligible?
- —
No personal income docs; deal must DSCR.
Hard money
10% down · 12.0% · 12mo
- Down + closing
- —
- Monthly P&I
- —
- Monthly cashflow
- —
- DSCR
- —
- Eligible?
- —
Short-term bridge; refi at stabilization.
Rent comps 40 comps
| Address | Beds | Baths | Sqft | Rent | $/sqft | DOM | Units | Dist |
|---|---|---|---|---|---|---|---|---|
| 1000 SE 160th Ave Unit CC-231 -ADA Vancouver, WA | 1.0 | 1.0 | 620 | $1,295 | $2.09 | 45d | 1 | 0.14mi |
| 1000 SE 160th Ave Unit RR-342 Vancouver, WA | 2.0 | 2.0 | 906 | $1,600 | $1.77 | 25d | 1 | 0.14mi |
| 1000 SE 160th Ave Unit RR-336 Vancouver, WA | 2.0 | 2.0 | 906 | $1,600 | $1.77 | 17d | 1 | 0.14mi |
| 1000 SE 160th Ave Apt M104 Vancouver, WA | 2.0 | 2.0 | 906 | $1,600 | $1.77 | 9d | 1 | 0.14mi |
| 1000 SE 160th Ave Apt FF257 Vancouver, WA | 3.0 | 2.0 | 1050 | $1,950 | $1.86 | 45d | 1 | 0.14mi |
| 1000 SE 160th Ave Apt N116 Vancouver, WA | 2.0 | 2.0 | 906 | $1,600 | $1.77 | 19d | 1 | 0.14mi |
| 1000 SE 160th Ave Apt V170 Vancouver, WA | 1.0 | 1.0 | 620 | $1,425 | $2.30 | 45d | 1 | 0.14mi |
| 1000 SE 160th Ave Unit C-015 Vancouver, WA | 2.0 | 1.0 | 860 | $1,550 | $1.80 | 45d | 1 | 0.14mi |
| 1000 SE 160th Ave Apt DD238 Vancouver, WA | 2.0 | 2.0 | 906 | $1,600 | $1.77 | 45d | 1 | 0.14mi |
| 1020 SE Park Crest Ave Vancouver, WA | 2.0 | 1.0 | 792 | $1,300 | $1.64 | 13d | 1 | 0.19mi |
| 510 SE 157th Ave #35 Vancouver, WA | 2.0 | 2.0 | 1060 | $1,895 | $1.79 | 25d | 1 | 0.25mi |
| 900 SE Park Crest Ave Vancouver, WA | 1.0–2.0 | 1.0 | 750 | $1,730 | $2.31 | 3d | 9 | 0.37mi |
| 14913 SE Mill Plain Blvd Vancouver, WA | 1.0–2.0 | 1.0–2.0 | 939 | $2,000 | $2.13 | 3d | 4 | 0.38mi |
| 16410 SE 5th St Unit G-61 Vancouver, WA | 1.0 | 1.0 | 700 | $1,350 | $1.93 | 21d | 1 | 0.55mi |
| 15501 NE 2nd St Vancouver, WA | 3.0 | 2.0 | 1264 | $2,750 | $2.18 | 3d | 1 | 0.56mi |
| 301 SE 166th Ave Vancouver, WA | 3.0 | 1.0–2.0 | 883 | $1,827 | $2.07 | 9d | 15 | 0.68mi |
| 1707 SE 145th Ct Unit 1707 Vancouver, WA | 2.0 | 2.0 | 1016 | $1,795 | $1.77 | 25d | 1 | 0.68mi |
| 621 SE 168th Ave Vancouver, WA | 2.0–3.0 | 1.0–2.0 | 1125 | $1,649 | $1.47 | 3d | 9 | 0.73mi |
| 621 SE 168th Ave Vancouver, WA | 3.0 | 1.0–2.0 | 869 | $2,079 | $2.39 | 16d | 7 | 0.73mi |
| 16801 SE 1st St Vancouver, WA | 2.0 | 1.0 | 960 | $1,608 | $1.68 | 25d | 1 | 0.74mi |
| 2404 SE 161st Ct Unit X182 Vancouver, WA | 2.0 | 2.0 | 900 | $1,495 | $1.66 | 21d | 1 | 0.78mi |
| 16807 SE 19th St Vancouver, WA | 1.0 | 1.0 | 850 | $1,800 | $2.12 | 4d | 1 | 0.79mi |
| 701 SE 139th Ave Vancouver, WA | 1.0–2.0 | 1.0 | 806 | $1,600 | $1.99 | 4d | 6 | 0.82mi |
| 905 SE 136th Ave Vancouver, WA | 2.0 | 1.0 | 945 | $1,810 | $1.92 | 3d | 2 | 0.94mi |
| 16900 SE 26th Dr Vancouver, WA | 2.0 | 2.0 | 1043 | $1,926 | $1.85 | 3d | 5 | 0.97mi |
| 600 SE 177th Ave Vancouver, WA | 1.0–3.0 | 1.0–2.0 | 931 | $2,030 | $2.18 | 3d | 20 | 0.97mi |
| 17775 SE Mill Plain Blvd Vancouver, WA | 1.0–2.0 | 1.0–2.0 | 732 | $2,353 | $3.21 | 5d | 1 | 1.02mi |
| 16506 SE 29th St Vancouver, WA | 1.0–3.0 | 1.0–2.0 | 1062 | $1,962 | $1.85 | 3d | 13 | 1.03mi |
| 812 SE 136th Ave Vancouver, WA | 1.0–3.0 | 1.0–2.0 | 931 | $1,805 | $1.94 | 4d | 10 | 1.10mi |
| 13601 SE 19th St Vancouver, WA | 1.0–2.0 | 1.0–1.5 | 965 | $2,224 | $2.30 | 9d | 6 | 1.10mi |
| 13307 SE McGillivray Blvd Vancouver, WA | 2.0 | 2.0 | 962 | $1,895 | $1.97 | 4d | 1 | 1.13mi |
| 13314 SE 19th St Vancouver, WA | 1.0–2.0 | 1.0–2.0 | 899 | $2,274 | $2.53 | 4d | 10 | 1.13mi |
| 13213 SE 7th St Vancouver, WA | 2.0–3.0 | 1.0–2.0 | 1097 | $1,500 | $1.37 | 4d | 2 | 1.18mi |
| 3100 SE 168th Ave Vancouver, WA | 1.0–3.0 | 1.0–2.5 | 1040 | $2,205 | $2.12 | 3d | 14 | 1.18mi |
| 333 NE 136th Ave Vancouver, WA | 1.0 | 1.0 | 684 | $1,650 | $2.41 | 4d | 2 | 1.22mi |
| 1520 SE Talton Ave Vancouver, WA | 2.0 | 1.0 | 800 | $1,395 | $1.74 | 21d | 1 | 1.27mi |
| 1604 SE Talton Ave Unit 1604 Vancouver, WA | 2.0 | 1.0 | 889 | $1,450 | $1.63 | 23d | 1 | 1.27mi |
| 1526 SE Talton Ave Vancouver, WA | 2.0 | 1.0 | 900 | $1,450 | $1.61 | 21d | 1 | 1.27mi |
| 14000 SE Cascade Park Dr Vancouver, WA | 2.0 | 1.0 | 1029 | $1,860 | $1.81 | 3d | 2 | 1.28mi |
| 14008 NE 10th St Vancouver, WA | 2.0 | 2.0 | 808 | $1,795 | $2.22 | 5d | 1 | 1.31mi |
Listing history 8 events
-
2026-06-21days on market $97,000 Active 11 DOM
-
2026-06-18days on market $97,000 Active 8 DOM
-
2026-06-17days on market $97,000 Active 7 DOM
-
2026-06-16days on market $97,000 Active 6 DOM
-
2026-06-15days on market $97,000 Active 5 DOM
-
2026-06-13days on market $97,000 Active 3 DOM
-
2026-06-13remarks 699-char remark
-
2026-06-13$97,000 Active 2 DOM
ⓘ Source: listings_history table (triggers on properties + properties_extension) + one-shot
backfill from property_details.listing_events for pre-trigger history.
Tax reassessment forecast WA · Resets to sale price
- Current annual tax
- $288 · $24/mo
- Projected year-2 tax
- $951 · $79/mo
- Expected delta
- +$663/yr (+$55/mo · 230.4%)
ⓘ Screening estimate from a state-policy table — verify with the county assessor before closing.
Nearby sold comps map
Loading sold comps map…
Walkable amenities ~0.75 mi
Loading nearby amenities…
Taxation est. · year 1
- Rental income
- $20,789
- − Mortgage interest
- −$5,434
- − Property taxes
- −$288
- − Insurance
- −$485
- − Repairs & maintenance
- −$1,663
- − Management
- −$1,663
- − Depreciation
- −$2,822
- Taxable income
- $8,434
- Est. tax owed @ 24.0%
- −$2,024
- After-tax cash flow
- $7,522/yr
For passive investors: Depreciation is non-cash, so a rental often shows a tax loss while cash-flowing — sheltering income. Rental losses are passive: they offset passive income freely, and up to $25,000/yr can offset ordinary (W-2) income if you actively participate and your MAGI is under $100k (phasing out to $0 by $150k); unused losses carry forward. On sale, claimed depreciation is recaptured at up to 25%, and gains may owe capital-gains tax (a 1031 exchange can defer both). Figures are a year-1 estimate at your 24.0% rate — not tax advice; consult a CPA.
Schools (NCES district)
- District
- Evergreen School District (Clark)
- NCES district ID
- 5302700
- Math proficiency
- 41% ▼ -3.00%
- Reading proficiency
- 51% ▼ -3.00%
- Median HH income
- $59,418
- Composite
- 42.53/100
- National rank
- #6859
- State rank
- #164 of 291 in WA
Livability — Vancouver
- Score
- 82/100
- State rank
- #62
- US rank
- #1133
Category grades
Schools grade is shown separately in the Schools card above.
Census & demographics
- Census place
- Vancouver, WA
- County
- Clark County · 513,189 people
- City population
- 360,195
- Metro
- Portland-Vancouver-Hillsboro, OR-WA
- Population (ZIP)
- 37,298
- Household income
- $90,620
- Rent vs Own
- Severe rent burden
- 1481.0
Population outlook (Clark County) Hauer SSP2
- Today (2025)
- 529,610 people
- By 2030
- 563,242 · +6.4%
- By 2040
- 625,905 · +18.2%
- By 2050
- 681,558 · +28.7%
- By 2075
- 805,967 · +52.2%
- By 2100
- 877,450 · +65.7%
Race, ethnicity, and origin ACS 2023
- Neighborhood character
- Diverse neighborhood (Simpson 0.56)
- Race & ethnicity
- White 64% Hispanic / Latino 17% Two or more races 14% Asian 6% Pacific Islander 3% Black 2%
- Hispanic origin (detail)
- Mexican 12%
- Common ancestry
- Portuguese 4% Slovak 3% Iranian 2%
- Foreign-born
- 16% · Canada, China, Vietnam
- Languages at home
- 77% English-only · Spanish 10% Other Asian/Pacific 3% Russian/Polish/Slavic 3%
Political lean MEDSL · Clark
- 2024 margin
- Lean D (+7.0) · D 52.1% · R 45.1% · Other 2.8%
- 2008→2024 swing
- +0.9pp no change · 2008: 6.1pp · 2024: 7.0pp
- All cycles
- 2024: D+7.0 2020: D+5.1 2016: D+0.1 2012: D+0.1 2008: D+6.1
Not yet ingested
- Civics
- —
Market trends
- HPI YoY
- ▼ -237.93%
- Current HPI
- 290.416
- Rent YoY
- ▲ 1.16%
- Metro
- Portland-Vancouver-Hillsboro, OR-WA
- State GDP YoY
- ▲ 4.65%
- F500 in state
- 22
Industry mix (Fortune 500 HQ in WA)
| Industry | F500 HQs | Revenue |
|---|---|---|
| Retail | 2 | $269B |
|
||
| Technology / Retail | 1 | $638B |
|
||
| Technology | 1 | $245B |
|
||
| Telecommunications | 1 | $38B |
|
||
| Food / Beverage | 1 | $36B |
|
||
| Automotive / Trucks | 1 | $34B |
|
||
Price history
1 event — show timeline
- 2026-06-10 Listed $97,000 RMLS
Property tax history
+16.0%/yrLatest (2026): $288 · +32.2% YoY. Source: county tax records.
Cash-flow waterfall
monthlySold comps — $/sqft
last 12 mo · ≤1 miLoading sold comps…