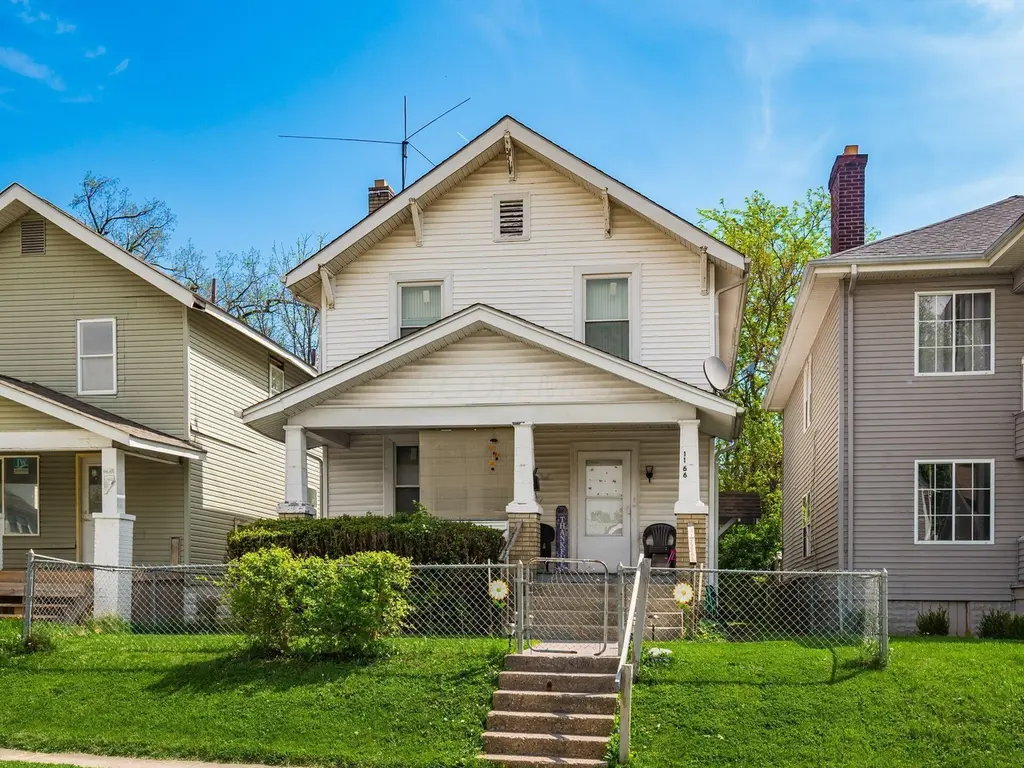
1166 Oakwood Ave · Columbus, OH
Flood risk 1/10 · Minimal
- FEMA flood zone
- X (unshaded)
- Chance of flooding over 30 yrs
- 0.0%
- Est. flood insurance / yr
- $473 – $860
Fire risk 1/10 · Minimal
- Est. fire insurance / yr
- $713 – $1,323
Heat risk 4/10 · Minor
- Hot days now (above 100°F)
- 7 days/yr
- Hot days in 30 yrs
- 18 days/yr
Wind risk 2/10 · Minimal
- Chance of severe wind over 30 yrs
- 1.0%
Air-quality risk 3/10 · Minor
- Unhealthy air days now
- 2 days/yr
- Unhealthy air days in 30 yrs
- 3 days/yr
Risk factors via First Street. Map © Google.
Why this score? — see what drove the D grade
The composite is a weighted blend of 9 inputs, each scored 0–100. Each bar is that input's sub-score; the figure is the points it added to the 100-point composite (weight × sub-score).
- ARV discount +15.0/15.0
- Cash flow +10.0/30.0
- Livability +4.0/5.0
- Rent growth +3.4/5.0
- 1% rule +3.0/10.0
- DSCR +2.8/10.0
- Condition / age +2.5/5.0
- Schools +1.7/10.0
- Appreciation +0.0/10.0
$215,000
🖨 Deal sheet (PDF) 📄 Offer letter ✓ Due diligence
Listing remarks MLS
Wonderful investment opportunity close to Downtown Columbus and Nationwide Children's Hospital. Two story home with nice size yard and welcoming front porch. Fenced rear yard with off-street parking. Furnace in 2019, windows in 2016, roof in 2008. Income producing property!
Key facts
- Downtown columbus
- Nice size yard
- Fenced rear yard
Tags
Neighborhood map
What this means for you Summary
Snapshot
- This is a 3-bed/1.0-bath single-family listed at $215k.
Deal economics
- At list price, monthly cash flow is $-130 ($-2k/yr) — negative.
- To cash-flow at today's rent, offer at most $192k (10.7% below list).
- To meet the 1% rule (rent ≥ 1% of price), the offer needs to be $171k (20.4% below list).
- Recommended offer: $171k (20.4% below list) — sets the bar for 1% rule.
- Cap rate 5.6% vs local median 3.8% in Columbus — top-decile yield for the area; either an underpriced asset or a hidden risk that comps aren't pricing in. Stress-test before assuming the spread holds.
Location & tenants
- Location reads 81/100 on livability (#97 in OH, #1,491 nationally) — a professional / high-income tenant draw. Strengths: commute A+, cost of living A+, housing A+; Watch: employment C-, crime F.
- Columbus City School District (urban): math 15% / reading 26% proficiency, ranked #626 of 656 in OH (top 95%) — low school quality limits family demand, transient renter base, plan for 1-2y turnover; 72% free/reduced lunch — lower-income household profile, screen leases tightly.
- Zoned schools: Indianola Informal K-8 School (math 43% / reading 58%, grade D+, #896 of 1,584 statewide, top 57%, 684 students, 0% FRL); Arts Impact Middle School (Aims) (math 17% / reading 25%, grade F, #608 of 654 statewide, top 93%, 532 students, 0% FRL); South High School (math 10% / reading 26%, grade F, #687 of 781 statewide, top 88%, 903 students, 0% FRL) — zoned schools average 0% FRL vs 72% district-wide (72 pts lower); this property's tenant base skews higher-income than the district average.
- Market conditions: Rents rising (+3.5%/yr); 197 active listings in the ZIP; 40 comparable units currently listed for rent nearby; rentals at typical pace (median 25d on market — plan ~3-4 weeks tenant-placement turnaround); 45% of comp listings sitting > 30 days — soft ceiling on asking rent; solid renter incomes; 8,139 units permitted in Franklin County in 2024 (5,940 in 5+ unit buildings).
Forward outlook
- Local home prices are declining (-3.0%/yr); year-one equity from $1k of loan paydown is wiped out by about $6k of value loss. Plan a longer hold.
- Franklin County population projected at +34% by 2050 — long-run rental-demand tailwind backs the buy-and-hold thesis.
Negotiation context
- It's been on market 53 days — a 3% lower offer ($209k) is reasonable based on typical stale-listing flexibility.
- 6 sale attempts since 28y ago with the ask held roughly flat each time — persistent listings suggest the price (not the market) is what's stuck; bring a comps-based counter.
- Current owner paid $115k; list at $215k implies a 87% gain — meaningful room to come down on a strong offer.
Risks & watch-outs
- Watch-outs: built in 1925 — expect roof / HVAC / electrical / plumbing capex.
Questions for the listing agent
- What do current leases actually rent for vs. the listed asking? Can we see a recent rent roll and the last 12 months of T-12 income?
- It's been on market 53 days. Have you received any prior offers? Is the seller open to a 20% concession, seller financing, or rate buy-down credit?
- Built in 1925 — when were the roof, HVAC, electrical panel, plumbing, and water heater last replaced?
- Is there a deadline driving the sale (1031 exchange, divorce, estate, relocation)? That informs how much negotiation room exists.
- Crime grade is F in this area — have there been break-ins, vandalism, or insurance claims at this property in the last 3 years? What carrier currently insures it and at what premium?
- The area grade is low — what's the realistic commute time and amenity access for the typical tenant pool here? Any planned neighborhood developments (good or bad) we should know about?
- What's the average days-on-market for RENTAL listings here right now (not sales)? A rising rental-DOM trend means longer vacancies and softer asking-rent achievability than the comps imply.
- What's the recent tenant-quality profile in this submarket — average credit score on applications, eviction rate, late-payment / NSF rate, and stable-employment percentage? A property-management company in the area should have these aggregated.
- How much new for-sale + rental construction is in the pipeline within 1–3 miles? Heavy new supply typically softens prices + rents 12–24 months out; constrained supply supports both.
Investment metrics
- 1% rule
- 0.80% ✗
- Cap rate
- 5.57%
- Cash-on-cash
- -2.59%
- DSCR
- 0.88
- GRM
- 10.5
CMA / ARV
- ARV (median comp)
- $269,296
- List price
- $215,000
- Delta
- -20.16%
- Verdict
- UNDERPRICED
- Comps
- 20 within 1.0 mi
Show comp detail 12 sales within ~0.75 mi
| Address | Dist | Beds/Ba | Sqft | Sold | Price | $/sf | Match |
|---|---|---|---|---|---|---|---|
| 792 Thurman Ave | 0.33mi | 3/1.5 | 1,307 (+0%) | 1mo | $280,000 | $214 | 81 |
| 997 Oakwood Ave | 0.24mi | 3/1.5 | 1,260 (-3%) | 2mo | $242,500 | $192 | 80 |
| 1329 Studer Ave | 0.27mi | 3/1.5 | 1,191 (-9%) | 1mo | $212,000 | $178 | 70 |
| 1079 Ellsworth Ave | 0.46mi | 4/1.0 (+1) | 1,336 (+2%) | 1mo | $82,500 | $62 | 68 |
| 1576 Linwood Ave | 0.58mi | 3/1.5 | 1,272 (-2%) | 2mo | $245,000 | $193 | 66 |
| 882 S Gilbert St | 0.45mi | 2/1.0 (-1) | 1,198 (-8%) | 0mo | $195,000 | $163 | 60 |
| 667 E Columbus St | 0.64mi | 3/1.0 | 1,232 (-6%) | 1mo | $268,000 | $218 | 60 |
| 1398 Lockbourne Rd | 0.41mi | 3/2.0 | 1,123 (-14%) | 1mo | $205,000 | $183 | 53 |
| 959 Heyl Ave | 0.48mi | 2/2.5 (-1) | 1,176 (-10%) | 1mo | $260,000 | $221 | 49 |
| 1029 Geers Ave | 0.74mi | 2/1.0 (-1) | 1,412 (+8%) | 1mo | $235,000 | $166 | 46 |
| 605 Frebis Ave | 0.71mi | 3/2.5 | 1,459 (+12%) | 1mo | $345,000 | $236 | 40 |
| 601 Frebis Ave | 0.71mi | 3/2.5 | 1,459 (+12%) | 2mo | $349,000 | $239 | 40 |
Match score weights: distance 35% · size 25% · config 20% · recency 20%. Top-matched comps best support the ARV.
Projected returns pro-forma
-3.0% appreciation · 3.51% rent growth · sell at horizon
- IRR
- -20.0%
- Equity multiple
- 0.30×
- Total profit
- $-42,225
- Equity at exit
- $32,057
- IRR
- -11.9%
- Equity multiple
- 0.27×
- Total profit
- $-43,692
- Equity at exit
- $18,589
Cash invested: $60,200 (down + closing). Projections, not guarantees.
Landlord ↔ Tenant lean methodology
- Overall (STATE)
- 73 Landlord-Friendly
- State Ohio
- 73 Landlord-Friendly · R+6
- County
- — inherits STATE
- City
- — inherits STATE
ZIP-level market 43206
- Rents YoY
- 3.5%
- Active inventory
- 197
- Price-to-rent
- 10.5×
Monthly cashflow live
- Estimated rent
- $1,711 high interval (Pro) →
- Mortgage (P&I)
- −$1,127
- Tax from tax record
- −$265 /mo · $3,175/yr
- Insurance
- −$90
- HOA
- −$0
- Vacancy / Maint / Mgmt
- −$359
- Net cashflow
- $-130
Break-even live
Sensitivity live
| Price | -10% $-8 | -5% $-69 | +0% $-130 | +5% $-191 | +10% $-252 |
|---|---|---|---|---|---|
| Rent | -10% $-265 | -5% $-198 | +0% $-130 | +5% $-63 | +10% $5 |
| Rate | -1.0pp $-22 | -0.5pp $-75 | base $-130 | +0.5pp $-186 | +1.0pp $-243 |
UW: 25.0% down · 7.5% · 30yr · 1.5% tax · 5.0% vac · 8.0% maint · 8.0% mgmt
Financing live
Cash to close
- Down payment
- $53,750
- Closing costs
- $6,450
- Reserves months
- —
- Total cash needed
- —
Loan-product check · same deal, 3 products live
Conventional
25% down · 7.5% · 30yr
- Down + closing
- —
- Monthly P&I
- —
- Monthly cashflow
- —
- DSCR
- —
- Eligible?
- —
Personal DTI + credit; lowest rate.
DSCR
20% down · 8.5% · 30yr
- Down + closing
- —
- Monthly P&I
- —
- Monthly cashflow
- —
- DSCR
- —
- Eligible?
- —
No personal income docs; deal must DSCR.
Hard money
10% down · 12.0% · 12mo
- Down + closing
- —
- Monthly P&I
- —
- Monthly cashflow
- —
- DSCR
- —
- Eligible?
- —
Short-term bridge; refi at stabilization.
Rent comps 40 comps
| Address | Beds | Baths | Sqft | Rent | $/sqft | DOM | Units | Dist |
|---|---|---|---|---|---|---|---|---|
| 1227 S Champion Ave Unit 1227 Columbus, OH | 3.0 | 1.0 | 1110 | $1,195 | $1.08 | 5d | 1 | 0.13mi |
| 1225 S Champion Ave Unit 1225 Columbus, OH | 3.0 | 1.0 | 1110 | $1,095 | $0.99 | 5d | 1 | 0.13mi |
| 1239-1241 S Champion Ave Columbus, OH | 3.0 | 1.0 | 1134 | $1,275 | $1.12 | 17d | 1 | 0.15mi |
| 1118 S Ohio Ave Columbus, OH | 3.0 | 1.5 | 1232 | $1,750 | $1.42 | 45d | 1 | 0.16mi |
| 1288 Linwood Ave Columbus, OH | 3.0 | 1.0 | 1344 | $1,900 | $1.41 | 45d | 1 | 0.19mi |
| 1056 Wilson Ave Unit B Columbus, OH | 2.0 | 1.0 | 1100 | $1,195 | $1.09 | 19d | 1 | 0.22mi |
| 1056 Wilson Ave Unit A Columbus, OH | 2.0 | 1.0 | 1100 | $1,225 | $1.11 | 45d | 1 | 0.22mi |
| 1165-1167 E Whittier St Columbus, OH | 3.0 | 1.5 | 1300 | $1,950 | $1.50 | 45d | 1 | 0.24mi |
| 1167 E Whittier St Columbus, OH | 3.0 | 1.5 | 1300 | $1,950 | $1.50 | 45d | 1 | 0.24mi |
| 997 Oakwood Ave Columbus, OH | 3.0 | 1.5 | 1260 | $1,800 | $1.43 | 14d | 1 | 0.27mi |
| 880 E Whittier St Columbus, OH | 2.0 | 1.5 | 1064 | $1,100 | $1.03 | 45d | 1 | 0.29mi |
| 1210 E Whittier St Columbus, OH | 2.0 | 1.0 | 973 | $1,950 | $2.00 | 45d | 1 | 0.30mi |
| 977 S Ohio Ave Columbus, OH | 3.0 | 2.5 | 1650 | $2,500 | $1.52 | 45d | 1 | 0.32mi |
| 850 E Whittier St Columbus, OH | 3.0 | 2.0 | 1200 | $1,949 | $1.62 | 25d | 1 | 0.33mi |
| 968 Wilson Ave Unit 970 Columbus, OH | 2.0 | 1.0 | 900 | $1,225 | $1.36 | 25d | 1 | 0.34mi |
| 988 Linwood Ave Columbus, OH | 4.0 | 3.0 | 1800 | $2,750 | $1.53 | 19d | 1 | 0.36mi |
| 963 S 22nd St Columbus, OH | 3.0 | 2.0 | 1188 | $3,200 | $2.69 | 9d | 1 | 0.37mi |
| 761 Siebert St Columbus, OH | 2.0 | 2.0 | 1050 | $2,350 | $2.24 | 5d | 1 | 0.38mi |
| 1154 Miller Ave Columbus, OH | 3.0 | 1.0 | 1012 | $1,350 | $1.33 | 16d | 1 | 0.39mi |
| 1416 S Ohio Ave Columbus, OH | 3.0 | 1.5 | 1056 | $1,595 | $1.51 | 23d | 1 | 0.40mi |
| 1460 Oakwood Ave Columbus, OH | 2.0 | 1.0 | 901 | $900 | $1.00 | 16d | 1 | 0.40mi |
| 1460 Oakwood Ave Columbus, OH | 2.0 | 1.0 | 901 | $900 | $1.00 | 45d | 1 | 0.40mi |
| 936 Wagner St Columbus, OH | 3.0 | 3.0 | 1560 | $2,750 | $1.76 | 25d | 1 | 0.41mi |
| 1275-1279 E Kossuth St Columbus, OH | 2.0 | 2.0 | 1160 | $1,350 | $1.16 | 45d | 1 | 0.43mi |
| 932 Linwood Ave Columbus, OH | 4.0 | 1.5 | 1663 | $2,045 | $1.23 | 45d | 1 | 0.43mi |
| 1106 Ellsworth Ave Columbus, OH | 3.0 | 1.0 | 1150 | $1,495 | $1.30 | 9d | 1 | 0.47mi |
| 857 Wilson Ave #859 Columbus, OH | 3.0 | 2.5 | 1527 | $1,650 | $1.08 | 45d | 1 | 0.49mi |
| 975-977 Miller Ave Unit 977 Columbus, OH | 2.0 | 1.5 | 930 | $1,100 | $1.18 | 45d | 1 | 0.50mi |
| 904 Studer Ave Columbus, OH | 3.0 | 1.5 | 1364 | $1,780 | $1.30 | 25d | 1 | 0.51mi |
| 966 S 18th St Columbus, OH | 3.0 | 1.5 | 1428 | $2,400 | $1.68 | 45d | 1 | 0.52mi |
| 814 S Ohio Ave Columbus, OH | 3.0 | 1.0 | 1380 | $1,600 | $1.16 | 45d | 1 | 0.53mi |
| 1026 Ellsworth Ave Columbus, OH | 3.0 | 1.0 | 1100 | $1,295 | $1.18 | 21d | 1 | 0.53mi |
| 928 S 18th St Columbus, OH | 3.0 | 2.0 | 1216 | $1,995 | $1.64 | 45d | 1 | 0.55mi |
| 815 Wilson Ave Columbus, OH | 3.0 | 1.5 | 1400 | $1,500 | $1.07 | 9d | 1 | 0.55mi |
| 813 Wilson Ave Unit 1 Columbus, OH | 3.0 | 1.5 | 1400 | $1,500 | $1.07 | 9d | 1 | 0.56mi |
| 877 Heyl Ave Columbus, OH | 2.0 | 1.0 | 1200 | $1,750 | $1.46 | 45d | 1 | 0.57mi |
| 824 Studer Ave Columbus, OH | 2.0 | 1.0 | 980 | $925 | $0.94 | 19d | 1 | 0.62mi |
| 1257 E Livingston Ave Columbus, OH | 2.0 | 1.0 | 975 | $925 | $0.95 | 21d | 1 | 0.62mi |
| 705 E Columbus St Columbus, OH | 3.0 | 1.0 | 1436 | $2,300 | $1.60 | 45d | 1 | 0.62mi |
| 1267 E Livingston Ave Columbus, OH | 2.0 | 1.0 | 1000 | $925 | $0.93 | 25d | 1 | 0.63mi |
Listing history 24 events
-
2026-06-09days on market $215,000 Active 53 DOM
-
2026-06-08days on market $215,000 Active 52 DOM
-
2026-06-07days on market $215,000 Active 51 DOM
-
2026-06-05days on market $215,000 Active 48 DOM
-
2026-06-03days on market $215,000 Active 47 DOM
-
2026-06-02days on market $215,000 Active 46 DOM
-
2026-06-01days on market $215,000 Active 45 DOM
-
2026-05-31days on market $215,000 Active 44 DOM
-
2026-04-17$215,000 Active 274-char remark
Show marketing remark (274 chars)
Wonderful investment opportunity close to Downtown Columbus and Nationwide Children's Hospital. Two story home with nice size yard and welcoming front porch. Fenced rear yard with off-street parking. Furnace in 2019, windows in 2016, roof in 2008. Income producing property!
-
2019-08-01soldstatus $115,000
-
2019-07-29soldstatus $115,000 Closed 602-char remark
Show marketing remark (602 chars)
Wonderful opportunity to own this home in an up and coming area! Priced to sell and a lot of the major things are done! New Furnace just installed (2019), Newer Windows (2016, Roof was replaced (2008), Fenced yard, central A/C, gorgeous decorative fireplace and with wood built ins! tons of possibilities! Large basement with glass black windows. Fenced back yard with parking in back. Front porch is perfect for enjoying a summer evening. Tenant occupied so please don't disturb tenants. 48 hours notice required to show. Please see A2A remarks. Currently rented Month to Month - section 8 Tenant.
-
2019-07-13status Pending 602-char remark
Show marketing remark (602 chars)
Wonderful opportunity to own this home in an up and coming area! Priced to sell and a lot of the major things are done! New Furnace just installed (2019), Newer Windows (2016, Roof was replaced (2008), Fenced yard, central A/C, gorgeous decorative fireplace and with wood built ins! tons of possibilities! Large basement with glass black windows. Fenced back yard with parking in back. Front porch is perfect for enjoying a summer evening. Tenant occupied so please don't disturb tenants. 48 hours notice required to show. Please see A2A remarks. Currently rented Month to Month - section 8 Tenant.
-
2019-04-19$135,000 Active 602-char remark
Show marketing remark (602 chars)
Wonderful opportunity to own this home in an up and coming area! Priced to sell and a lot of the major things are done! New Furnace just installed (2019), Newer Windows (2016, Roof was replaced (2008), Fenced yard, central A/C, gorgeous decorative fireplace and with wood built ins! tons of possibilities! Large basement with glass black windows. Fenced back yard with parking in back. Front porch is perfect for enjoying a summer evening. Tenant occupied so please don't disturb tenants. 48 hours notice required to show. Please see A2A remarks. Currently rented Month to Month - section 8 Tenant.
-
2003-01-17soldstatus $30,000
-
2002-12-13historical
-
2002-10-23historical
-
2002-10-22$35,000
-
2002-05-05historical
-
2002-04-22$44,900
-
2002-02-22$52,500
-
1999-12-17soldstatus $34,000
-
1999-11-02historical
-
1998-01-23$39,900
-
1991-06-18soldstatus $31,878
ⓘ Source: listings_history table (triggers on properties + properties_extension) + one-shot
backfill from property_details.listing_events for pre-trigger history.
Tax reassessment forecast OH · Partial reset (capped growth)
- Current annual tax
- $3,175 · $265/mo
- Projected year-2 tax
- $3,264 · $272/mo
- Expected delta
- +$90/yr (+$7/mo · 2.8%)
ⓘ Screening estimate from a state-policy table — verify with the county assessor before closing.
Climate risk First Street
- Flood 1/10 Low FEMA zone X (unshaded) · 0% chance over 30 yrs
- Wildfire 1/10 Low
- Heat 4/10 Moderate 7 d/yr ≥100°F today · 18 d/yr by 30 yrs out
- Wind 2/10 Low 100% chance of damaging wind over 30 yrs
- Air quality 3/10 Moderate 2 unhealthy d/yr today · 3 by 30 yrs out
Nearby sold comps map
Loading sold comps map…
Walkable amenities ~0.75 mi
Loading nearby amenities…
Taxation est. · year 1
- Rental income
- $20,528
- − Mortgage interest
- −$12,043
- − Property taxes
- −$3,175
- − Insurance
- −$1,075
- − Repairs & maintenance
- −$1,642
- − Management
- −$1,642
- − Depreciation
- −$6,255
- Taxable loss
- −$5,304
- Est. tax savings @ 24.0%
- +$1,273
- After-tax cash flow
- $-289/yr
For passive investors: Depreciation is non-cash, so a rental often shows a tax loss while cash-flowing — sheltering income. Rental losses are passive: they offset passive income freely, and up to $25,000/yr can offset ordinary (W-2) income if you actively participate and your MAGI is under $100k (phasing out to $0 by $150k); unused losses carry forward. On sale, claimed depreciation is recaptured at up to 25%, and gains may owe capital-gains tax (a 1031 exchange can defer both). Figures are a year-1 estimate at your 24.0% rate — not tax advice; consult a CPA.
Schools (NCES district)
- District
- Columbus City School District
- NCES district ID
- 3904380
- Math proficiency
- 15% ▼ -17.00%
- Reading proficiency
- 26% ▼ -12.00%
- Median HH income
- $38,483
- Composite
- 17.19/100
- National rank
- #9105
- State rank
- #626 of 656 in OH
Livability — Columbus
- Score
- 81/100
- State rank
- #97
- US rank
- #1491
Category grades
Schools grade is shown separately in the Schools card above.
Census & demographics
- Census place
- Columbus, OH
- County
- Franklin County · 1,351,780 people
- City population
- 612,189
- Metro
- Columbus, OH
- Population (ZIP)
- 21,996
- Household income
- $75,806
- Rent vs Own
- Severe rent burden
- 846.0
Population outlook (Franklin County) Hauer SSP2
- Today (2025)
- 1,456,139 people
- By 2030
- 1,556,890 · +6.9%
- By 2040
- 1,757,349 · +20.7%
- By 2050
- 1,950,539 · +34.0%
- By 2075
- 2,376,171 · +63.2%
- By 2100
- 2,636,796 · +81.1%
Race, ethnicity, and origin ACS 2023
- Neighborhood character
- Diverse neighborhood (Simpson 0.59)
- Race & ethnicity
- White 56% Black 31% Two or more races 9% Hispanic / Latino 4% Asian 1% Native American 1%
- Common ancestry
- Romanian 3% Slovak 2% Lithuanian 1%
- Foreign-born
- 4% · Canada
- Languages at home
- 96% English-only · Spanish 2% Other Indo-European 1%
Political lean MEDSL · Franklin
- 2024 margin
- Strong D (+28.4) · D 63.7% · R 35.3% · Other 1.0%
- 2008→2024 swing
- +7.7pp toward D · 2008: 20.7pp · 2024: 28.4pp
- All cycles
- 2024: D+28.4 2020: D+31.4 2016: D+25.9 2012: D+21.7 2008: D+20.7
Not yet ingested
- Civics
- —
Market trends
- HPI YoY
- ▼ -576.73%
- Current HPI
- 173.8569
- Rent YoY
- ▲ 3.51%
- Metro
- Columbus, OH
- State GDP YoY
- ▲ 1.98%
- F500 in state
- 48
Industry mix (Fortune 500 HQ in OH)
| Industry | F500 HQs | Revenue |
|---|---|---|
| Insurance | 3 | $145B |
|
||
| Industrial Machinery | 3 | $49B |
|
||
| Financial Services | 3 | $24B |
|
||
| Consumer Goods | 2 | $93B |
|
||
| Aerospace / Defense | 2 | $47B |
|
||
| Utilities | 2 | $33B |
|
||
Price history
+574.4% since first listed16 events — show timeline
- 2026-04-17 Listed $215,000 CBRMLS
- 2019-08-01 Sold (Public Records) $115,000 Public Records
- 2019-07-29 Sold (MLS) $115,000 CBRMLS
- 2019-07-13 Pending — CBRMLS
- 2019-04-19 Listed $135,000 CBRMLS
- 2003-01-17 Sold (MLS) $30,000 CBRMLS
- 2002-12-13 Listing Removed — CBRMLS
- 2002-10-23 Listing Removed — CBRMLS
- 2002-10-22 Listed $35,000 CBRMLS
- 2002-05-05 Listing Removed — CBRMLS
- 2002-04-22 Listed $44,900 CBRMLS
- 2002-02-22 Listed $52,500 CBRMLS
- 1999-12-17 Sold (MLS) $34,000 CBRMLS
- 1999-11-02 Listing Removed — CBRMLS
- 1998-01-23 Listed $39,900 CBRMLS
- 1991-06-18 Sold (Public Records) $31,878 Public Records
Property tax history
+14.4%/yrLatest (2024): $3,175 · +1.3% YoY. Source: county tax records.
Cash-flow waterfall
monthlySold comps — $/sqft
last 12 mo · ≤1 miLoading sold comps…