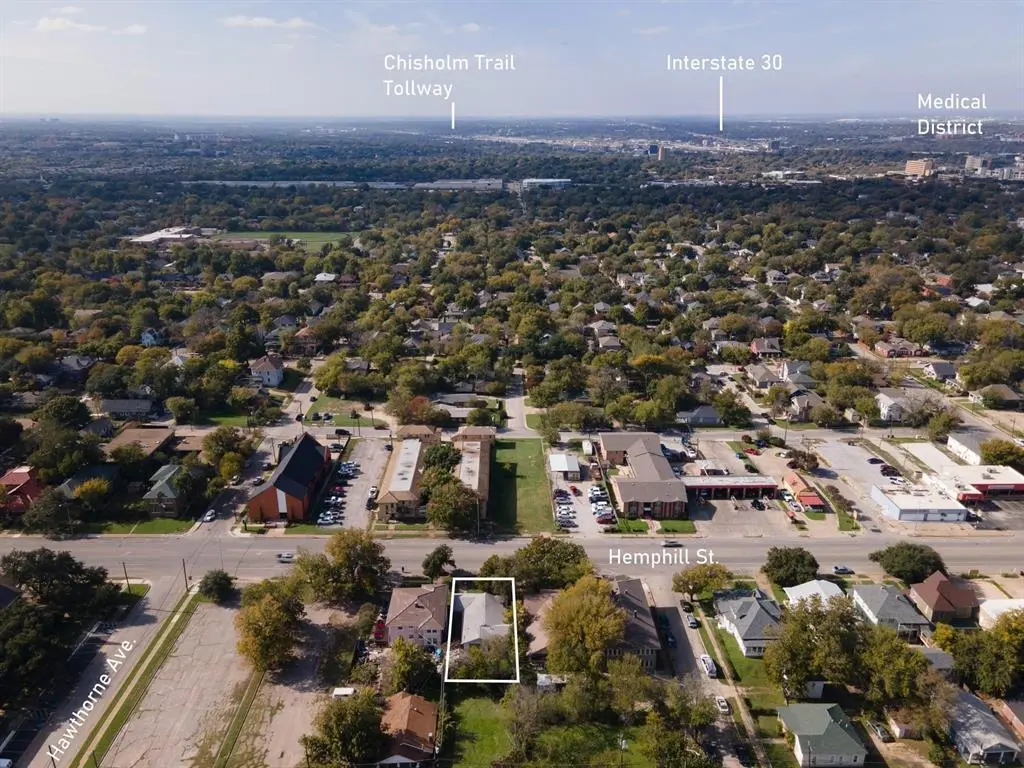
2009 Hemphill St · Fort Worth, TX
Flood risk 1/10 · Minimal
- FEMA flood zone
- X (unshaded)
- Chance of flooding over 30 yrs
- 0.0%
- Est. flood insurance / yr
- $507 – $1,088
Fire risk 1/10 · Minimal
- Est. fire insurance / yr
- $1,222 – $2,270
Heat risk 7/10 · Major
- Hot days now (above 109°F)
- 7 days/yr
- Hot days in 30 yrs
- 23 days/yr
Wind risk 4/10 · Minor
- Chance of severe wind over 30 yrs
- 21.0%
Air-quality risk 3/10 · Minor
- Unhealthy air days now
- 3 days/yr
- Unhealthy air days in 30 yrs
- 4 days/yr
Risk factors via First Street. Map © Google.
Why this score? — see what drove the C grade
The composite is a weighted blend of 9 inputs, each scored 0–100. Each bar is that input's sub-score; the figure is the points it added to the 100-point composite (weight × sub-score).
- Cash flow +25.2/30.0
- DSCR +8.3/10.0
- ARV discount +7.5/15.0
- 1% rule +5.7/10.0
- Livability +4.0/5.0
- Rent growth +2.7/5.0
- Condition / age +2.5/5.0
- Schools +2.0/10.0
- Appreciation +0.0/10.0
$185,000
🖨 Deal sheet (PDF) 📄 Offer letter ✓ Due diligence
Listing remarks
2009 Hemphill in the heart of Fort Worth. This property is zoned either commercial or for short term rentals. This is a city of Fort Worth approved short term rental. Perfect for Air bnb or VRBO rentals. Situated on Hemphill st near JPS hospital and Magnolia avenue and shopping. Also only a short distance from medical district and downtown Fort Worth. Easy access to both interstate 35 and 30 makes it a super convenient location. Spacious interior and even a basement for storage or to make an extra room. The house is ready for a remodel including roof, flooring and paint. With the right touches this place will be ready for stead income flow. Don’t miss this opportunity!
Key facts
- Ready for a remodel
- Basement for storage
- Zoned commercial
Tags
Property features AI
Finance
- Other: Property listed as residential, single family; Subdivision: Emory College Sub
- Financial info: Listing accepts cash or other terms
- HOA & community: No association (no HOA)
Exterior
- Parking: Driveway parking; Covered parking (1 space); 2-car single door configuration; 1-car garage
- Security: No security features listed
- Utilities: City water; City sewer; Not in a municipal utility district
- Home design: Single family residence; One level; Residential property
- Construction: Built in 1924; Asphalt roof; Pillar/post/pier foundation
- Exterior features: Covered patio/porch
Interior
- Kitchen: Other appliances
- Bedrooms: 2 bedrooms (primary bedroom on main level)
- Flooring: Wood flooring
- Bathrooms: 1 full bathroom
- Heating & cooling: No heating or cooling details provided
- Interior features: Basement included; One living area; One dining area; Total of 4 rooms; Other interior features
- Laundry & utility: No specific laundry details provided
Neighborhood map
What this means for you Summary
Snapshot
- This is a 2-bed/1.0-bath single-family listed at $185k.
Deal economics
- At list price, monthly cash flow is $416 ($5k/yr) — positive.
- The deal already cash-flows at list — no discount required.
- Meets the 1% rule at list price ($2k rent vs $185k).
- Recommended offer: $179k (3.0% below list) — sets the bar for market timing.
- Cap rate 9.0% vs local median 3.9% in Fort Worth — top-decile yield for the area; either an underpriced asset or a hidden risk that comps aren't pricing in. Stress-test before assuming the spread holds.
Location & tenants
- Location reads 80/100 on livability (#49 in TX, #1,954 nationally) — a professional / high-income tenant draw. Strengths: amenities A+, cost of living A+, housing A+; Watch: crime F.
- Fort Worth ISD (urban): math 18% / reading 28% proficiency, ranked #742 of 826 in TX (top 90%) — low school quality limits family demand, transient renter base, plan for 1-2y turnover; 73% free/reduced lunch — lower-income household profile, screen leases tightly.
- Zoned schools: Daggett El (math 17% / reading 20%, grade F, #3,759 of 4,322 statewide, top 88%, 544 students, 84% FRL).
- Market conditions: Rents flat; 155 active listings in the ZIP; 40 comparable units currently listed for rent nearby; rentals at typical pace (median 22d on market — plan ~3-4 weeks tenant-placement turnaround); 18,938 units permitted in Tarrant County in 2024 (8,336 in 5+ unit buildings).
- This rent runs 34% of the median local income ($70k/yr) — at the standard rent-burdened threshold; future hikes will face affordability resistance.
Forward outlook
- Local home prices are declining (-3.0%/yr); year-one equity from $1k of loan paydown is wiped out by about $6k of value loss. Plan a longer hold.
- Tarrant County population projected at +41% by 2050 — long-run rental-demand tailwind backs the buy-and-hold thesis.
Negotiation context
- It's been on market 60 days — a 3% lower offer ($179k) is reasonable based on typical stale-listing flexibility.
- 2 sale attempts since 3y ago with the ask held roughly flat each time — persistent listings suggest the price (not the market) is what's stuck; bring a comps-based counter.
Risks & watch-outs
- Watch-outs: built in 1924 — expect roof / HVAC / electrical / plumbing capex.
- Climate carrying-cost: extreme-heat days projected 7→23/yr by 2055 (HVAC capex compounding) — expect insurance premiums to compound above CPI over the hold.
Questions for the listing agent
- It's been on market 60 days. Have you received any prior offers? Is the seller open to a 3% concession, seller financing, or rate buy-down credit?
- Built in 1924 — when were the roof, HVAC, electrical panel, plumbing, and water heater last replaced?
- Is there a deadline driving the sale (1031 exchange, divorce, estate, relocation)? That informs how much negotiation room exists.
- Schools are D-rated, which usually means shorter tenancies and higher turnover. Who's the typical renter profile here, and what's been the actual vacancy rate?
- Crime grade is F in this area — have there been break-ins, vandalism, or insurance claims at this property in the last 3 years? What carrier currently insures it and at what premium?
- What's the average days-on-market for RENTAL listings here right now (not sales)? A rising rental-DOM trend means longer vacancies and softer asking-rent achievability than the comps imply.
- What's the recent tenant-quality profile in this submarket — average credit score on applications, eviction rate, late-payment / NSF rate, and stable-employment percentage? A property-management company in the area should have these aggregated.
- How much new for-sale + rental construction is in the pipeline within 1–3 miles? Heavy new supply typically softens prices + rents 12–24 months out; constrained supply supports both.
Investment metrics
- 1% rule
- 1.07% ✓
- Cap rate
- 8.99%
- Cash-on-cash
- 9.63%
- DSCR
- 1.43
- GRM
- 7.8
CMA / ARV
- ARV (median comp)
- $378,314
- List price
- $185,000
- Delta
- -51.10%
- Verdict
- UNDERPRICED
- Comps
- 20 within 1.0 mi
Show comp detail 12 sales within ~0.75 mi
| Address | Dist | Beds/Ba | Sqft | Sold | Price | $/sf | Match |
|---|---|---|---|---|---|---|---|
| 803 Hawthorne Ave | 0.11mi | 2/2.0 | 1,447 (-0%) | 3mo | $399,000 | $276 | 88 |
| 2105 Lipscomb St | 0.12mi | 2/2.0 | 1,586 (+9%) | 1mo | $385,000 | $243 | 74 |
| 1804 Lipscomb St | 0.22mi | 3/2.0 (+1) | 1,538 (+6%) | 0mo | $343,000 | $223 | 71 |
| 2220 5th Ave | 0.50mi | 2/2.0 | 1,437 (-1%) | 1mo | $410,000 | $285 | 70 |
| 2250 Lipscomb St | 0.26mi | 2/2.0 | 1,304 (-10%) | 1mo | $399,900 | $307 | 66 |
| 1909 6th Ave | 0.52mi | 2/2.0 | 1,335 (-8%) | 1mo | $420,000 | $315 | 57 |
| 2260 Washington Ave | 0.40mi | 2/2.0 | 1,272 (-12%) | 2mo | $390,000 | $307 | 55 |
| 2238 Hurley Ave | 0.71mi | 2/2.0 | 1,377 (-5%) | 0mo | $454,000 | $330 | 54 |
| 2614 May St | 0.57mi | 3/2.0 (+1) | 1,344 (-8%) | 1mo | $180,000 | $134 | 51 |
| 2720 College Ave | 0.71mi | 3/1.0 (+1) | 1,344 (-8%) | 0mo | $262,000 | $195 | 49 |
| 2233 Fairmount Ave | 0.60mi | 3/2.0 (+1) | 1,596 (+10%) | 1mo | $539,500 | $338 | 46 |
| 2241 Hurley Ave | 0.68mi | 3/2.0 (+1) | 1,292 (-11%) | 2mo | $489,000 | $378 | 39 |
Match score weights: distance 35% · size 25% · config 20% · recency 20%. Top-matched comps best support the ARV.
Projected returns pro-forma
-3.0% appreciation · 0.7% rent growth · sell at horizon
- IRR
- -4.2%
- Equity multiple
- 0.85×
- Total profit
- $-8,017
- Equity at exit
- $27,584
- IRR
- 2.8%
- Equity multiple
- 1.18×
- Total profit
- $9,377
- Equity at exit
- $15,995
Cash invested: $51,800 (down + closing). Projections, not guarantees.
Landlord ↔ Tenant lean methodology
- Overall (STATE)
- 87 Strongly Landlord-Friendly
- State Texas
- 87 Strongly Landlord-Friendly · R+5
- County
- — inherits STATE
- City
- — inherits STATE
ZIP-level market 76110
- Rents YoY
- 0.7%
- Active inventory
- 155
- Price-to-rent
- 7.8×
Monthly cashflow live
- Estimated rent
- $1,979 high interval (Pro) →
- Mortgage (P&I)
- −$970
- Tax from tax record
- −$100 /mo · $1,204/yr
- Insurance
- −$77
- HOA
- −$0
- Vacancy / Maint / Mgmt
- −$416
- Net cashflow
- $416
Break-even live
Sensitivity live
| Price | -10% $521 | -5% $468 | +0% $416 | +5% $364 | +10% $311 |
|---|---|---|---|---|---|
| Rent | -10% $260 | -5% $338 | +0% $416 | +5% $494 | +10% $572 |
| Rate | -1.0pp $509 | -0.5pp $463 | base $416 | +0.5pp $368 | +1.0pp $319 |
UW: 25.0% down · 7.5% · 30yr · 1.5% tax · 5.0% vac · 8.0% maint · 8.0% mgmt
Financing live
Cash to close
- Down payment
- $46,250
- Closing costs
- $5,550
- Reserves months
- —
- Total cash needed
- —
Loan-product check · same deal, 3 products live
Conventional
25% down · 7.5% · 30yr
- Down + closing
- —
- Monthly P&I
- —
- Monthly cashflow
- —
- DSCR
- —
- Eligible?
- —
Personal DTI + credit; lowest rate.
DSCR
20% down · 8.5% · 30yr
- Down + closing
- —
- Monthly P&I
- —
- Monthly cashflow
- —
- DSCR
- —
- Eligible?
- —
No personal income docs; deal must DSCR.
Hard money
10% down · 12.0% · 12mo
- Down + closing
- —
- Monthly P&I
- —
- Monthly cashflow
- —
- DSCR
- —
- Eligible?
- —
Short-term bridge; refi at stabilization.
Rent comps 40 comps
| Address | Beds | Baths | Sqft | Rent | $/sqft | DOM | Units | Dist |
|---|---|---|---|---|---|---|---|---|
| 1925 Saint Louis Ave Fort Worth, TX | 3.0 | 1.0 | 1219 | $1,695 | $1.39 | 46d | 1 | 0.19mi |
| 2200 6th Ave Fort Worth, TX | 3.0 | 3.0 | 1552 | $2,650 | $1.71 | 46d | 1 | 0.57mi |
| 1605 5th Ave Fort Worth, TX | 2.0 | 2.0 | 1050 | $1,495 | $1.42 | 21d | 1 | 0.58mi |
| 315 W Magnolia Ave Fort Worth, TX | 2.0 | 1.0–2.0 | 827 | $2,118 | $2.56 | 0d | 44 | 0.58mi |
| 2101 Fairmount Ave Fort Worth, TX | 3.0 | 2.5 | 1516 | $3,200 | $2.11 | 4d | 1 | 0.59mi |
| 703 W Magnolia Ave Unit 201 Fort Worth, TX | 1.0 | 1.0 | 1098 | $2,150 | $1.96 | 46d | 1 | 0.59mi |
| 1824 Fairmount Ave #1824 Fort Worth, TX | 2.0 | 1.0 | 890 | $1,595 | $1.79 | 19d | 1 | 0.64mi |
| 1310 Crawford St Fort Worth, TX | 2.0 | 2.0 | 938 | $1,393 | $1.49 | 8d | 1 | 0.66mi |
| 1125 S Jennings Ave Ste 203 Fort Worth, TX | 1.0 | 1.0 | 975 | $1,395 | $1.43 | 46d | 1 | 0.70mi |
| 1125 S Jennings Ave Unit 201 Fort Worth, TX | 1.0 | 1.0 | 975 | $1,520 | $1.56 | 46d | 1 | 0.70mi |
| 1411 6th Ave Unit 3 Fort Worth, TX | 1.0 | 1.0 | 900 | $1,275 | $1.42 | 46d | 1 | 0.71mi |
| 501 W Rosedale St Fort Worth, TX | 1.0–2.0 | 1.0–2.0 | 795 | $1,990 | $2.50 | 0d | 19 | 0.71mi |
| 1001 W Rosedale St Fort Worth, TX | 1.0–2.0 | 1.0–2.5 | 1090 | $2,461 | $2.26 | 5d | 25 | 0.79mi |
| 2837 Hemphill St Unit 203 Fort Worth, TX | 2.0 | 2.0 | 1297 | $1,875 | $1.45 | 23d | 1 | 0.83mi |
| 2837 Hemphill St Unit 202 Fort Worth, TX | 2.0 | 2.0 | 1297 | $1,800 | $1.39 | 23d | 1 | 0.83mi |
| 1211 6th Ave Unit 201 Fort Worth, TX | 2.0 | 2.0 | 1000 | $5,000 | $5.00 | 22d | 1 | 0.84mi |
| 1016 Bryan Ave Unit 102 Fort Worth, TX | 2.0 | 2.5 | 1400 | $2,500 | $1.79 | 26d | 1 | 0.86mi |
| 2532 Ryan Ave Fort Worth, TX | 3.0 | 2.0 | 1416 | $2,100 | $1.48 | 46d | 1 | 0.87mi |
| 1015 S Jennings Ave Unit 3121 Fort Worth, TX | 3.0 | 2.0 | 1238 | $1,656 | $1.34 | 22d | 1 | 0.88mi |
| 1015 S Jennings Ave Unit 1072 Fort Worth, TX | 2.0 | 2.0 | 986 | $1,269 | $1.29 | 15d | 1 | 0.88mi |
| 1015 S Jennings Ave Unit 2121 Fort Worth, TX | 2.0 | 2.0 | 986 | $1,039 | $1.05 | 0d | 1 | 0.88mi |
| 1015 S Jennings Ave Unit 612 Fort Worth, TX | 3.0 | 2.0 | 1238 | $1,699 | $1.37 | 0d | 1 | 0.88mi |
| 1015 S Jennings Ave Unit 1048 Fort Worth, TX | 3.0 | 2.0 | 1238 | $1,699 | $1.37 | 46d | 1 | 0.88mi |
| 2812 Ryan Place Dr Fort Worth, TX | 2.0 | 1.0 | 1234 | $2,795 | $2.26 | 19d | 1 | 0.88mi |
| 958 E Allen Ave Fort Worth, TX | 3.0 | 3.0 | 1568 | $4,300 | $2.74 | 46d | 1 | 0.89mi |
| 2901 Travis Ave Fort Worth, TX | 1.0–2.0 | 1.0–2.0 | 975 | $1,340 | $1.37 | 26d | 5 | 0.91mi |
| 1016 E Arlington Ave Unit C Fort Worth, TX | 2.0 | 1.0 | 918 | $995 | $1.08 | 19d | 1 | 0.93mi |
| 1004 E Powell Ave Unit 1357999P Fort Worth, TX | 1.0 | 1.0 | 1194 | $2,388 | $2.00 | 16d | 1 | 0.94mi |
| 1004 E Powell Ave Unit 1357996P Fort Worth, TX | 1.0 | 1.0 | 990 | $2,981 | $3.01 | 26d | 1 | 0.94mi |
| 1921 Ben Hall Ct Fort Worth, TX | 3.0 | 1.0 | 1507 | $2,850 | $1.89 | 12d | 1 | 0.94mi |
| 1000 S Henderson St Fort Worth, TX | 1.0–2.0 | 1.0 | 760 | $1,560 | $2.05 | 1d | 11 | 0.94mi |
| 2932 Travis Ave Unit 2932 Fort Worth, TX | 3.0 | 2.0 | 1600 | $1,700 | $1.06 | 23d | 1 | 0.95mi |
| 1332 Driess St Fort Worth, TX | 3.0 | 2.0 | 1565 | $1,850 | $1.18 | 19d | 1 | 0.96mi |
| 1108 7th Ave Unit 1145 Fort Worth, TX | 2.0 | 2.0 | 1373 | $2,490 | $1.81 | 0d | 1 | 0.98mi |
| 1108 7th Ave Fort Worth, TX | 2.0 | 2.0 | 1373 | $2,465 | $1.80 | 21d | 1 | 0.99mi |
| 1108 7th Ave Fort Worth, TX | 2.0 | 1.0–2.0 | 964 | $2,465 | $2.56 | 26d | 18 | 0.99mi |
| 1011 Marion Ave Fort Worth, TX | 2.0 | 1.0 | 1000 | $1,400 | $1.40 | 46d | 1 | 1.00mi |
| 1519 W Rosedale St Fort Worth, TX | 2.0 | 2.0 | 1118 | $1,639 | $1.47 | 46d | 1 | 1.03mi |
| 809 Glen Garden Dr Fort Worth, TX | 2.0 | 1.0 | 959 | $1,295 | $1.35 | 5d | 1 | 1.04mi |
| 650 S Main St Unit 510 Fort Worth, TX | 2.0 | 2.0 | 1068 | $1,614 | $1.51 | 16d | 1 | 1.10mi |
Listing history 20 events
-
2026-06-22days on market $185,000 Active 60 DOM
-
2026-06-21days on market $185,000 Active 59 DOM
-
2026-06-18days on market $185,000 Active 56 DOM
-
2026-06-17days on market $185,000 Active 55 DOM
-
2026-06-16days on market $185,000 Active 54 DOM
-
2026-06-15days on market $185,000 Active 53 DOM
-
2026-06-13days on market $185,000 Active 51 DOM
-
2026-06-09days on market $185,000 Active 47 DOM
-
2026-06-08days on market $185,000 Active 46 DOM
-
2026-06-07days on market $185,000 Active 45 DOM
-
2026-06-04days on market $185,000 Active 42 DOM
-
2026-06-03days on market $185,000 Active 41 DOM
-
2026-06-02days on market $185,000 Active 40 DOM
-
2026-06-01days on market $185,000 Active 39 DOM
-
2026-05-31days on market $185,000 Active 38 DOM
-
2026-04-23$185,000 Active 690-char remark
-
2023-12-21historical
-
2023-12-15$200,000 Active
-
2015-12-30soldstatus
-
1992-07-27soldstatus
ⓘ Source: listings_history table (triggers on properties + properties_extension) + one-shot
backfill from property_details.listing_events for pre-trigger history.
Tax reassessment forecast TX · Resets to sale price
- Current annual tax
- $1,204 · $100/mo
- Projected year-2 tax
- $3,386 · $282/mo
- Expected delta
- +$2,182/yr (+$182/mo · 181.2%)
ⓘ Screening estimate from a state-policy table — verify with the county assessor before closing.
Climate risk First Street
- Flood 1/10 Low FEMA zone X (unshaded) · 0% chance over 30 yrs
- Wildfire 1/10 Low
- Heat 7/10 Severe 7 d/yr ≥109°F today · 23 d/yr by 30 yrs out
- Wind 4/10 Moderate 21% chance of damaging wind over 30 yrs
- Air quality 3/10 Moderate 3 unhealthy d/yr today · 4 by 30 yrs out
Nearby sold comps map
Loading sold comps map…
Walkable amenities ~0.75 mi
Loading nearby amenities…
Taxation est. · year 1
- Rental income
- $23,749
- − Mortgage interest
- −$10,363
- − Property taxes
- −$1,204
- − Insurance
- −$925
- − Repairs & maintenance
- −$1,900
- − Management
- −$1,900
- − Depreciation
- −$5,382
- Taxable income
- $2,075
- Est. tax owed @ 24.0%
- −$498
- After-tax cash flow
- $4,493/yr
For passive investors: Depreciation is non-cash, so a rental often shows a tax loss while cash-flowing — sheltering income. Rental losses are passive: they offset passive income freely, and up to $25,000/yr can offset ordinary (W-2) income if you actively participate and your MAGI is under $100k (phasing out to $0 by $150k); unused losses carry forward. On sale, claimed depreciation is recaptured at up to 25%, and gains may owe capital-gains tax (a 1031 exchange can defer both). Figures are a year-1 estimate at your 24.0% rate — not tax advice; consult a CPA.
Schools (NCES district)
- District
- Fort Worth ISD
- NCES district ID
- 4819700
- Math proficiency
- 18% ▼ -16.00%
- Reading proficiency
- 28% ▼ -6.00%
- Median HH income
- $42,109
- Composite
- 19.61/100
- National rank
- #8753
- State rank
- #742 of 826 in TX
Livability — Fort Worth
- Score
- 80/100
- State rank
- #49
- US rank
- #1954
Category grades
Schools grade is shown separately in the Schools card above.
Census & demographics
- Census place
- Fort Worth, TX
- County
- Tarrant County · 2,033,669 people
- City population
- 911,619
- Metro
- Dallas-Fort Worth-Arlington, TX
- Population (ZIP)
- 33,441
- Household income
- $69,790
- Rent vs Own
- Severe rent burden
- 1471.0
Population outlook (Tarrant County) Hauer SSP2
- Today (2025)
- 2,380,417 people
- By 2030
- 2,578,900 · +8.3%
- By 2040
- 2,974,995 · +25.0%
- By 2050
- 3,350,489 · +40.8%
- By 2075
- 4,216,909 · +77.2%
- By 2100
- 4,741,527 · +99.2%
Race, ethnicity, and origin ACS 2023
- Neighborhood character
- Majority Hispanic (63%)
- Race & ethnicity
- Hispanic / Latino 63% White 30% Two or more races 24% Black 2% Asian 2%
- Hispanic origin (detail)
- Mexican 57%
- Common ancestry
- Slovak 1% Italian 1% Lithuanian 1%
- Foreign-born
- 26% · Canada, China
- Languages at home
- 45% English-only · Spanish 52% Other Asian/Pacific 1% Other Indo-European 1%
Political lean MEDSL · Tarrant
- 2024 margin
- Lean R (+5.1) · D 46.7% · R 51.9% · Other 1.4%
- 2008→2024 swing
- +6.6pp toward D · 2008: -11.7pp · 2024: -5.1pp
- All cycles
- 2024: R+5.1 2020: D+0.2 2016: R+8.7 2012: R+15.7 2008: R+11.7
Not yet ingested
- Civics
- —
Market trends
- HPI YoY
- ▼ -194.46%
- Current HPI
- 274.8888
- Rent YoY
- ▲ 0.70%
- Metro
- Dallas-Fort Worth-Arlington, TX
- State GDP YoY
- ▲ 3.95%
- F500 in state
- 110
Industry mix (Fortune 500 HQ in TX)
| Industry | F500 HQs | Revenue |
|---|---|---|
| Energy | 16 | $1,198B |
|
||
| Technology | 5 | $198B |
|
||
| Engineering / Construction | 4 | $72B |
|
||
| Energy Services | 3 | $60B |
|
||
| Utilities | 3 | $41B |
|
||
| Healthcare | 2 | $330B |
|
||
Price history
-7.5% since first listed5 events — show timeline
- 2026-04-23 Listed $185,000 NTREIS
- 2023-12-21 Listing Removed — NTREIS
- 2023-12-15 Listed $200,000 NTREIS
- 2015-12-30 Sold (Public Records) — Public Records
- 1992-07-27 Sold (Public Records) — Public Records
Property tax history
-2.3%/yrLatest (2025): $1,204 · -2.4% YoY. Source: county tax records.
Cash-flow waterfall
monthlySold comps — $/sqft
last 12 mo · ≤1 miLoading sold comps…