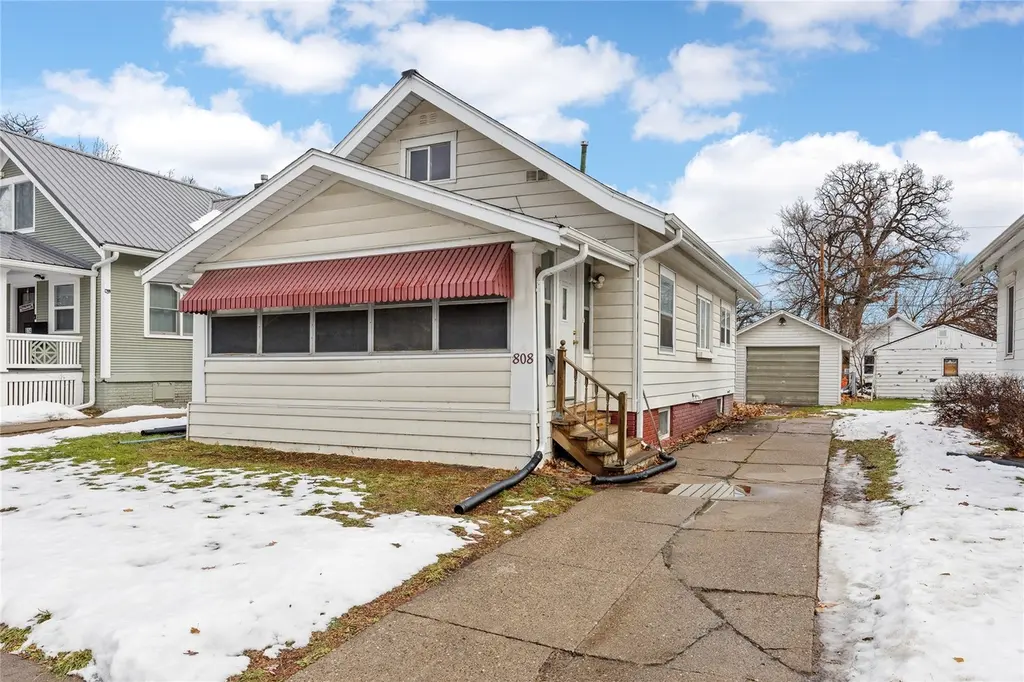
808 Oakland NE · Cedar Rapids, IA
Flood risk 1/10 · Minimal
- FEMA flood zone
- X (unshaded)
- Chance of flooding over 30 yrs
- 0.0%
- Est. flood insurance / yr
- $473 – $860
Fire risk 1/10 · Minimal
- Est. fire insurance / yr
- $902 – $1,676
Heat risk 3/10 · Minor
- Hot days now (above 104°F)
- 7 days/yr
- Hot days in 30 yrs
- 15 days/yr
Wind risk 2/10 · Minimal
- Chance of severe wind over 30 yrs
- —
Air-quality risk 2/10 · Minimal
- Unhealthy air days now
- 0 days/yr
- Unhealthy air days in 30 yrs
- 1 days/yr
Risk factors via First Street. Map © Google.
Why this score? — see what drove the D+ grade
The composite is a weighted blend of 9 inputs, each scored 0–100. Each bar is that input's sub-score; the figure is the points it added to the 100-point composite (weight × sub-score).
- Cash flow +15.7/30.0
- ARV discount +8.8/15.0
- Rent growth +5.0/5.0
- DSCR +4.8/10.0
- Schools +4.7/10.0
- 1% rule +4.2/10.0
- Livability +3.9/5.0
- Condition / age +2.5/5.0
- Appreciation +0.0/10.0
$139,900
🖨 Deal sheet 📄 Offer letter ✓ Due diligence
Listing remarks MLS
Come check out this well-maintained and nicely updated property at 808 Oakland Road NE! This home offers inviting living spaces, great natural light, and a layout that just makes sense. The kitchen is functional with solid storage and prep space. Bedrooms are comfortable and versatile, and the fenced backyard is ready for relaxing, pets, and play. With a detached garage, easy access to schools, shopping, parks, and main travel routes, this home delivers convenience and comfort on the NE side of Cedar Rapids. This lovely home is waiting for its next chapter! Home is sold AS-IS.
Key facts
- Fenced backyard
- Detached garage
- Easy access to parks
Tags
Neighborhood map
What this means for you Summary
Snapshot
- This is a 2-bed/1.0-bath single-family listed at $140k.
Deal economics
- At list price, monthly cash flow is $61 ($737/yr) — positive.
- The deal already cash-flows at list — no discount required.
- To meet the 1% rule (rent ≥ 1% of price), the offer needs to be $129k (7.9% below list).
- Recommended offer: $123k (12.0% below list) — sets the bar for market timing.
- Cap rate 6.8% vs local median 3.5% in Cedar Rapids — top-decile yield for the area; either an underpriced asset or a hidden risk that comps aren't pricing in. Stress-test before assuming the spread holds.
Location & tenants
- Location reads 78/100 on livability (#134 in IA, #2,474 nationally) — a middle-class / working-renter tenant base. Strengths: cost of living A+, housing A+, health & safety A+; Watch: crime C-, commute F.
- Cedar Rapids Community School District (urban): math 50% / reading 59% proficiency, ranked #265 of 289 in IA (top 92%) — acceptable for families but not a draw, mixed tenant base, ~2y average lease.
- Market conditions: Rents rising fast (+11.0%/yr); 286 active listings in the ZIP; 7 comparable units currently listed for rent nearby; rentals lingering (median 44d on market — plan ~5-8 weeks vacancy on turnover, expect pricing pressure); 57% of comp listings sitting > 30 days — soft ceiling on asking rent; 1,023 units permitted in Linn County in 2024 (456 in 5+ unit buildings).
Forward outlook
- Local home prices are declining (-3.0%/yr); year-one equity from $967 of loan paydown is wiped out by about $4k of value loss. Plan a longer hold.
- Linn County population projected at +16% by 2050 — long-run rental-demand tailwind backs the buy-and-hold thesis.
Negotiation context
- It's been on market 151 days — a 12% lower offer ($123k) is reasonable based on typical stale-listing flexibility.
- 5 sale attempts since 13y ago with the ask held roughly flat each time — persistent listings suggest the price (not the market) is what's stuck; bring a comps-based counter.
- Current owner paid $76k; list at $140k implies a 83% gain — meaningful room to come down on a strong offer.
Risks & watch-outs
- Watch-outs: built in 1918 — expect roof / HVAC / electrical / plumbing capex.
Questions for the listing agent
- It's been on market 151 days. Have you received any prior offers? Is the seller open to a 12% concession, seller financing, or rate buy-down credit?
- Built in 1918 — when were the roof, HVAC, electrical panel, plumbing, and water heater last replaced?
- Why hasn't it sold? Are there any deal-killer items the seller is aware of (foundation, flood, title, zoning, code violations)?
- Is there a deadline driving the sale (1031 exchange, divorce, estate, relocation)? That informs how much negotiation room exists.
- Schools are B-rated — typically a magnet for longer-tenancy family renters. What's the average tenant stay here, and is there a school-zone premium baked into asking?
- The area grade is low — what's the realistic commute time and amenity access for the typical tenant pool here? Any planned neighborhood developments (good or bad) we should know about?
- What's the average days-on-market for RENTAL listings here right now (not sales)? A rising rental-DOM trend means longer vacancies and softer asking-rent achievability than the comps imply.
- What's the recent tenant-quality profile in this submarket — average credit score on applications, eviction rate, late-payment / NSF rate, and stable-employment percentage? A property-management company in the area should have these aggregated.
- How much new for-sale + rental construction is in the pipeline within 1–3 miles? Heavy new supply typically softens prices + rents 12–24 months out; constrained supply supports both.
Investment metrics
- 1% rule
- 0.92% ✗
- Cap rate
- 6.82%
- Cash-on-cash
- 1.88%
- DSCR
- 1.08
- GRM
- 9.1
CMA / ARV
- ARV (median comp)
- $144,147
- List price
- $139,900
- Delta
- -2.95%
- Verdict
- FAIR
- Comps
- 20 within 1.0 mi
Show comp detail 12 sales within ~0.75 mi
| Address | Dist | Beds/Ba | Sqft | Sold | Price | $/sf | Match |
|---|---|---|---|---|---|---|---|
| 1614 J Ave NE | 0.49mi | 2/1.0 | 1,205 (+4%) | 0mo | $170,000 | $141 | 71 |
| 1624 Greene Ave NE | 0.44mi | 3/1.5 (+1) | 1,152 (-1%) | 3mo | $178,000 | $155 | 69 |
| 1002 Center Point Rd NE | 0.36mi | 3/1.0 (+1) | 1,126 (-3%) | 10mo | $87,500 | $78 | 64 |
| 1308 L Ave NE | 0.64mi | 3/1.0 (+1) | 1,206 (+4%) | 2mo | $190,000 | $158 | 57 |
| 1046 12th St NE | 0.47mi | 2/2.0 | 1,058 (-9%) | 5mo | $137,500 | $130 | 55 |
| 1101 Elmhurst Dr NE | 0.51mi | 3/1.0 (+1) | 1,088 (-6%) | 11mo | $135,000 | $124 | 52 |
| 1106 Elmhurst Dr | 0.53mi | 3/1.0 (+1) | 1,248 (+7%) | 9mo | $60,000 | $48 | 51 |
| 1302 Maplewood Dr NE | 0.64mi | 2/1.0 | 1,079 (-7%) | 11mo | $155,500 | $144 | 49 |
| 1053 Center Point Rd NE | 0.46mi | 3/2.0 (+1) | 1,304 (+12%) | 4mo | $138,900 | $107 | 46 |
| 1434 Oakland Road Rd NE | 0.75mi | 2/1.0 | 1,030 (-12%) | 1mo | $160,000 | $155 | 45 |
| 1510 Maplewood Dr NE | 0.73mi | 2/1.0 | 1,047 (-10%) | 7mo | $179,900 | $172 | 43 |
| 1859 K Ave NE | 0.66mi | 3/1.0 (+1) | 1,046 (-10%) | 8mo | $160,000 | $153 | 40 |
Match score weights: distance 35% · size 25% · config 20% · recency 20%. Top-matched comps best support the ARV.
Projected returns pro-forma
-3.0% appreciation · 8.0% rent growth · sell at horizon
- IRR
- -7.9%
- Equity multiple
- 0.70×
- Total profit
- $-11,938
- Equity at exit
- $20,860
- IRR
- 7.1%
- Equity multiple
- 1.66×
- Total profit
- $25,672
- Equity at exit
- $12,096
Cash invested: $39,172 (down + closing). Projections, not guarantees.
Landlord ↔ Tenant lean methodology
- Overall (STATE)
- 83 Strongly Landlord-Friendly
- State Iowa
- 83 Strongly Landlord-Friendly · R+6
- County
- — inherits STATE
- City
- — inherits STATE
ZIP-level market 52402
- Rents YoY
- 11.0%
- Active inventory
- 286
- Price-to-rent
- 9.1×
Monthly cashflow live
- Estimated rent
- $1,288 high interval (Pro) →
- Mortgage (P&I)
- −$734
- Tax from tax record
- −$164 /mo · $1,968/yr
- Insurance
- −$58
- HOA
- −$0
- Vacancy / Maint / Mgmt
- −$270
- Net cashflow
- $61
Break-even live
UW: 25.0% down · 7.5% · 30yr · 1.5% tax · 5.0% vac · 8.0% maint · 8.0% mgmt
Financing live
Cash to close
- Down payment
- $34,975
- Closing costs
- $4,197
- Reserves months
- —
- Total cash needed
- —
Loan-product check · same deal, 3 products live
Conventional
25% down · 7.5% · 30yr
- Down + closing
- —
- Monthly P&I
- —
- Monthly cashflow
- —
- DSCR
- —
- Eligible?
- —
Personal DTI + credit; lowest rate.
DSCR
20% down · 8.5% · 30yr
- Down + closing
- —
- Monthly P&I
- —
- Monthly cashflow
- —
- DSCR
- —
- Eligible?
- —
No personal income docs; deal must DSCR.
Hard money
10% down · 12.0% · 12mo
- Down + closing
- —
- Monthly P&I
- —
- Monthly cashflow
- —
- DSCR
- —
- Eligible?
- —
Short-term bridge; refi at stabilization.
Rent comps 7 comps
| Address | Beds | Baths | Sqft | Rent | $/sqft | DOM | Units | Dist |
|---|---|---|---|---|---|---|---|---|
| 1220 Sierra Dr NE Cedar Rapids, IA | 1.0–2.0 | 1.0–2.0 | 985 | $1,000 | $1.02 | 43d | 1 | 0.81mi |
| 511 23rd St NE Cedar Rapids, IA | 2.0 | 1.0 | 888 | $1,500 | $1.69 | 43d | 1 | 0.98mi |
| 906 10th St SE Cedar Rapids, IA | 1.0–2.0 | 1.0–2.0 | 890 | $1,300 | $1.46 | 13d | 6 | 1.16mi |
| 730 Wellington St SE Cedar Rapids, IA | 3.0 | 1.0 | 1366 | $1,325 | $0.97 | 21d | 1 | 1.18mi |
| 1127 34th St NE Cedar Rapids, IA | 3.0 | 2.0 | 1152 | $1,385 | $1.20 | 43d | 1 | 1.42mi |
| 1017 19th St SE Cedar Rapids, IA | 3.0 | 1.0 | 946 | $1,100 | $1.16 | 43d | 1 | 1.48mi |
| 206 3rd Ave SW Cedar Rapids, IA | 1.0 | 1.5 | 1400 | $1,495 | $1.07 | 13d | 1 | 1.50mi |
Listing history 10 events
-
2026-01-27status Active 583-char remark
Show marketing remark (583 chars)
Come check out this well-maintained and nicely updated property at 808 Oakland Road NE! This home offers inviting living spaces, great natural light, and a layout that just makes sense. The kitchen is functional with solid storage and prep space. Bedrooms are comfortable and versatile, and the fenced backyard is ready for relaxing, pets, and play. With a detached garage, easy access to schools, shopping, parks, and main travel routes, this home delivers convenience and comfort on the NE side of Cedar Rapids. This lovely home is waiting for its next chapter! Home is sold AS-IS.
-
2026-01-19status Pending 583-char remark
Show marketing remark (583 chars)
Come check out this well-maintained and nicely updated property at 808 Oakland Road NE! This home offers inviting living spaces, great natural light, and a layout that just makes sense. The kitchen is functional with solid storage and prep space. Bedrooms are comfortable and versatile, and the fenced backyard is ready for relaxing, pets, and play. With a detached garage, easy access to schools, shopping, parks, and main travel routes, this home delivers convenience and comfort on the NE side of Cedar Rapids. This lovely home is waiting for its next chapter! Home is sold AS-IS.
-
2025-12-19$139,900 Active 583-char remark
Show marketing remark (583 chars)
Come check out this well-maintained and nicely updated property at 808 Oakland Road NE! This home offers inviting living spaces, great natural light, and a layout that just makes sense. The kitchen is functional with solid storage and prep space. Bedrooms are comfortable and versatile, and the fenced backyard is ready for relaxing, pets, and play. With a detached garage, easy access to schools, shopping, parks, and main travel routes, this home delivers convenience and comfort on the NE side of Cedar Rapids. This lovely home is waiting for its next chapter! Home is sold AS-IS.
-
2020-07-10soldstatus $76,500
-
2020-04-17$89,900
-
2014-11-07soldstatus $73,000
-
2014-11-04soldstatus $72,750
-
2014-04-01$77,900
-
2013-09-05$84,000
-
2010-05-21soldstatus $80,000
ⓘ Source: listings_history table (triggers on properties + properties_extension) + one-shot
backfill from property_details.listing_events for pre-trigger history.
Tax reassessment forecast IA · Partial reset (capped growth)
- Current annual tax
- $1,968 · $164/mo
- Projected year-2 tax
- $2,082 · $174/mo
- Expected delta
- +$114/yr (+$10/mo · 5.8%)
ⓘ Screening estimate from a state-policy table — verify with the county assessor before closing.
Climate risk First Street
- Flood 1/10 Low FEMA zone X (unshaded) · 0% chance over 30 yrs
- Wildfire 1/10 Low
- Heat 3/10 Moderate 7 d/yr ≥104°F today · 15 d/yr by 30 yrs out
- Wind 2/10 Low
- Air quality 2/10 Low 0 unhealthy d/yr today · 1 by 30 yrs out
Nearby sold comps map
Loading sold comps map…
Walkable amenities ~0.75 mi
Loading nearby amenities…
Taxation est. · year 1
- Rental income
- $15,454
- − Mortgage interest
- −$7,837
- − Property taxes
- −$1,968
- − Insurance
- −$700
- − Repairs & maintenance
- −$1,236
- − Management
- −$1,236
- − Depreciation
- −$4,070
- Taxable loss
- −$1,593
- Est. tax savings @ 24.0%
- +$382
- After-tax cash flow
- $1,120/yr
For passive investors: Depreciation is non-cash, so a rental often shows a tax loss while cash-flowing — sheltering income. Rental losses are passive: they offset passive income freely, and up to $25,000/yr can offset ordinary (W-2) income if you actively participate and your MAGI is under $100k (phasing out to $0 by $150k); unused losses carry forward. On sale, claimed depreciation is recaptured at up to 25%, and gains may owe capital-gains tax (a 1031 exchange can defer both). Figures are a year-1 estimate at your 24.0% rate — not tax advice; consult a CPA.
Schools (NCES district)
- District
- Cedar Rapids Community School District
- NCES district ID
- 1906540
- Math proficiency
- 50% ▼ -12.00%
- Reading proficiency
- 59% ▼ -6.00%
- Median HH income
- $53,568
- Composite
- 46.82/100
- National rank
- #2378
- State rank
- #265 of 289 in IA
Livability — Cedar Rapids
- Score
- 78/100
- State rank
- #134
- US rank
- #2474
Category grades
Schools grade is shown separately in the Schools card above.
Census & demographics
- Census place
- Cedar Rapids, IA
- County
- Linn County · 179,860 people
- City population
- 137,154
- Metro
- Cedar Rapids, IA
- Population (ZIP)
- 42,938
- Household income
- $73,439
- Rent vs Own
- Severe rent burden
- 971.0
Population outlook (Linn County) Hauer SSP2
- Today (2025)
- 239,589 people
- By 2030
- 248,587 · +3.8%
- By 2040
- 264,817 · +10.5%
- By 2050
- 278,685 · +16.3%
- By 2075
- 311,754 · +30.1%
- By 2100
- 336,773 · +40.6%
Race, ethnicity, and origin ACS 2023
- Neighborhood character
- Predominantly White (77%)
- Race & ethnicity
- White 77% Two or more races 7% Black 6% Asian 6% Hispanic / Latino 4%
- Common ancestry
- Portuguese 4% Lithuanian 2% Iranian 2%
- Foreign-born
- 8% · Canada, Philippines, China
- Languages at home
- 89% English-only · Spanish 3% Other Indo-European 3% Other Asian/Pacific 2%
Political lean MEDSL · Linn
- 2024 margin
- Lean D (+9.9) · D 54.2% · R 44.3% · Other 1.4%
- 2008→2024 swing
- -11.6pp toward R · 2008: 21.5pp · 2024: 9.9pp
- All cycles
- 2024: D+9.9 2020: D+13.7 2016: D+9.0 2012: D+17.6 2008: D+21.5
Not yet ingested
- Civics
- —
Market trends
- HPI YoY
- ▼ -133.31%
- Current HPI
- 201.7061
- Rent YoY
- ▲ 10.97%
- Metro
- Cedar Rapids, IA
- State GDP YoY
- ▲ 2.48%
- F500 in state
- 4
Industry mix (Fortune 500 HQ in IA)
| Industry | F500 HQs | Revenue |
|---|---|---|
| Financial Services | 1 | $16B |
|
||
| Retail / Convenience | 1 | $15B |
|
||
Price history
+74.9% since first listed10 events — show timeline
- 2026-01-27 Relisted — CRAAR, CDRMLS
- 2026-01-19 Pending — CRAAR, CDRMLS
- 2025-12-19 Listed $139,900 CRAAR, CDRMLS
- 2020-07-10 Sold (MLS) $76,500 CRAAR, CDRMLS
- 2020-04-17 Listed $89,900 CRAAR, CDRMLS
- 2014-11-07 Sold (Public Records) $73,000 Public Records
- 2014-11-04 Sold (MLS) $72,750 CRAAR, CDRMLS
- 2014-04-01 Listed $77,900 CRAAR, CDRMLS
- 2013-09-05 Listed $84,000 CRAAR, CDRMLS
- 2010-05-21 Sold (Public Records) $80,000 Public Records
Property tax history
+1.3%/yrLatest (2025): $1,968 · +2.3% YoY. Source: county tax records.
Cash-flow waterfall
monthlySold comps — $/sqft
last 12 mo · ≤1 miLoading sold comps…