8155 S Redwood #96 · West Jordan, UT
Flood risk 8/10 · Major
- FEMA flood zone
- AE
- Chance of flooding over 30 yrs
- 0.99%
- Est. flood insurance / yr
- $1,737 – $8,500
Fire risk 1/10 · Minimal
- Est. fire insurance / yr
- $453 – $841
Heat risk 4/10 · Minor
- Hot days now (above 96°F)
- 7 days/yr
- Hot days in 30 yrs
- 19 days/yr
Wind risk 1/10 · Minimal
- Chance of severe wind over 30 yrs
- —
Air-quality risk 3/10 · Minor
- Unhealthy air days now
- 3 days/yr
- Unhealthy air days in 30 yrs
- 5 days/yr
Risk factors via First Street. Map © Google.
Why this score? — see what drove the B grade
The composite is a weighted blend of 9 inputs, each scored 0–100. Each bar is that input's sub-score; the figure is the points it added to the 100-point composite (weight × sub-score).
- Cash flow +30.0/30.0
- 1% rule +10.0/10.0
- DSCR +10.0/10.0
- ARV discount +7.5/15.0
- Livability +4.0/5.0
- Condition / age +4.0/5.0
- Schools +3.8/10.0
- Rent growth +2.1/5.0
- Appreciation +0.0/10.0
$58,000
🖨 Deal sheet (PDF) 📄 Offer letter ✓ Due diligence
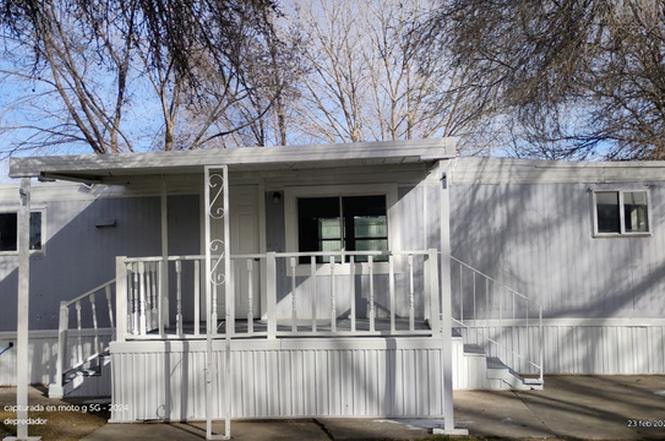
Listing remarks
Beautiful home ready to move ! Very large back yard and side. 2 car parking. Square foot given by owner, but you can measure your own. Central air. The current lot rental fee is $1,050/ monthly. Buyer to verify all info.
Key facts
- Large back yard
- Side parking
- Central air
Tags
Property features AI
Finance
- Other: Zoning: Single-Family / Multi-Family (CC-R); Mobile dimensions approximately 12 x 58 feet; Approximately 696 above-grade finished area; Lot approximately 0.1 acre
- HOA & community: Clubhouse; Subdivision: BROOKSIDE
Exterior
- Parking: 2 open/uncovered parking spaces
- Utilities: Natural gas available and connected; Electricity available and connected; Public sewer available and connected; Culinary water available and connected
- Home design: Mobile home; Faces west; Residential use
- Construction: Flat membrane roof
- Exterior features: Covered deck; In-ground private pool; Fenced (full); Paved road frontage; Mature trees; Flat terrain
Interior
- Kitchen: Gas range; Range hood; Granite countertops
- Bedrooms: 2 main-level bedrooms
- Flooring: Vinyl
- Bathrooms: 1 full bathroom
- Heating & cooling: Gas central heating; Central air conditioning
- Interior features: Gas range; Granite countertops; Range hood; Sliding glass doors; Double pane windows; Lighting; Accessible doors
- Laundry & utility: Washer; Dryer; Electric dryer hookup
Neighborhood map
What this means for you Summary
Snapshot
- This is a 2-bed/1.0-bath manufactured listed at $58k. Condition is rated good.
Deal economics
- At list price, monthly cash flow is $397 ($5k/yr) — positive.
- The deal already cash-flows at list — no discount required.
- Meets the 1% rule at list price ($2k rent vs $58k).
- Recommended offer: $53k (9.0% below list) — sets the bar for market timing.
Location & tenants
- Location reads 80/100 on livability (#34 in UT, #1,632 nationally) — a professional / high-income tenant draw. Strengths: commute A+, employment A+, housing A+; Watch: cost of living D+.
- Jordan District (suburban): math 38% / reading 43% proficiency, ranked #36 of 80 in UT (top 45%) — families likely to look elsewhere, expect single-tenant / working-renter base with shorter leases.
- Zoned schools: Jordan Hills School (math 47% / reading 47%, grade D-, #202 of 585 statewide, top 36%, 665 students, 19% FRL); West Hills Middle (math 25% / reading 28%, grade F, #116 of 138 statewide, top 85%, 1,247 students, 23% FRL); West Jordan High (math 13% / reading 35%, grade F, #149 of 171 statewide, top 87%, 1,826 students, 31% FRL) — zoned schools at 24% FRL track the district average.
- Market conditions: Rents soft (-1.5%/yr); 116 active listings in the ZIP; 3 comparable units currently listed for rent nearby; rentals leasing fast (median 3d on market — plan ~1-2 weeks tenant-placement turnaround); solid renter incomes; 4,970 units permitted in Salt Lake County in 2024 (1,963 in 5+ unit buildings).
- This rent is only 18% of the median local income ($105k/yr) — well below the 30% rent-burden line; pricing power to push rent on renewal without tenant pushback.
Forward outlook
- Local home prices are declining (-3.0%/yr); year-one equity from $401 of loan paydown is wiped out by about $2k of value loss. Plan a longer hold.
- Salt Lake County population projected at +37% by 2050 — long-run rental-demand tailwind backs the buy-and-hold thesis.
- At projected returns (-3.0% appreciation + 0.0% rent growth), your $16k cash investment doubles in ~5 years — after that, you're playing with house money.
Negotiation context
- It's been on market 114 days — a 9% lower offer ($53k) is reasonable based on typical stale-listing flexibility.
Risks & watch-outs
- Watch-outs: flood insurance adds $427/mo.
- Climate carrying-cost: in FEMA flood zone AE (mandatory federal flood insurance) — expect insurance premiums to compound above CPI over the hold.
Questions for the listing agent
- It's been on market 114 days. Have you received any prior offers? Is the seller open to a 9% concession, seller financing, or rate buy-down credit?
- Built in 1972 — when were the roof, HVAC, electrical panel, plumbing, and water heater last replaced?
- What's the actual annual flood-insurance premium (NFIP or private), and is the property in a SFHA with mandatory coverage?
- Why hasn't it sold? Are there any deal-killer items the seller is aware of (foundation, flood, title, zoning, code violations)?
- Is there a deadline driving the sale (1031 exchange, divorce, estate, relocation)? That informs how much negotiation room exists.
- What's the average days-on-market for RENTAL listings here right now (not sales)? A rising rental-DOM trend means longer vacancies and softer asking-rent achievability than the comps imply.
- What's the recent tenant-quality profile in this submarket — average credit score on applications, eviction rate, late-payment / NSF rate, and stable-employment percentage? A property-management company in the area should have these aggregated.
- How much new for-sale + rental construction is in the pipeline within 1–3 miles? Heavy new supply typically softens prices + rents 12–24 months out; constrained supply supports both.
Investment metrics
- 1% rule
- 2.67% ✓
- Cap rate
- 23.34%
- Cash-on-cash
- 60.88%
- DSCR
- 3.71
- GRM
- 3.1
CMA / ARV
No comps found within radius.
Projected returns pro-forma
-3.0% appreciation · 0.0% rent growth · sell at horizon
- IRR
- 18.7%
- Equity multiple
- 1.72×
- Total profit
- $11,653
- Equity at exit
- $8,648
- IRR
- 23.7%
- Equity multiple
- 2.62×
- Total profit
- $26,339
- Equity at exit
- $5,015
Cash invested: $16,240 (down + closing). Projections, not guarantees.
Landlord ↔ Tenant lean methodology
- Overall (STATE)
- 86 Strongly Landlord-Friendly
- State Utah
- 86 Strongly Landlord-Friendly · R+15
- County
- — inherits STATE
- City
- — inherits STATE
ZIP-level market 84088
- Rents YoY
- -1.5%
- Active inventory
- 116
- Price-to-rent
- 3.1×
Monthly cashflow live
- Estimated rent
- $1,550 medium interval (Pro) →
- Mortgage (P&I)
- −$304
- Tax est. 1.5%
- −$72 /mo · $870/yr
- Insurance
- −$24
- Flood insurance flood zone
- −$427 /mo · $5,118/yr
- HOA
- −$0
- Vacancy / Maint / Mgmt
- −$326
- Net cashflow
- $397
Break-even live
Sensitivity live
| Price | -10% $437 | -5% $417 | +0% $397 | +5% $377 | +10% $357 |
|---|---|---|---|---|---|
| Rent | -10% $275 | -5% $336 | +0% $397 | +5% $459 | +10% $520 |
| Rate | -1.0pp $427 | -0.5pp $412 | base $397 | +0.5pp $382 | +1.0pp $367 |
UW: 25.0% down · 7.5% · 30yr · 1.5% tax · 5.0% vac · 8.0% maint · 8.0% mgmt
Financing live
Cash to close
- Down payment
- $14,500
- Closing costs
- $1,740
- Reserves months
- —
- Total cash needed
- —
Loan-product check · same deal, 3 products live
Conventional
25% down · 7.5% · 30yr
- Down + closing
- —
- Monthly P&I
- —
- Monthly cashflow
- —
- DSCR
- —
- Eligible?
- —
Personal DTI + credit; lowest rate.
DSCR
20% down · 8.5% · 30yr
- Down + closing
- —
- Monthly P&I
- —
- Monthly cashflow
- —
- DSCR
- —
- Eligible?
- —
No personal income docs; deal must DSCR.
Hard money
10% down · 12.0% · 12mo
- Down + closing
- —
- Monthly P&I
- —
- Monthly cashflow
- —
- DSCR
- —
- Eligible?
- —
Short-term bridge; refi at stabilization.
Rent comps 3 comps
| Address | Beds | Baths | Sqft | Rent | $/sqft | DOM | Units | Dist |
|---|---|---|---|---|---|---|---|---|
| 831 Lennox St Apt 5 Midvale, UT | 2.0 | 1.0 | 740 | $1,150 | $1.55 | 5d | 1 | 1.26mi |
| 9035 1075 W West Jordan, UT | 1.0–2.0 | 1.0–2.0 | 783 | $1,929 | $2.46 | 2d | 13 | 1.39mi |
| 8018 S Main St Midvale, UT | 1.0–2.0 | 1.0–2.0 | 753 | $1,599 | $2.12 | 2d | 2 | 1.39mi |
Listing history 15 events
-
2026-06-21days on market $58,000 Active 114 DOM
-
2026-06-18days on market $58,000 Active 111 DOM
-
2026-06-17days on market $58,000 Active 110 DOM
-
2026-06-16days on market $58,000 Active 109 DOM
-
2026-06-15days on market $58,000 Active 108 DOM
-
2026-06-13days on market $58,000 Active 106 DOM
-
2026-06-09days on market $58,000 Active 102 DOM
-
2026-06-08days on market $58,000 Active 101 DOM
-
2026-06-07days on market $58,000 Active 100 DOM
-
2026-06-03days on market $58,000 Active 96 DOM
-
2026-06-02days on market $58,000 Active 95 DOM
-
2026-06-01days on market $58,000 Active 94 DOM
-
2026-05-31days on market $58,000 Active 93 DOM
-
2026-03-17price $58,000
-
2026-02-27$60,000 Active
ⓘ Source: listings_history table (triggers on properties + properties_extension) + one-shot
backfill from property_details.listing_events for pre-trigger history.
Climate risk First Street
- Flood 8/10 Severe FEMA zone AE · 99% chance over 30 yrs
- Wildfire 1/10 Low
- Heat 4/10 Moderate 7 d/yr ≥96°F today · 19 d/yr by 30 yrs out
- Wind 1/10 Low
- Air quality 3/10 Moderate 3 unhealthy d/yr today · 5 by 30 yrs out
Nearby sold comps map
Loading sold comps map…
Walkable amenities ~0.75 mi
Loading nearby amenities…
Taxation est. · year 1
- Rental income
- $18,604
- − Mortgage interest
- −$3,249
- − Property taxes
- −$870
- − Insurance
- −$5,408
- − Repairs & maintenance
- −$1,488
- − Management
- −$1,488
- − Depreciation
- −$1,687
- Taxable income
- $4,413
- Est. tax owed @ 24.0%
- −$1,059
- After-tax cash flow
- $3,710/yr
For passive investors: Depreciation is non-cash, so a rental often shows a tax loss while cash-flowing — sheltering income. Rental losses are passive: they offset passive income freely, and up to $25,000/yr can offset ordinary (W-2) income if you actively participate and your MAGI is under $100k (phasing out to $0 by $150k); unused losses carry forward. On sale, claimed depreciation is recaptured at up to 25%, and gains may owe capital-gains tax (a 1031 exchange can defer both). Figures are a year-1 estimate at your 24.0% rate — not tax advice; consult a CPA.
Condition & rehab AI · 13 photos
This manufactured home is in good condition with a good exterior and interior. Painting the exterior siding and maintaining the HVAC system would be the highest-ROI updates to increase its value.
Value-add opportunities
- Both Paint the exterior siding — Painting the exterior siding will improve the curb appeal and increase the home's value for both resale and rental.
- Both Clean and maintain the HVAC system — A clean and well-maintained HVAC system will improve the home's comfort and energy efficiency, which can increase its value for both resale and rental.
Renovation cost estimate screening
Value-add ROI direction
- Both Paint the exterior siding — Painting the exterior siding will improve the curb appeal and increase the home's value for both resale and rental. ↑
- Both Clean and maintain the HVAC system — A clean and well-maintained HVAC system will improve the home's comfort and energy efficiency, which can increase its value for both resale and rental. ↑
ⓘ Cost ranges are severity-bucket heuristics (US national rule-of-thumb). Get contractor quotes + a written scope before underwriting a rehab budget.
Schools (NCES district)
- District
- Jordan District
- NCES district ID
- 4900420
- Math proficiency
- 38% ▼ -7.00%
- Reading proficiency
- 43% ▼ -4.00%
- Median HH income
- $78,154
- Composite
- 37.59/100
- National rank
- #4384
- State rank
- #36 of 80 in UT
Livability — West Jordan
- Score
- 80/100
- State rank
- #34
- US rank
- #1632
Category grades
Schools grade is shown separately in the Schools card above.
Census & demographics
- Census place
- West Jordan, UT
- County
- Salt Lake County · 1,195,750 people
- City population
- 123,084
- Metro
- Salt Lake City, UT
- Population (ZIP)
- 39,228
- Household income
- $105,142
- Rent vs Own
- Severe rent burden
- 777.0
Population outlook (Salt Lake County) Hauer SSP2
- Today (2025)
- 1,305,860 people
- By 2030
- 1,402,611 · +7.4%
- By 2040
- 1,594,533 · +22.1%
- By 2050
- 1,787,244 · +36.9%
- By 2075
- 2,224,138 · +70.3%
- By 2100
- 2,551,390 · +95.4%
Race, ethnicity, and origin ACS 2023
- Neighborhood character
- Predominantly White (67%)
- Race & ethnicity
- White 67% Hispanic / Latino 25% Two or more races 10% Asian 3% Native American 1% Pacific Islander 1%
- Hispanic origin (detail)
- Mexican 18%
- Common ancestry
- Slovak 3% Italian 2% Iranian 2%
- Foreign-born
- 13% · Canada, Jamaica, China
- Languages at home
- 78% English-only · Spanish 17% Other Indo-European 1% Other Asian/Pacific 1%
Political lean MEDSL · Salt Lake
- 2024 margin
- D (+10.2) · D 53.7% · R 43.5% · Other 2.8%
- 2008→2024 swing
- +10.1pp toward D · 2008: 0.1pp · 2024: 10.2pp
- All cycles
- 2024: D+10.2 2020: D+11.0 2016: D+10.2 2012: R+19.3 2008: D+0.1
Not yet ingested
- Civics
- —
Market trends
- HPI YoY
- ▼ -259.12%
- Current HPI
- 321.656
- Rent YoY
- ▼ -1.51%
- Metro
- Salt Lake City, UT
- State GDP YoY
- ▲ 3.54%
- F500 in state
- 2
Industry mix (Fortune 500 HQ in UT)
| Industry | F500 HQs | Revenue |
|---|---|---|
| Financial Services | 1 | $3B |
|
||
Price history
-3.3% since first listed2 events — show timeline
- 2026-03-17 Price Changed $58,000 WFRMLS
- 2026-02-27 Listed $60,000 WFRMLS
Cash-flow waterfall
monthlySold comps — $/sqft
last 12 mo · ≤1 miLoading sold comps…