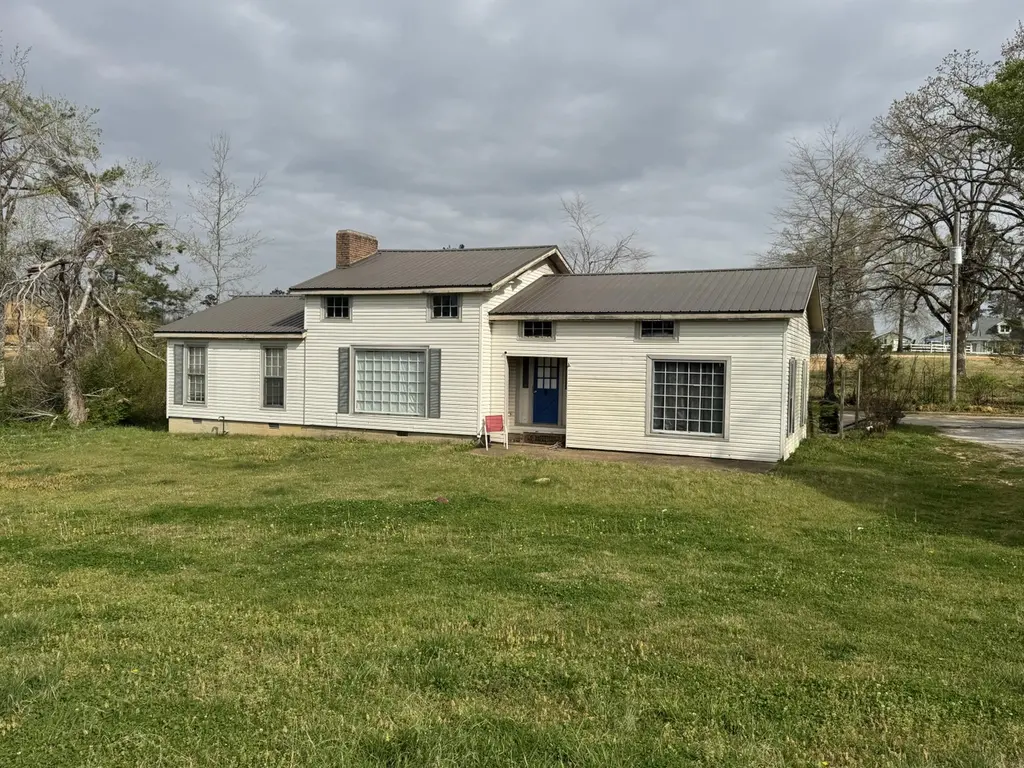
4607 N Harper Rd · Corinth, MS
Flood risk 1/10 · Minimal
- FEMA flood zone
- X (unshaded)
- Chance of flooding over 30 yrs
- 0.0%
- Est. flood insurance / yr
- $507 – $1,088
Fire risk 5/10 · Moderate
- Est. fire insurance / yr
- $1,241 – $2,305
Heat risk 6/10 · Moderate
- Hot days now (above 109°F)
- 7 days/yr
- Hot days in 30 yrs
- 20 days/yr
Wind risk 4/10 · Minor
- Chance of severe wind over 30 yrs
- 21.0%
Air-quality risk 1/10 · Minimal
- Unhealthy air days now
- 0 days/yr
- Unhealthy air days in 30 yrs
- 0 days/yr
Risk factors via First Street. Map © Google.
Why this score? — see what drove the D- grade
The composite is a weighted blend of 9 inputs, each scored 0–100. Each bar is that input's sub-score; the figure is the points it added to the 100-point composite (weight × sub-score).
- Cash flow +13.7/30.0
- ARV discount +4.5/15.0
- DSCR +4.1/10.0
- Livability +3.1/5.0
- Schools +2.9/10.0
- 1% rule +2.8/10.0
- Rent growth +2.5/5.0
- Condition / age +2.5/5.0
- Appreciation +0.0/10.0
$149,900
🖨 Deal sheet (PDF) 📄 Offer letter ✓ Due diligence
Listing remarks MLS
Don't miss this excellent income-producing property located in the heart of Corinth! This spacious 4-bedroom, 3-bath home is currently rented, making it a turnkey investment for anyone looking to expand their portfolio or step into rental ownership with immediate cash flow. With a functional layout and generous living space, this property appeals to long-term tenants seeking comfort and convenience. The multiple bedrooms and three full baths offer flexibility for families or shared living arrangements, increasing rental stability and demand.
Key facts
- 0.4 acre lot
- Built 1968
- Listed 83 days
Neighborhood map
What this means for you Summary
Snapshot
- This is a 4-bed/1.0-bath single-family listed at $150k.
Deal economics
- At list price, monthly cash flow is $11 ($138/yr) — positive.
- The deal already cash-flows at list — no discount required.
- To meet the 1% rule (rent ≥ 1% of price), the offer needs to be $116k (22.4% below list).
- Recommended offer: $116k (22.4% below list) — sets the bar for 1% rule.
- Cap rate 6.4% vs local median 3.7% in Corinth — top-decile yield for the area; either an underpriced asset or a hidden risk that comps aren't pricing in. Stress-test before assuming the spread holds.
Location & tenants
- Location reads 61/100 on livability (#187 in MS) — a middle-class / working-renter tenant base. Strengths: cost of living A+, housing A+; Watch: schools D+, crime D-, amenities F.
- Corinth School District (town): math 35% / reading 36% proficiency, ranked #56 of 130 in MS (top 43%) — families likely to look elsewhere, expect single-tenant / working-renter base with shorter leases.
- Market conditions: 193 active listings in the ZIP; 13 units permitted in Alcorn County in 2024 (0 in 5+ unit buildings).
Forward outlook
- Local home prices are declining (-3.0%/yr); year-one equity from $1k of loan paydown is wiped out by about $4k of value loss. Plan a longer hold.
- Alcorn County population projected at +3% by 2050 — modest demand growth; plan on rents tracking national, not racing it.
Negotiation context
- It's been on market 83 days — a 6% lower offer ($141k) is reasonable based on typical stale-listing flexibility.
- 2 sale attempts since 3y ago with the ask held roughly flat each time — persistent listings suggest the price (not the market) is what's stuck; bring a comps-based counter.
Risks & watch-outs
- Climate carrying-cost: moderate wildfire risk; extreme-heat days projected 7→20/yr by 2055 (HVAC capex compounding) — expect insurance premiums to compound above CPI over the hold.
Questions for the listing agent
- It's been on market 83 days. Have you received any prior offers? Is the seller open to a 22% concession, seller financing, or rate buy-down credit?
- Built in 1968 — when were the roof, HVAC, electrical panel, plumbing, and water heater last replaced?
- Why hasn't it sold? Are there any deal-killer items the seller is aware of (foundation, flood, title, zoning, code violations)?
- Is there a deadline driving the sale (1031 exchange, divorce, estate, relocation)? That informs how much negotiation room exists.
- Schools are D-rated, which usually means shorter tenancies and higher turnover. Who's the typical renter profile here, and what's been the actual vacancy rate?
- Crime grade is D in this area — have there been break-ins, vandalism, or insurance claims at this property in the last 3 years? What carrier currently insures it and at what premium?
- The area grade is low — what's the realistic commute time and amenity access for the typical tenant pool here? Any planned neighborhood developments (good or bad) we should know about?
- What's the average days-on-market for RENTAL listings here right now (not sales)? A rising rental-DOM trend means longer vacancies and softer asking-rent achievability than the comps imply.
- What's the recent tenant-quality profile in this submarket — average credit score on applications, eviction rate, late-payment / NSF rate, and stable-employment percentage? A property-management company in the area should have these aggregated.
- How much new for-sale + rental construction is in the pipeline within 1–3 miles? Heavy new supply typically softens prices + rents 12–24 months out; constrained supply supports both.
Investment metrics
- 1% rule
- 0.78% ✗
- Cap rate
- 6.38%
- Cash-on-cash
- 0.33%
- DSCR
- 1.01
- GRM
- 10.7
CMA / ARV
- ARV (median comp)
- $140,521
- List price
- $149,900
- Delta
- 6.67%
- Verdict
- FAIR
- Comps
- 2 within 1.0 mi
Projected returns pro-forma
-3.0% appreciation · 3.0% rent growth · sell at horizon
- IRR
- -15.8%
- Equity multiple
- 0.44×
- Total profit
- $-23,621
- Equity at exit
- $22,351
- IRR
- -7.5%
- Equity multiple
- 0.53×
- Total profit
- $-19,878
- Equity at exit
- $12,961
Cash invested: $41,972 (down + closing). Projections, not guarantees.
Landlord ↔ Tenant lean methodology
- Overall (STATE)
- 90 Strongly Landlord-Friendly
- State Mississippi
- 90 Strongly Landlord-Friendly · R+11
- County
- — inherits STATE
- City
- — inherits STATE
ZIP-level market 38834
- Active inventory
- 193
- Price-to-rent
- 10.7×
Monthly cashflow live
- Estimated rent
- $1,163 medium interval (Pro) →
- Mortgage (P&I)
- −$786
- Tax from tax record
- −$58 /mo · $701/yr
- Insurance
- −$62
- HOA
- −$0
- Vacancy / Maint / Mgmt
- −$244
- Net cashflow
- $11
Break-even live
Sensitivity live
| Price | -10% $96 | -5% $54 | +0% $11 | +5% $-31 | +10% $-73 |
|---|---|---|---|---|---|
| Rent | -10% $-80 | -5% $-34 | +0% $11 | +5% $57 | +10% $103 |
| Rate | -1.0pp $87 | -0.5pp $50 | base $11 | +0.5pp $-27 | +1.0pp $-67 |
UW: 25.0% down · 7.5% · 30yr · 1.5% tax · 5.0% vac · 8.0% maint · 8.0% mgmt
Financing live
Cash to close
- Down payment
- $37,475
- Closing costs
- $4,497
- Reserves months
- —
- Total cash needed
- —
Loan-product check · same deal, 3 products live
Conventional
25% down · 7.5% · 30yr
- Down + closing
- —
- Monthly P&I
- —
- Monthly cashflow
- —
- DSCR
- —
- Eligible?
- —
Personal DTI + credit; lowest rate.
DSCR
20% down · 8.5% · 30yr
- Down + closing
- —
- Monthly P&I
- —
- Monthly cashflow
- —
- DSCR
- —
- Eligible?
- —
No personal income docs; deal must DSCR.
Hard money
10% down · 12.0% · 12mo
- Down + closing
- —
- Monthly P&I
- —
- Monthly cashflow
- —
- DSCR
- —
- Eligible?
- —
Short-term bridge; refi at stabilization.
Listing history 19 events
-
2026-06-21days on market $149,900 Active 83 DOM
-
2026-06-21days on market $149,900 Active 82 DOM
-
2026-06-18days on market $149,900 Active 80 DOM
-
2026-06-17days on market $149,900 Active 79 DOM
-
2026-06-16days on market $149,900 Active 78 DOM
-
2026-06-15days on market $149,900 Active 77 DOM
-
2026-06-13days on market $149,900 Active 75 DOM
-
2026-06-12days on market $149,900 Active 74 DOM
-
2026-06-09days on market $149,900 Active 71 DOM
-
2026-06-08days on market $149,900 Active 70 DOM
-
2026-06-07days on market $149,900 Active 69 DOM
-
2026-06-07days on market $149,900 Active 68 DOM
-
2026-06-04days on market $149,900 Active 65 DOM
-
2026-06-02days on market $149,900 Active 64 DOM
-
2026-06-01days on market $149,900 Active 63 DOM
-
2026-05-31days on market $149,900 Active 62 DOM
-
2026-03-30$149,900 Active 547-char remark
Show marketing remark (547 chars)
Don't miss this excellent income-producing property located in the heart of Corinth! This spacious 4-bedroom, 3-bath home is currently rented, making it a turnkey investment for anyone looking to expand their portfolio or step into rental ownership with immediate cash flow. With a functional layout and generous living space, this property appeals to long-term tenants seeking comfort and convenience. The multiple bedrooms and three full baths offer flexibility for families or shared living arrangements, increasing rental stability and demand.
-
2023-07-25soldstatus
-
2023-05-05$95,000
ⓘ Source: listings_history table (triggers on properties + properties_extension) + one-shot
backfill from property_details.listing_events for pre-trigger history.
Tax reassessment forecast MS · Resets to sale price
- Current annual tax
- $701 · $58/mo
- Projected year-2 tax
- $1,184 · $99/mo
- Expected delta
- +$483/yr (+$40/mo · 68.9%)
ⓘ Screening estimate from a state-policy table — verify with the county assessor before closing.
Climate risk First Street
- Flood 1/10 Low FEMA zone X (unshaded) · 0% chance over 30 yrs
- Wildfire 5/10 Major
- Heat 6/10 Major 7 d/yr ≥109°F today · 20 d/yr by 30 yrs out
- Wind 4/10 Moderate 21% chance of damaging wind over 30 yrs
- Air quality 1/10 Low 0 unhealthy d/yr today · 0 by 30 yrs out
Nearby sold comps map
Loading sold comps map…
Walkable amenities ~0.75 mi
Loading nearby amenities…
Taxation est. · year 1
- Rental income
- $13,951
- − Mortgage interest
- −$8,397
- − Property taxes
- −$701
- − Insurance
- −$750
- − Repairs & maintenance
- −$1,116
- − Management
- −$1,116
- − Depreciation
- −$4,361
- Taxable loss
- −$2,489
- Est. tax savings @ 24.0%
- +$597
- After-tax cash flow
- $735/yr
For passive investors: Depreciation is non-cash, so a rental often shows a tax loss while cash-flowing — sheltering income. Rental losses are passive: they offset passive income freely, and up to $25,000/yr can offset ordinary (W-2) income if you actively participate and your MAGI is under $100k (phasing out to $0 by $150k); unused losses carry forward. On sale, claimed depreciation is recaptured at up to 25%, and gains may owe capital-gains tax (a 1031 exchange can defer both). Figures are a year-1 estimate at your 24.0% rate — not tax advice; consult a CPA.
Schools (NCES district)
- District
- Corinth School District
- NCES district ID
- 2801260
- Math proficiency
- 35% ▼ -7.00%
- Reading proficiency
- 36% ▼ -7.00%
- Median HH income
- $31,709
- Composite
- 29.02/100
- National rank
- #6611
- State rank
- #56 of 130 in MS
Livability — Corinth
- Score
- 61/100
- State rank
- #187
- US rank
- #17369
Category grades
Schools grade is shown separately in the Schools card above.
Census & demographics
- Census place
- Corinth, MS
- City population
- 27,146
- Population (ZIP)
- 27,146
Population outlook (Alcorn County) Hauer SSP2
- Today (2025)
- 38,392 people
- By 2030
- 38,804 · +1.1%
- By 2040
- 39,455 · +2.8%
- By 2050
- 39,708 · +3.4%
- By 2075
- 39,917 · +4.0%
- By 2100
- 37,628 · -2.0%
Race, ethnicity, and origin ACS 2023
- Neighborhood character
- Predominantly White (81%)
- Race & ethnicity
- White 81% Black 12% Hispanic / Latino 4% Two or more races 3%
- Common ancestry
- Italian 1% Slovak 1% Serbian 1%
- Foreign-born
- 1% · Canada
- Languages at home
- 97% English-only · Spanish 1%
Political lean MEDSL · Alcorn
- 2024 margin
- Solid R (+68.3) · D 15.4% · R 83.8%
- 2008→2024 swing
- -24.4pp toward R · 2008: -44.0pp · 2024: -68.3pp
- All cycles
- 2024: R+68.3 2020: R+63.5 2016: R+61.8 2012: R+51.6 2008: R+44.0
Not yet ingested
- Civics
- —
Market trends
- HPI YoY
- ▼ -98.19%
- Current HPI
- 155.736
- Rent YoY
- —
- Metro
- —
- State GDP YoY
- —
- F500 in state
- 0
Price history
+57.8% since first listed3 events — show timeline
- 2026-03-30 Listed $149,900 NEMSBD
- 2023-07-25 Sold (MLS) — NEMSBD
- 2023-05-05 Listed $95,000 NEMSBD
Property tax history
+12.7%/yrLatest (2025): $701 · +23.7% YoY. Source: county tax records.
Cash-flow waterfall
monthlySold comps — $/sqft
last 12 mo · ≤1 miLoading sold comps…