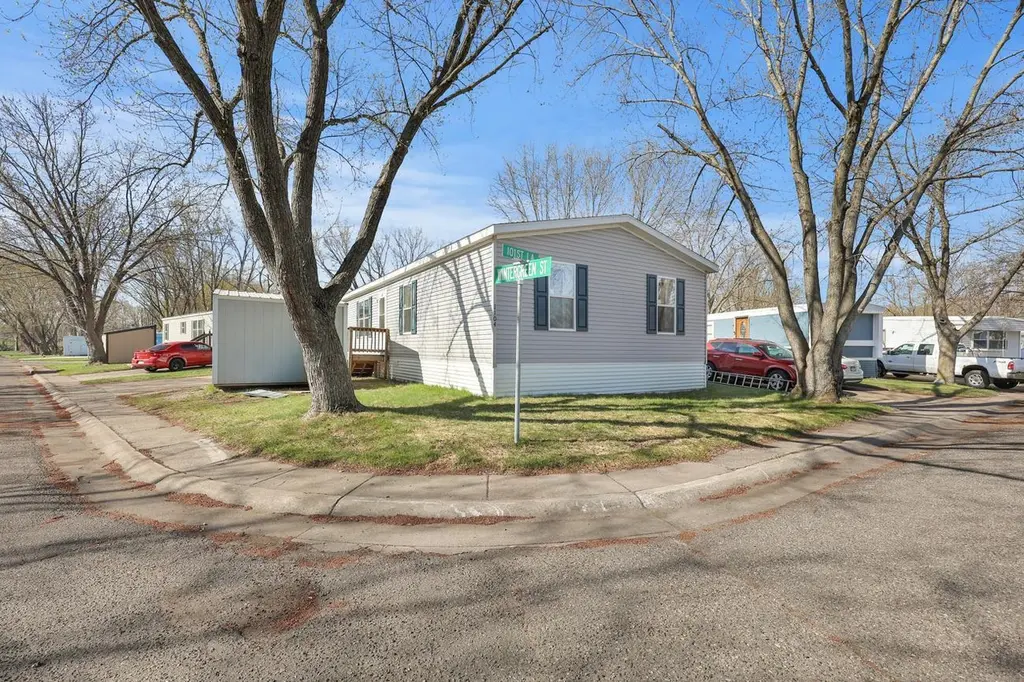
1104 101st Ln NW · Coon Rapids, MN
Flood risk 8/10 · Major
- FEMA flood zone
- X (shaded)
- Chance of flooding over 30 yrs
- 0.99%
- Est. flood insurance / yr
- $507 – $1,088
Fire risk 1/10 · Minimal
- Est. fire insurance / yr
- $888 – $1,650
Heat risk 2/10 · Minimal
- Hot days now (above 99°F)
- 7 days/yr
- Hot days in 30 yrs
- 14 days/yr
Wind risk 2/10 · Minimal
- Chance of severe wind over 30 yrs
- —
Air-quality risk 2/10 · Minimal
- Unhealthy air days now
- 2 days/yr
- Unhealthy air days in 30 yrs
- 2 days/yr
Risk factors via First Street. Map © Google.
Why this score? — see what drove the B grade
The composite is a weighted blend of 9 inputs, each scored 0–100. Each bar is that input's sub-score; the figure is the points it added to the 100-point composite (weight × sub-score).
- Cash flow +30.0/30.0
- DSCR +10.0/10.0
- 1% rule +7.5/10.0
- ARV discount +7.5/15.0
- Schools +4.7/10.0
- Livability +4.3/5.0
- Condition / age +4.0/5.0
- Rent growth +3.9/5.0
- Appreciation +0.0/10.0
$149,900
🖨 Deal sheet (PDF) 📄 Offer letter ✓ Due diligence
Listing remarks
Beautiful Double Wide Like new 4 bed 2 bath mobile home on quiet neighborhood. Spacious, Very clean, move in ready. Stainless steel appliances. Built 2021. Lot rent $595/mo. Includes water, trash and sewer.
Key facts
- Quiet neighborhood
- Move in ready
- Built 2021
Tags
Property features AI
Finance
- HOA & community: Land is leased (land lease fee $595)
Exterior
- Parking: Asphalt parking
- Utilities: City water (connected); City sewer (connected); Natural gas; Circuit breaker electrical
- Home design: Residential property; One story
- Construction: Other foundation
- Exterior features: Vinyl exterior; No fencing
Interior
- Kitchen: Dishwasher; Range; Refrigerator; Microwave
- Bedrooms: 4 bedrooms
- Bathrooms: 2 full bathrooms; Main floor full bath
- Heating & cooling: Forced air heating; Central air conditioning
- Interior features: Eat-in kitchen
- Laundry & utility: Washer; Dryer
Neighborhood map
What this means for you Summary
Snapshot
- This is a 4-bed/2.0-bath manufactured listed at $150k. Condition is rated good.
Deal economics
- At list price, monthly cash flow is $497 ($6k/yr) — positive.
- The deal already cash-flows at list — no discount required.
- Meets the 1% rule at list price ($2k rent vs $150k).
- Recommended offer: $148k (1.5% below list) — sets the bar for market timing.
- Cap rate 10.8% vs local median 3.8% in Coon Rapids — top-decile yield for the area; either an underpriced asset or a hidden risk that comps aren't pricing in. Stress-test before assuming the spread holds.
Location & tenants
- Location reads 86/100 on livability (#12 in MN, #390 nationally) — a professional / high-income tenant draw. Strengths: commute A+, employment A+, housing A+; Watch: amenities D.
- Anoka-Hennepin Public School District (suburban): math 49% / reading 55% proficiency, ranked #71 of 301 in MN (top 24%) — acceptable for families but not a draw, mixed tenant base, ~2y average lease.
- Market conditions: Rents rising fast (+5.4%/yr); 119 active listings in the ZIP; 4 comparable units currently listed for rent nearby; rentals at typical pace (median 25d on market — plan ~3-4 weeks tenant-placement turnaround); solid renter incomes; 1,083 units permitted in Anoka County in 2024 (134 in 5+ unit buildings).
Forward outlook
- Local home prices are declining (-3.0%/yr); year-one equity from $1k of loan paydown is wiped out by about $4k of value loss. Plan a longer hold.
- Anoka County population projected at +11% by 2050 — modest demand growth; plan on rents tracking national, not racing it.
- At projected returns (-3.0% appreciation + 5.4% rent growth), your $42k cash investment doubles in ~7 years — after that, you're playing with house money.
Negotiation context
- It's been on market 17 days — a 2% lower offer ($148k) is reasonable based on typical stale-listing flexibility.
Risks & watch-outs
- Watch-outs: flood insurance adds $66/mo.
- Climate carrying-cost: severe flood risk — expect insurance premiums to compound above CPI over the hold.
Questions for the listing agent
- What's the actual annual flood-insurance premium (NFIP or private), and is the property in a SFHA with mandatory coverage?
- Is there a deadline driving the sale (1031 exchange, divorce, estate, relocation)? That informs how much negotiation room exists.
- Schools are B-rated — typically a magnet for longer-tenancy family renters. What's the average tenant stay here, and is there a school-zone premium baked into asking?
- What's the average days-on-market for RENTAL listings here right now (not sales)? A rising rental-DOM trend means longer vacancies and softer asking-rent achievability than the comps imply.
- What's the recent tenant-quality profile in this submarket — average credit score on applications, eviction rate, late-payment / NSF rate, and stable-employment percentage? A property-management company in the area should have these aggregated.
- How much new for-sale + rental construction is in the pipeline within 1–3 miles? Heavy new supply typically softens prices + rents 12–24 months out; constrained supply supports both.
Investment metrics
- 1% rule
- 1.25% ✓
- Cap rate
- 10.80%
- Cash-on-cash
- 16.10%
- DSCR
- 1.72
- GRM
- 6.6
CMA / ARV
No comps found within radius.
Projected returns pro-forma
-3.0% appreciation · 5.43% rent growth · sell at horizon
- IRR
- 7.2%
- Equity multiple
- 1.29×
- Total profit
- $12,044
- Equity at exit
- $22,351
- IRR
- 18.4%
- Equity multiple
- 2.70×
- Total profit
- $71,508
- Equity at exit
- $12,961
Cash invested: $41,972 (down + closing). Projections, not guarantees.
Landlord ↔ Tenant lean methodology
- Overall (STATE)
- 46 Balanced
- State Minnesota
- 46 Balanced · D+2
- County
- — inherits STATE
- City
- — inherits STATE
ZIP-level market 55433
- Rents YoY
- 5.4%
- Active inventory
- 119
- Price-to-rent
- 6.6×
Monthly cashflow live
- Estimated rent
- $1,879 medium interval (Pro) →
- Mortgage (P&I)
- −$786
- Tax from tax record
- −$73 /mo · $875/yr
- Insurance
- −$62
- Flood insurance flood zone
- −$66 /mo · $798/yr
- HOA
- −$0
- Vacancy / Maint / Mgmt
- −$395
- Net cashflow
- $497
Break-even live
Sensitivity live
| Price | -10% $581 | -5% $539 | +0% $497 | +5% $454 | +10% $412 |
|---|---|---|---|---|---|
| Rent | -10% $348 | -5% $422 | +0% $497 | +5% $571 | +10% $645 |
| Rate | -1.0pp $572 | -0.5pp $535 | base $497 | +0.5pp $458 | +1.0pp $418 |
UW: 25.0% down · 7.5% · 30yr · 1.5% tax · 5.0% vac · 8.0% maint · 8.0% mgmt
Financing live
Cash to close
- Down payment
- $37,475
- Closing costs
- $4,497
- Reserves months
- —
- Total cash needed
- —
Loan-product check · same deal, 3 products live
Conventional
25% down · 7.5% · 30yr
- Down + closing
- —
- Monthly P&I
- —
- Monthly cashflow
- —
- DSCR
- —
- Eligible?
- —
Personal DTI + credit; lowest rate.
DSCR
20% down · 8.5% · 30yr
- Down + closing
- —
- Monthly P&I
- —
- Monthly cashflow
- —
- DSCR
- —
- Eligible?
- —
No personal income docs; deal must DSCR.
Hard money
10% down · 12.0% · 12mo
- Down + closing
- —
- Monthly P&I
- —
- Monthly cashflow
- —
- DSCR
- —
- Eligible?
- —
Short-term bridge; refi at stabilization.
Rent comps 4 comps
| Address | Beds | Baths | Sqft | Rent | $/sqft | DOM | Units | Dist |
|---|---|---|---|---|---|---|---|---|
| 750 99th Ave NW Minneapolis, MN | 2.0–3.0 | 1.5–2.0 | 1195 | $1,725 | $1.44 | 0d | 4 | 0.56mi |
| 10630 Tamarack St NW Minneapolis, MN | 3.0 | 1.0 | 900 | $1,424 | $1.58 | 25d | 1 | 0.64mi |
| 10400 Jay St NW Minneapolis, MN | 1.0–3.0 | 1.0–2.0 | 962 | $1,775 | $1.85 | 3d | 1 | 0.99mi |
| 10060 Dogwood St NW Minneapolis, MN | 2.0–3.0 | 2.0 | 1240 | $1,895 | $1.53 | 24d | 2 | 1.09mi |
Listing history 3 events
-
2026-05-08status Pending
-
2026-04-24historical Contingent - Inspection
-
2026-04-21$149,900 Active
ⓘ Source: listings_history table (triggers on properties + properties_extension) + one-shot
backfill from property_details.listing_events for pre-trigger history.
Tax reassessment forecast MN · Partial reset (capped growth)
- Current annual tax
- $875 · $73/mo
- Projected year-2 tax
- $1,277 · $106/mo
- Expected delta
- +$402/yr (+$33/mo · 45.9%)
ⓘ Screening estimate from a state-policy table — verify with the county assessor before closing.
Climate risk First Street
- Flood 8/10 Severe FEMA zone X (shaded) · 99% chance over 30 yrs
- Wildfire 1/10 Low
- Heat 2/10 Low 7 d/yr ≥99°F today · 14 d/yr by 30 yrs out
- Wind 2/10 Low
- Air quality 2/10 Low 2 unhealthy d/yr today · 2 by 30 yrs out
Nearby sold comps map
Loading sold comps map…
Walkable amenities ~0.75 mi
Loading nearby amenities…
Taxation est. · year 1
- Rental income
- $22,550
- − Mortgage interest
- −$8,397
- − Property taxes
- −$875
- − Insurance
- −$1,547
- − Repairs & maintenance
- −$1,804
- − Management
- −$1,804
- − Depreciation
- −$4,361
- Taxable income
- $3,763
- Est. tax owed @ 24.0%
- −$903
- After-tax cash flow
- $5,056/yr
For passive investors: Depreciation is non-cash, so a rental often shows a tax loss while cash-flowing — sheltering income. Rental losses are passive: they offset passive income freely, and up to $25,000/yr can offset ordinary (W-2) income if you actively participate and your MAGI is under $100k (phasing out to $0 by $150k); unused losses carry forward. On sale, claimed depreciation is recaptured at up to 25%, and gains may owe capital-gains tax (a 1031 exchange can defer both). Figures are a year-1 estimate at your 24.0% rate — not tax advice; consult a CPA.
Condition & rehab AI · 12 photos
This move-in ready mobile home is in excellent condition with modern updates and a clean, well-maintained appearance. Simple improvements can further enhance its curb appeal and value.
Value-add opportunities
- Both Painting the exterior siding — Fresh paint can enhance curb appeal and add value.
- Both Landscaping improvements — Enhanced landscaping can improve curb appeal and attract potential buyers/tenants.
- Both Adding a small patio or deck — A small outdoor space can increase the home's livability and appeal to potential buyers/tenants.
- Both Upgrading the flooring in the bathrooms — Modern flooring can improve the aesthetic and functionality of the bathrooms, enhancing both resale and rental value.
Renovation cost estimate screening
Value-add ROI direction
- Both Painting the exterior siding — Fresh paint can enhance curb appeal and add value. ↑
- Both Landscaping improvements — Enhanced landscaping can improve curb appeal and attract potential buyers/tenants. ↑
- Both Adding a small patio or deck — A small outdoor space can increase the home's livability and appeal to potential buyers/tenants. ↑
- Both Upgrading the flooring in the bathrooms — Modern flooring can improve the aesthetic and functionality of the bathrooms, enhancing both resale and rental value. ↑
ⓘ Cost ranges are severity-bucket heuristics (US national rule-of-thumb). Get contractor quotes + a written scope before underwriting a rehab budget.
Schools (NCES district)
- District
- Anoka-Hennepin Public School District
- NCES district ID
- 2703180
- Math proficiency
- 49% ▼ -14.00%
- Reading proficiency
- 55% ▼ -10.00%
- Median HH income
- $73,837
- Composite
- 46.7/100
- National rank
- #2400
- State rank
- #71 of 301 in MN
Livability — Coon Rapids
- Score
- 86/100
- State rank
- #12
- US rank
- #390
Category grades
Schools grade is shown separately in the Schools card above.
Census & demographics
- Census place
- Coon Rapids, MN
- County
- Anoka County · 277,116 people
- City population
- 63,468
- Metro
- Minneapolis-St. Paul-Bloomington, MN-WI
- Population (ZIP)
- 34,463
- Household income
- $78,054
- Rent vs Own
- Severe rent burden
- 1129.0
Population outlook (Anoka County) Hauer SSP2
- Today (2025)
- 375,223 people
- By 2030
- 387,850 · +3.4%
- By 2040
- 407,239 · +8.5%
- By 2050
- 417,541 · +11.3%
- By 2075
- 448,447 · +19.5%
- By 2100
- 464,954 · +23.9%
Race, ethnicity, and origin ACS 2023
- Neighborhood character
- Predominantly White (70%)
- Race & ethnicity
- White 70% Black 9% Asian 9% Two or more races 9% Hispanic / Latino 5%
- Common ancestry
- Portuguese 12% Romanian 5% Italian 3%
- Foreign-born
- 9% · Canada, Vietnam
- Languages at home
- 90% English-only · Other Asian/Pacific 3% Spanish 2% Other Indo-European 1%
Political lean MEDSL · Anoka
- 2024 margin
- Toss-up / Even · D 46.6% · R 51.0% · Other 2.4%
- 2008→2024 swing
- -2.0pp toward R · 2008: -2.4pp · 2024: -4.4pp
- All cycles
- 2024: R+4.4 2020: R+1.9 2016: R+9.7 2012: R+2.6 2008: R+2.4
Not yet ingested
- Civics
- —
Market trends
- HPI YoY
- ▼ -243.93%
- Current HPI
- 260.1237
- Rent YoY
- ▲ 5.43%
- Metro
- Minneapolis-St. Paul-Bloomington, MN-WI
- State GDP YoY
- ▲ 2.41%
- F500 in state
- 34
Industry mix (Fortune 500 HQ in MN)
| Industry | F500 HQs | Revenue |
|---|---|---|
| Healthcare | 2 | $407B |
|
||
| Retail | 2 | $150B |
|
||
| Consumer Goods | 2 | $32B |
|
||
| Industrial Machinery | 2 | $6B |
|
||
| Agriculture | 1 | $40B |
|
||
| Healthcare / Medical Devices | 1 | $32B |
|
||
Price history
3 events — show timeline
- 2026-05-08 Pending — NORTHSTARMLS as Distributed by MLS Grid
- 2026-04-24 Contingent — NORTHSTARMLS as Distributed by MLS Grid
- 2026-04-21 Listed $149,900 NORTHSTARMLS as Distributed by MLS Grid
Property tax history
-3.9%/yrLatest (2026): $875 · -33.1% YoY. Source: county tax records.
Cash-flow waterfall
monthlySold comps — $/sqft
last 12 mo · ≤1 miLoading sold comps…