 🏗️ New Construction
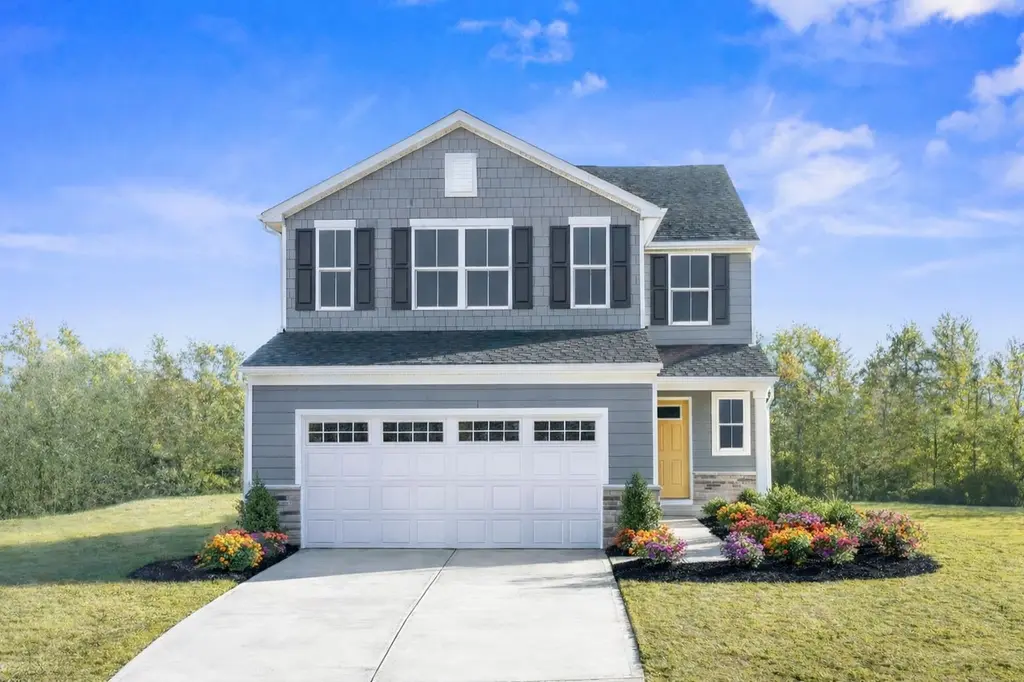
Woodford Plan · Indianapolis city (balance), IN
Flood risk No data
- FEMA flood zone
- —
- Chance of flooding over 30 yrs
- —
- Est. flood insurance / yr
- —
Fire risk No data
- Est. fire insurance / yr
- —
Heat risk No data
- Hot days now (above threshold)
- —
- Hot days in 30 yrs
- —
Wind risk No data
- Chance of severe wind over 30 yrs
- —
Air-quality risk No data
- Unhealthy air days now
- —
- Unhealthy air days in 30 yrs
- —
Risk factors via First Street. Map © Google.
Why this score? — see what drove the D grade
The composite is a weighted blend of 9 inputs, each scored 0–100. Each bar is that input's sub-score; the figure is the points it added to the 100-point composite (weight × sub-score).
- Cash flow +12.6/30.0
- ARV discount +7.5/15.0
- Rent growth +4.0/5.0
- Schools +4.0/10.0
- Condition / age +4.0/5.0
- DSCR +3.8/10.0
- 1% rule +3.6/10.0
- Livability +2.5/5.0
- Appreciation +0.0/10.0
$317,990
🖨 Deal sheet (PDF) 📄 Offer letter ✓ Due diligence
Listing remarks
Welcome to The Woodford at Palermo Gardens, the lowest-priced new single-family homes in Franklin Township. This single-family home offers the space you've been searching for! The welcoming great room opens into the gourmet kitchen and dining area with a large eat-at island. Take dinner parties outside with an optional rear covered patio. The convenient first-floor bedroom and bath provides flexibility for guests or multi-generational living. Upstairs, three bedrooms and a versatile loft space offer room for the whole family. You luxurious owner's suite features dual walk-in closets and a spa-like double vanity. Complete with a two-car garage, you'll have plenty of room for your vehicles an
Key facts
- First-floor bedroom
- Gourmet kitchen
- Dining area
Tags
Property features AI
Finance
- Other: Address: 4133 Palermo Dr, Indianapolis, IN 46239; Listing status: Active
- Financial info: List price $317,990
Exterior
- Parking: 2 parking spaces
- Utilities: Has cooling (central air)
- Home design: Plan: Woodford; New construction plan
- Exterior features: Living area of 2,275 (listed)
Interior
- Bedrooms: 5 bedrooms
- Bathrooms: 3 full bathrooms
- Heating & cooling: Central air conditioning
- Interior features: Central air conditioning
Neighborhood map
What this means for you Summary
Snapshot
- This is a 5-bed/3.0-bath single-family listed at $318k. Condition is rated good.
Deal economics
- At list price, monthly cash flow is $-39 ($-472/yr) — negative.
- To cash-flow at today's rent, offer at most $315k (0.9% below list).
- To meet the 1% rule (rent ≥ 1% of price), the offer needs to be $276k (13.3% below list).
- Recommended offer: $276k (13.3% below list) — sets the bar for 1% rule.
- Cap rate 6.1% vs local median 4.4% in Indianapolis city (balance) — top-decile yield for the area; either an underpriced asset or a hidden risk that comps aren't pricing in. Stress-test before assuming the spread holds.
Location & tenants
- Location reads: area grade D — affects rentability + tenant quality, not the cash-flow math above.
- Franklin Township Community School Corporation (urban): math 42% / reading 47% proficiency, ranked #87 of 301 in IN (top 29%) — families likely to look elsewhere, expect single-tenant / working-renter base with shorter leases.
- Zoned schools: Franklin Central Junior High (math 31% / reading 40%, grade F, #162 of 330 statewide, top 49%, 1,711 students, 51% FRL); Franklin Central High School (math 41% / reading 69%, grade C, #77 of 369 statewide, top 21%, 3,319 students, 46% FRL) — zoned schools average 48% FRL vs 29% district-wide (20 pts higher); higher-poverty schools than district average — tighter screening recommended.
- Market conditions: Rents rising fast (+6.1%/yr); 337 active listings in the ZIP; 2 comparable units currently listed for rent nearby; solid renter incomes; 1,906 units permitted in Marion County in 2024 (621 in 5+ unit buildings).
- This rent runs 33% of the median local income ($100k/yr) — at the standard rent-burdened threshold; future hikes will face affordability resistance.
Forward outlook
- Local home prices are declining (-3.0%/yr); year-one equity from $2k of loan paydown is wiped out by about $10k of value loss. Plan a longer hold.
- Marion County population projected at +18% by 2050 — long-run rental-demand tailwind backs the buy-and-hold thesis.
Negotiation context
- It's been on market 75 days — a 6% lower offer ($299k) is reasonable based on typical stale-listing flexibility.
Questions for the listing agent
- What do current leases actually rent for vs. the listed asking? Can we see a recent rent roll and the last 12 months of T-12 income?
- It's been on market 75 days. Have you received any prior offers? Is the seller open to a 13% concession, seller financing, or rate buy-down credit?
- Why hasn't it sold? Are there any deal-killer items the seller is aware of (foundation, flood, title, zoning, code violations)?
- Is there a deadline driving the sale (1031 exchange, divorce, estate, relocation)? That informs how much negotiation room exists.
- The area grade is low — what's the realistic commute time and amenity access for the typical tenant pool here? Any planned neighborhood developments (good or bad) we should know about?
- What's the average days-on-market for RENTAL listings here right now (not sales)? A rising rental-DOM trend means longer vacancies and softer asking-rent achievability than the comps imply.
- What's the recent tenant-quality profile in this submarket — average credit score on applications, eviction rate, late-payment / NSF rate, and stable-employment percentage? A property-management company in the area should have these aggregated.
- How much new for-sale + rental construction is in the pipeline within 1–3 miles? Heavy new supply typically softens prices + rents 12–24 months out; constrained supply supports both.
Investment metrics
- 1% rule
- 0.86% ✗
- Cap rate
- 6.15%
- Cash-on-cash
- -0.53%
- DSCR
- 0.98
- GRM
- 9.7
CMA / ARV
- ARV (on-the-fly)
- $320,775
- Comps found
- 12
Show comp detail 12 sales within ~0.75 mi
| Address | Dist | Beds/Ba | Sqft | Sold | Price | $/sf | Match |
|---|---|---|---|---|---|---|---|
| 10451 Pintail Ln | 0.42mi | 4/3.0 (-1) | 2,302 (+1%) | 2mo | $315,000 | $137 | 72 |
| 10334 Deercrest Ln | 0.29mi | 4/2.5 (-1) | 2,291 (+1%) | 11mo | $338,000 | $148 | 69 |
| 10644 Pintail Ln | 0.64mi | 5/3.0 | 2,308 (+2%) | 3mo | $342,500 | $148 | 65 |
| 10447 Pintail Ln | 0.41mi | 4/2.5 (-1) | 2,322 (+2%) | 11mo | $329,000 | $142 | 62 |
| 4329 Wild Turkey Dr | 0.38mi | 4/3.0 (-1) | 2,302 (+1%) | 23mo | $320,000 | $139 | 56 |
| 10602 Pintail Ln | 0.56mi | 4/2.5 (-1) | 2,326 (+2%) | 12mo | $329,000 | $141 | 54 |
| 4218 Mendocino Blvd | 0.74mi | 5/3.0 | 2,422 (+6%) | 8mo | $335,000 | $138 | 48 |
| 4142 Mendocino Blvd | 0.73mi | 5/3.0 | 2,427 (+7%) | 8mo | $346,000 | $143 | 48 |
| 10448 Pintail Ln | 0.40mi | 4/2.5 (-1) | 2,512 (+10%) | 11mo | $310,000 | $123 | 48 |
| 4236 Mendocino Blvd | 0.74mi | 5/3.0 | 2,427 (+7%) | 9mo | $345,000 | $142 | 47 |
| 10419 Pronghorn Ln | 0.42mi | 5/3.5 | 2,580 (+13%) | 12mo | $350,000 | $136 | 46 |
| 4328 Blue Note Dr | 0.40mi | 4/2.5 (-1) | 2,516 (+11%) | 18mo | $345,998 | $138 | 42 |
Match score weights: distance 35% · size 25% · config 20% · recency 20%. Top-matched comps best support the ARV.
Projected returns pro-forma
-3.0% appreciation · 6.11% rent growth · sell at horizon
- IRR
- -13.7%
- Equity multiple
- 0.49×
- Total profit
- $-45,547
- Equity at exit
- $47,829
- IRR
- -0.5%
- Equity multiple
- 0.96×
- Total profit
- $-3,812
- Equity at exit
- $27,735
Cash invested: $89,817 (down + closing). Projections, not guarantees.
Landlord ↔ Tenant lean methodology
- Overall (STATE)
- 90 Strongly Landlord-Friendly
- State Indiana
- 90 Strongly Landlord-Friendly · R+11
- County
- — inherits STATE
- City
- — inherits STATE
ZIP-level market 46239
- Home prices YoY
- -29.2%
- Rents YoY
- 6.1%
- Active inventory
- 337
- Price-to-rent
- 9.6×
Monthly cashflow live
- Estimated rent
- $2,756 medium interval (Pro) →
- Mortgage (P&I)
- −$1,682
- Tax est. 1.5%
- −$401 /mo · $4,812/yr
- Insurance
- −$134
- HOA
- −$0
- Vacancy / Maint / Mgmt
- −$579
- Net cashflow
- $-39
Break-even live
Sensitivity live
| Price | -10% $182 | -5% $72 | +0% $-39 | +5% $-150 | +10% $-261 |
|---|---|---|---|---|---|
| Rent | -10% $-257 | -5% $-148 | +0% $-39 | +5% $70 | +10% $178 |
| Rate | -1.0pp $122 | -0.5pp $42 | base $-39 | +0.5pp $-122 | +1.0pp $-207 |
UW: 25.0% down · 7.5% · 30yr · 1.5% tax · 5.0% vac · 8.0% maint · 8.0% mgmt
Financing live
Cash to close
- Down payment
- $80,194
- Closing costs
- $9,623
- Reserves months
- —
- Total cash needed
- —
Loan-product check · same deal, 3 products live
Conventional
25% down · 7.5% · 30yr
- Down + closing
- —
- Monthly P&I
- —
- Monthly cashflow
- —
- DSCR
- —
- Eligible?
- —
Personal DTI + credit; lowest rate.
DSCR
20% down · 8.5% · 30yr
- Down + closing
- —
- Monthly P&I
- —
- Monthly cashflow
- —
- DSCR
- —
- Eligible?
- —
No personal income docs; deal must DSCR.
Hard money
10% down · 12.0% · 12mo
- Down + closing
- —
- Monthly P&I
- —
- Monthly cashflow
- —
- DSCR
- —
- Eligible?
- —
Short-term bridge; refi at stabilization.
Rent comps 2 comps
| Address | Beds | Baths | Sqft | Rent | $/sqft | DOM | Units | Dist |
|---|---|---|---|---|---|---|---|---|
| 4526 Wild Turkey Dr Indianapolis, IN | 4.0 | 2.5 | 1880 | $1,950 | $1.04 | 9d | 1 | 0.43mi |
| 5824 Fire Opal Way Indianapolis, IN | 5.0 | 3.5 | 2750 | $2,950 | $1.07 | 25d | 1 | 1.27mi |
Listing history 13 events
-
2026-06-21days on market $317,990 Active 75 DOM
-
2026-06-18days on market $317,990 Active 72 DOM
-
2026-06-17days on market $317,990 Active 71 DOM
-
2026-06-16days on market $317,990 Active 70 DOM
-
2026-06-15days on market $317,990 Active 69 DOM
-
2026-06-13days on market $317,990 Active 67 DOM
-
2026-06-09days on market $317,990 Active 63 DOM
-
2026-06-08days on market $317,990 Active 62 DOM
-
2026-06-07days on market $317,990 Active 61 DOM
-
2026-06-03days on market $317,990 Active 57 DOM
-
2026-06-02days on market $317,990 Active 56 DOM
-
2026-06-01days on market $317,990 Active 55 DOM
-
2026-05-31days on market $317,990 Active 54 DOM
ⓘ Source: listings_history table (triggers on properties + properties_extension) + one-shot
backfill from property_details.listing_events for pre-trigger history.
Nearby sold comps map
Loading sold comps map…
Walkable amenities ~0.75 mi
Loading nearby amenities…
Taxation est. · year 1
- Rental income
- $33,076
- − Mortgage interest
- −$17,968
- − Property taxes
- −$4,812
- − Insurance
- −$1,604
- − Repairs & maintenance
- −$2,646
- − Management
- −$2,646
- − Depreciation
- −$9,332
- Taxable loss
- −$5,932
- Est. tax savings @ 24.0%
- +$1,424
- After-tax cash flow
- $952/yr
For passive investors: Depreciation is non-cash, so a rental often shows a tax loss while cash-flowing — sheltering income. Rental losses are passive: they offset passive income freely, and up to $25,000/yr can offset ordinary (W-2) income if you actively participate and your MAGI is under $100k (phasing out to $0 by $150k); unused losses carry forward. On sale, claimed depreciation is recaptured at up to 25%, and gains may owe capital-gains tax (a 1031 exchange can defer both). Figures are a year-1 estimate at your 24.0% rate — not tax advice; consult a CPA.
Condition & rehab AI · 6 photos
This well-maintained single-family home in Franklin Township offers a modern kitchen, hardwood floors, and a good curb appeal. It is ready for move-in and can be enhanced with minor exterior updates and smart home devices to boost its value.
Value-add opportunities
- Both Paint exterior shutters — Enhances curb appeal and can increase both resale and rental value
- Both Install smart home devices — Improves convenience and can attract tech-savvy buyers
- Both Add a smart thermostat — Saves energy and can lower utility bills
Renovation cost estimate screening
Value-add ROI direction
- Both Paint exterior shutters — Enhances curb appeal and can increase both resale and rental value ↑
- Both Install smart home devices — Improves convenience and can attract tech-savvy buyers ↑
- Both Add a smart thermostat — Saves energy and can lower utility bills ↑
ⓘ Cost ranges are severity-bucket heuristics (US national rule-of-thumb). Get contractor quotes + a written scope before underwriting a rehab budget.
Schools (NCES district)
- District
- Franklin Township Community School Corporation
- NCES district ID
- 1803750
- Math proficiency
- 42% ▼ -12.00%
- Reading proficiency
- 47% ▼ -6.00%
- Median HH income
- $67,825
- Composite
- 39.91/100
- National rank
- #3852
- State rank
- #87 of 301 in IN
Livability — Indianapolis city (balance)
No livability data for this city. (Only ~50 U.S. cities are tracked.)
Census & demographics
- Census place
- Indianapolis city (balance), IN
- County
- Marion County · 998,460 people
- City population
- 881,119
- Metro
- Indianapolis-Carmel-Anderson, IN
- Population (ZIP)
- 33,931
- Household income
- $100,331
- Rent vs Own
- Severe rent burden
- 567.0
Population outlook (Marion County) Hauer SSP2
- Today (2025)
- 1,025,572 people
- By 2030
- 1,065,727 · +3.9%
- By 2040
- 1,141,577 · +11.3%
- By 2050
- 1,208,920 · +17.9%
- By 2075
- 1,367,288 · +33.3%
- By 2100
- 1,438,201 · +40.2%
Race, ethnicity, and origin ACS 2023
- Neighborhood character
- Diverse neighborhood (Simpson 0.61)
- Race & ethnicity
- White 57% Black 24% Hispanic / Latino 9% Two or more races 9% Asian 4%
- Hispanic origin (detail)
- Mexican 6%
- Common ancestry
- Lithuanian 2% Slovak 2% Romanian 1%
- Foreign-born
- 7% · Canada, Philippines, China
- Languages at home
- 89% English-only · Spanish 6% Other Indo-European 2% Chinese 1%
Political lean MEDSL · Marion
- 2024 margin
- Strong D (+27.7) · D 63.0% · R 35.3% · Other 1.7%
- 2008→2024 swing
- -0.7pp no change · 2008: 28.4pp · 2024: 27.7pp
- All cycles
- 2024: D+27.7 2020: D+29.1 2016: D+22.8 2012: D+22.2 2008: D+28.4
Not yet ingested
- Civics
- —
Market trends
- HPI YoY
- ▼ -93.15%
- Current HPI
- 226.1965
- Rent YoY
- ▲ 6.11%
- Metro
- Indianapolis-Carmel-Anderson, IN
- State GDP YoY
- ▲ 2.90%
- F500 in state
- 18
Industry mix (Fortune 500 HQ in IN)
| Industry | F500 HQs | Revenue |
|---|---|---|
| Industrial Machinery | 2 | $37B |
|
||
| Healthcare | 1 | $177B |
|
||
| Pharmaceuticals | 1 | $45B |
|
||
| Metals / Steel | 1 | $18B |
|
||
| Agriculture | 1 | $17B |
|
||
| Packaging | 1 | $12B |
|
||
Cash-flow waterfall
monthlySold comps — $/sqft
last 12 mo · ≤1 miLoading sold comps…