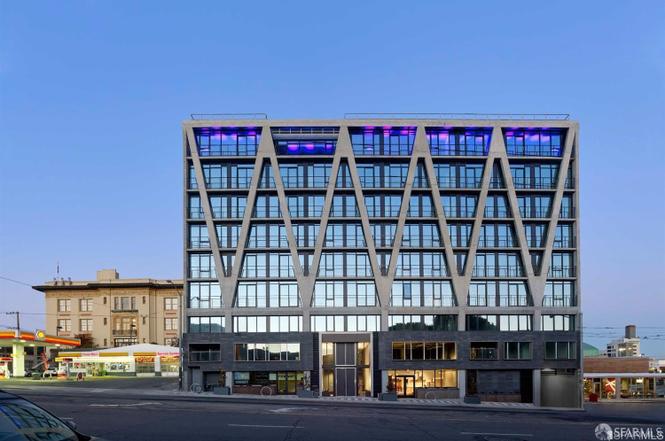
338 Potrero Ave #308 · San Francisco, CA
Flood risk 1/10 · Minimal
- FEMA flood zone
- X (unshaded)
- Chance of flooding over 30 yrs
- 0.0%
- Est. flood insurance / yr
- $507 – $1,088
Fire risk 1/10 · Minimal
- Est. fire insurance / yr
- $659 – $1,223
Heat risk 2/10 · Minimal
- Hot days now (above 78°F)
- 8 days/yr
- Hot days in 30 yrs
- 17 days/yr
Wind risk 1/10 · Minimal
- Chance of severe wind over 30 yrs
- —
Air-quality risk 8/10 · Major
- Unhealthy air days now
- 15 days/yr
- Unhealthy air days in 30 yrs
- 15 days/yr
Risk factors via First Street. Map © Google.
Why this score? — see what drove the C+ grade
The composite is a weighted blend of 9 inputs, each scored 0–100. Each bar is that input's sub-score; the figure is the points it added to the 100-point composite (weight × sub-score).
- Cash flow +17.0/30.0
- ARV discount +7.5/15.0
- Appreciation +7.5/10.0
- 1% rule +6.6/10.0
- DSCR +5.3/10.0
- Rent growth +5.0/5.0
- Schools +5.0/10.0
- Livability +3.8/5.0
- Condition / age +2.5/5.0
$414,731
🖨 Deal sheet 📄 Offer letter ✓ Due diligence
Listing remarks
2-bedroom Below Market Rate (BMR) housing opportunity available at 100% Area Median Income (AMI). Maximum income for 2 people = $124,700; 3 = $140,250; 4 = $155,850, etc. Must be 1st-time homebuyer & income eligible. Unit available thru the Mayor's Office of Housing and Community Development (MOHCD) & subject to resale controls, monitoring & other restrictions. Unit will be listed on DAHLIA, the SF Housing Portal (https://housing. sfgov. org) starting on the application date, 09/29/2025. Visit https://housing. sfgov.org for application & program info. Application, loan pre-approval, and homebuyer education verification due on 10/20/25 at 5:00 PM. OPEN HOUSE 10/03/25
Key facts
- $777 HOA
- Built 2016
- Listed 102 days
Neighborhood map
What this means for you Summary
Snapshot
- This is a 2-bed/2.0-bath condo listed at $415k.
Deal economics
- At list price, monthly cash flow is $285 ($3k/yr) — positive.
- The deal already cash-flows at list — no discount required.
- Meets the 1% rule at list price ($5k rent vs $415k).
- Recommended offer: $377k (9.0% below list) — sets the bar for market timing.
- Cap rate 7.1% vs local median 2.1% in San Francisco — top-decile yield for the area; either an underpriced asset or a hidden risk that comps aren't pricing in. Stress-test before assuming the spread holds.
Location & tenants
- Location reads 76/100 on livability (#90 in CA, #3,143 nationally) — a middle-class / working-renter tenant base. Strengths: amenities A+, commute A+, employment A+; Watch: crime F, cost of living F.
- San Francisco Unified (urban): math 50% / reading 56% proficiency, ranked #322 of 1,400 in CA (top 23%) — acceptable for families but not a draw, mixed tenant base, ~2y average lease.
- Market conditions: Rents rising fast (+15.5%/yr); 108 active listings in the ZIP; 40 comparable units currently listed for rent nearby; rentals at typical pace (median 17d on market — plan ~3-4 weeks tenant-placement turnaround); high-income renter base; 750 units permitted in San Francisco County in 2024 (688 in 5+ unit buildings).
- At $4,815/mo this rent would consume 50% of the median local household income ($116k/yr) (locally 2666% of renters already pay >50% of income on rent) — very limited rent-growth headroom before tenants either downsize or default.
Forward outlook
- In year one you build about $23k of equity ($3k loan paydown + $21k appreciation (5.0% local appreciation)).
- San Francisco County population projected at +39% by 2050 — long-run rental-demand tailwind backs the buy-and-hold thesis.
- At projected returns (5.0% appreciation + 8.0% rent growth), your $116k cash investment doubles in ~4 years — after that, you're playing with house money.
- By year 2, paydown + projected appreciation supports a ~$38k cash-out refi (75% LTV) — recoverable capital for the next deal without selling this one.
Negotiation context
- It's been on market 102 days — a 9% lower offer ($377k) is reasonable based on typical stale-listing flexibility.
Questions for the listing agent
- It's been on market 102 days. Have you received any prior offers? Is the seller open to a 9% concession, seller financing, or rate buy-down credit?
- What does the HOA fee cover, when was the last increase, and are there any pending special assessments or reserve-fund shortfalls?
- Any open or pending special assessments — roof, HVAC, plumbing, elevator, façade? What's the per-unit balance and payoff schedule, and is the seller paying it off at close or rolling it to the buyer?
- Why hasn't it sold? Are there any deal-killer items the seller is aware of (foundation, flood, title, zoning, code violations)?
- Is there a deadline driving the sale (1031 exchange, divorce, estate, relocation)? That informs how much negotiation room exists.
- Schools are B-rated — typically a magnet for longer-tenancy family renters. What's the average tenant stay here, and is there a school-zone premium baked into asking?
- Crime grade is F in this area — have there been break-ins, vandalism, or insurance claims at this property in the last 3 years? What carrier currently insures it and at what premium?
- What's the average days-on-market for RENTAL listings here right now (not sales)? A rising rental-DOM trend means longer vacancies and softer asking-rent achievability than the comps imply.
- What's the recent tenant-quality profile in this submarket — average credit score on applications, eviction rate, late-payment / NSF rate, and stable-employment percentage? A property-management company in the area should have these aggregated.
- How much new apartment / multifamily construction is in the pipeline within 1–3 miles? Heavy new supply (>2% of stock underway) typically softens rents 12–24 months out; light construction supports rent growth.
Investment metrics
- 1% rule
- 1.16% ✓
- Cap rate
- 7.12%
- Cash-on-cash
- 2.94%
- DSCR
- 1.13
- GRM
- 7.2
CMA / ARV
No comps found within radius.
Projected returns pro-forma
4.96% appreciation · 8.0% rent growth · sell at horizon
- IRR
- 18.3%
- Equity multiple
- 2.19×
- Total profit
- $138,749
- Equity at exit
- $234,078
- IRR
- 21.0%
- Equity multiple
- 5.01×
- Total profit
- $466,229
- Equity at exit
- $403,208
Cash invested: $116,125 (down + closing). Projections, not guarantees.
Landlord ↔ Tenant lean methodology
- Overall (CITY)
- 0 Strongly Tenant-Friendly
- State California
- 18 Strongly Tenant-Friendly · D+13
- County
- — inherits STATE
- City San Francisco
- 0 Strongly Tenant-Friendly · D+57
ZIP-level market 94103
- Home prices YoY
- 2.9%
- Rents YoY
- 15.5%
- Active inventory
- 108
- Price-to-rent
- 7.2×
Monthly cashflow live
- Estimated rent
- $4,815 high interval (Pro) →
- Mortgage (P&I)
- −$2,175
- Tax from tax record
- −$395 /mo · $4,736/yr
- Insurance
- −$173
- HOA
- −$777
- Vacancy / Maint / Mgmt
- −$1,011
- Net cashflow
- $285
Break-even live
UW: 25.0% down · 7.5% · 30yr · 1.5% tax · 5.0% vac · 8.0% maint · 8.0% mgmt
Financing live
Cash to close
- Down payment
- $103,683
- Closing costs
- $12,442
- Reserves months
- —
- Total cash needed
- —
Loan-product check · same deal, 3 products live
Conventional
25% down · 7.5% · 30yr
- Down + closing
- —
- Monthly P&I
- —
- Monthly cashflow
- —
- DSCR
- —
- Eligible?
- —
Personal DTI + credit; lowest rate.
DSCR
20% down · 8.5% · 30yr
- Down + closing
- —
- Monthly P&I
- —
- Monthly cashflow
- —
- DSCR
- —
- Eligible?
- —
No personal income docs; deal must DSCR.
Hard money
10% down · 12.0% · 12mo
- Down + closing
- —
- Monthly P&I
- —
- Monthly cashflow
- —
- DSCR
- —
- Eligible?
- —
Short-term bridge; refi at stabilization.
Rent comps 40 comps
| Address | Beds | Baths | Sqft | Rent | $/sqft | DOM | Units | Dist |
|---|---|---|---|---|---|---|---|---|
| 451 Kansas St #375 San Francisco, CA | 1.0 | 1.0 | 661 | $4,350 | $6.58 | 18d | 1 | 0.26mi |
| 2823 18th St San Francisco, CA | 1.0 | 1.0 | 519 | $4,718 | $9.08 | 2d | 4 | 0.27mi |
| 291 15th St San Francisco, CA | 1.0 | 1.0 | 550 | $2,695 | $4.90 | 24d | 1 | 0.28mi |
| 1 Henry Adams St San Francisco, CA | 3.0 | 2.0 | 873 | $6,759 | $7.74 | 1d | 3 | 0.39mi |
| 1532 Harrison St San Francisco, CA | 2.0 | 1.0–2.0 | 617 | $4,897 | $7.94 | 2d | 11 | 0.47mi |
| 88 Arkansas St #105 San Francisco, CA | 1.0 | 1.0 | 604 | $4,000 | $6.62 | 43d | 1 | 0.49mi |
| 380 10th St San Francisco, CA | 2.0 | 2.0 | 1122 | $5,495 | $4.90 | 44d | 1 | 0.51mi |
| 855 Brannan St San Francisco, CA | 3.0 | 1.0–2.0 | 958 | $6,137 | $6.41 | 1d | 5 | 0.52mi |
| 1247 Harrison St #21 San Francisco, CA | 1.0 | 1.5 | 1089 | $4,950 | $4.55 | 18d | 1 | 0.55mi |
| 799 S Van Ness Ave San Francisco, CA | 1.0–2.0 | 1.0 | 740 | $4,500 | $6.08 | 2d | 2 | 0.57mi |
| 1010 16th St San Francisco, CA | 2.0 | 1.0–2.0 | 963 | $5,786 | $6.01 | 2d | 8 | 0.57mi |
| 975 Bryant St San Francisco, CA | 2.0 | 1.0–2.0 | 697 | $6,104 | $8.76 | 1d | 10 | 0.58mi |
| 1222 Harrison St San Francisco, CA | 2.0 | 1.0–2.5 | 853 | $6,299 | $7.38 | 2d | 34 | 0.59mi |
| 2830 22nd St Unit 2830 San Francisco, CA | 2.0 | 2.0 | 1090 | $5,200 | $4.77 | 16d | 1 | 0.64mi |
| 2115-2117 22nd St Unit 2117 San Francisco, CA | 2.0 | 1.0 | 1000 | $4,600 | $4.60 | 21d | 1 | 0.64mi |
| 1875 Mission St #210 San Francisco, CA | 1.0 | 1.0 | 825 | $4,000 | $4.85 | 43d | 1 | 0.64mi |
| 345 8th St San Francisco, CA | 1.0 | 1.0 | 946 | $4,095 | $4.33 | 43d | 2 | 0.66mi |
| 1600 15th St San Francisco, CA | 1.0–2.0 | 1.0–2.0 | 792 | $5,614 | $7.08 | 3d | 5 | 0.68mi |
| 2333 Mission St #2 San Francisco, CA | 2.0 | 2.0 | 1010 | $4,900 | $4.85 | 7d | 1 | 0.71mi |
| 23 Boardman Pl Unit LTBP23F San Francisco, CA | 3.0 | 1.0 | 1050 | $4,700 | $4.48 | 43d | 1 | 0.73mi |
| 2629 Folsom St Unit 106 San Francisco, CA | 2.0 | 1.0 | 718 | $4,395 | $6.12 | 18d | 1 | 0.75mi |
| 2629 Folsom St Unit 204 San Francisco, CA | 2.0 | 1.0 | 718 | $4,095 | $5.70 | 43d | 1 | 0.75mi |
| 2629 Folsom St Unit 105 San Francisco, CA | 1.0 | 1.0 | 546 | $3,100 | $5.68 | 18d | 1 | 0.75mi |
| 60 Rausch St San Francisco, CA | 1.0 | 1.0 | 767 | $4,300 | $5.61 | 5d | 1 | 0.77mi |
| 73 Sumner St San Francisco, CA | 2.0 | 2.0 | 1100 | $4,750 | $4.32 | 43d | 1 | 0.77mi |
| 2246 23rd St San Francisco, CA | 1.0 | 1.0 | 650 | $3,506 | $5.39 | 43d | 1 | 0.77mi |
| 99 Rausch St San Francisco, CA | 1.0 | 1.0 | 655 | $4,250 | $6.49 | 24d | 1 | 0.78mi |
| 1288 Howard St #1908 San Francisco, CA | 1.0–2.0 | 1.0–2.0 | 782 | $6,710 | $8.58 | 1d | 2 | 0.78mi |
| 360 Berry St San Francisco, CA | 1.0–2.0 | 1.0–2.0 | 842 | $6,800 | $8.08 | 1d | 4 | 0.81mi |
| 355 Berry St San Francisco, CA | 1.0 | 1.0 | 707 | $4,968 | $7.02 | 1d | 4 | 0.81mi |
| 673 Brannan St San Francisco, CA | 1.0–5.0 | 1.0–2.0 | 1302 | $4,659 | $3.58 | 1d | 2 | 0.82mi |
| 2250 24th St #121 San Francisco, CA | 1.0 | 1.0 | 602 | $3,623 | $6.02 | 18d | 1 | 0.83mi |
| 30 Otis St San Francisco, CA | 2.0 | 1.0–2.0 | 874 | $10,000 | $11.44 | 2d | 13 | 0.84mi |
| 155 Harriet St #1 San Francisco, CA | 2.0 | 1.5 | 920 | $3,595 | $3.91 | 43d | 1 | 0.88mi |
| 922 Valencia St San Francisco, CA | 3.0 | 3.0 | 1100 | $8,450 | $7.68 | 43d | 1 | 0.88mi |
| 1395 22nd St San Francisco, CA | 1.0–2.0 | 1.0–2.0 | 808 | $10,000 | $12.37 | 1d | 3 | 0.89mi |
| 300 Berry St #907 San Francisco, CA | 1.0 | 1.0 | 732 | $5,000 | $6.83 | 7d | 1 | 0.89mi |
| 68 McCoppin St San Francisco, CA | 1.0 | 1.0 | 734 | $3,825 | $5.21 | 16d | 2 | 0.89mi |
| 1 Brady St San Francisco, CA | 2.0 | 1.0–2.0 | 889 | $7,385 | $8.30 | 1d | 29 | 0.90mi |
| 603 Natoma St Apt 406 San Francisco, CA | 1.0 | 1.0 | 556 | $2,950 | $5.31 | 43d | 1 | 0.91mi |
HOA detail condo
- Monthly dues
- $777 · $9,324/yr
- Assessments
- None detected in remarks — confirm with the listing agent.
Listing history 2 events
-
2026-01-10status Pending
-
2025-09-29$414,731 Active
ⓘ Source: listings_history table (triggers on properties + properties_extension) + one-shot
backfill from property_details.listing_events for pre-trigger history.
Tax reassessment forecast CA · Resets to sale price
- Current annual tax
- $4,736 · $395/mo
- Projected year-2 tax
- $4,736 · $395/mo
- Expected delta
- $0/yr ($0/mo · 0.0%)
ⓘ Screening estimate from a state-policy table — verify with the county assessor before closing.
Climate risk First Street
- Flood 1/10 Low FEMA zone X (unshaded) · 0% chance over 30 yrs
- Wildfire 1/10 Low
- Heat 2/10 Low 8 d/yr ≥78°F today · 17 d/yr by 30 yrs out
- Wind 1/10 Low
- Air quality 8/10 Severe 15 unhealthy d/yr today · 15 by 30 yrs out
Nearby sold comps map
Loading sold comps map…
Walkable amenities ~0.75 mi
Loading nearby amenities…
Taxation est. · year 1
- Rental income
- $57,781
- − Mortgage interest
- −$23,231
- − Property taxes
- −$4,736
- − Insurance
- −$2,074
- − Repairs & maintenance
- −$4,623
- − Management
- −$4,623
- − HOA
- −$9,324
- − Depreciation
- −$12,065
- Taxable loss
- −$2,893
- Est. tax savings @ 24.0%
- +$694
- After-tax cash flow
- $4,110/yr
For passive investors: Depreciation is non-cash, so a rental often shows a tax loss while cash-flowing — sheltering income. Rental losses are passive: they offset passive income freely, and up to $25,000/yr can offset ordinary (W-2) income if you actively participate and your MAGI is under $100k (phasing out to $0 by $150k); unused losses carry forward. On sale, claimed depreciation is recaptured at up to 25%, and gains may owe capital-gains tax (a 1031 exchange can defer both). Figures are a year-1 estimate at your 24.0% rate — not tax advice; consult a CPA.
Schools (NCES district)
- District
- San Francisco Unified
- NCES district ID
- 0634410
- Math proficiency
- 50% ▬ 0.00%
- Reading proficiency
- 56% ▲ 1.00%
- Median HH income
- $81,249
- Composite
- 50.14/100
- National rank
- #4088
- State rank
- #322 of 1400 in CA
Livability — San Francisco
- Score
- 76/100
- State rank
- #90
- US rank
- #3143
Category grades
Schools grade is shown separately in the Schools card above.
Census & demographics
- Census place
- San Francisco, CA
- County
- San Francisco County · 827,552 people
- City population
- 827,552
- Metro
- San Francisco-Oakland-Berkeley, CA
- Population (ZIP)
- 34,964
- Household income
- $116,438
- Rent vs Own
- Severe rent burden
- 2666.0
Population outlook (San Francisco County) Hauer SSP2
- Today (2025)
- 1,030,936 people
- By 2030
- 1,110,409 · +7.7%
- By 2040
- 1,270,010 · +23.2%
- By 2050
- 1,435,001 · +39.2%
- By 2075
- 1,779,074 · +72.6%
- By 2100
- 1,966,767 · +90.8%
Race, ethnicity, and origin ACS 2023
- Neighborhood character
- Highly diverse neighborhood (Simpson 0.75)
- Race & ethnicity
- White 32% Asian 31% Hispanic / Latino 20% Two or more races 11% Black 10% Native American 2%
- Hispanic origin (detail)
- Mexican 11%
- Common ancestry
- Lithuanian 2% Slovak 2% Romanian 2%
- Foreign-born
- 36% · Canada, China, Vietnam
- Languages at home
- 56% English-only · Spanish 16% Chinese 9% Tagalog/Filipino 6%
Political lean MEDSL · San Francisco
- 2024 margin
- Solid D (+64.8) · D 80.3% · R 15.5% · Other 4.1%
- 2008→2024 swing
- -5.7pp toward R · 2008: 70.5pp · 2024: 64.8pp
- All cycles
- 2024: D+64.8 2020: D+72.5 2016: D+76.1 2012: D+70.2 2008: D+70.5
Not yet ingested
- Civics
- —
Market trends
- HPI YoY
- ▲ 4.96%
- Current HPI
- 175.4945
- Rent YoY
- ▲ 15.50%
- Metro
- San Francisco-Oakland-Berkeley, CA
- State GDP YoY
- ▲ 3.21%
- F500 in state
- 116
Industry mix (Fortune 500 HQ in CA)
| Industry | F500 HQs | Revenue |
|---|---|---|
| Technology | 27 | $1,492B |
|
||
| Financial Services | 3 | $174B |
|
||
| Retail | 3 | $44B |
|
||
| Insurance | 3 | $26B |
|
||
| Media / Entertainment | 2 | $115B |
|
||
| Pharmaceuticals / Biotech | 2 | $62B |
|
||
Price history
2 events — show timeline
- 2026-01-10 Pending — San Francisco MLS
- 2025-09-29 Listed $414,731 San Francisco MLS
Property tax history
+18.4%/yrLatest (2025): $4,736 · +2.9% YoY. Source: county tax records.
Cash-flow waterfall
monthlySold comps — $/sqft
last 12 mo · ≤1 miLoading sold comps…