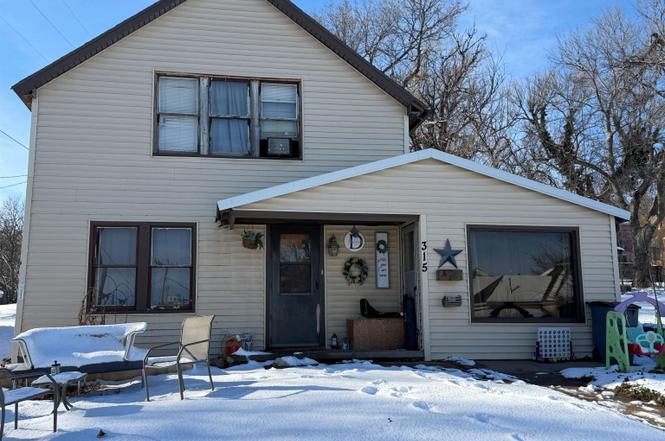
315 Santa Fe St St · Larned, KS
Flood risk 1/10 · Minimal
- FEMA flood zone
- —
- Chance of flooding over 30 yrs
- 0.0%
- Est. flood insurance / yr
- —
Fire risk 4/10 · Minor
- Est. fire insurance / yr
- $1,154 – $2,142
Heat risk 5/10 · Moderate
- Hot days now (above 104°F)
- 7 days/yr
- Hot days in 30 yrs
- 18 days/yr
Wind risk 2/10 · Minimal
- Chance of severe wind over 30 yrs
- —
Air-quality risk 2/10 · Minimal
- Unhealthy air days now
- 0 days/yr
- Unhealthy air days in 30 yrs
- 1 days/yr
Risk factors via First Street. Map © Google.
Why this score? — see what drove the B grade
The composite is a weighted blend of 9 inputs, each scored 0–100. Each bar is that input's sub-score; the figure is the points it added to the 100-point composite (weight × sub-score).
- Cash flow +30.0/30.0
- 1% rule +10.0/10.0
- DSCR +10.0/10.0
- ARV discount +7.5/15.0
- Livability +3.6/5.0
- Schools +3.2/10.0
- Rent growth +2.5/5.0
- Condition / age +2.5/5.0
- Appreciation +1.0/10.0
$36,900
🖨 Deal sheet 📄 Offer letter ✓ Due diligence
Key facts
- New flooring
- Original wood floors
- Energy efficiency
Tags
Property features AI
Exterior
- Utilities: Public water; Public sewer
- Home design: Single-story residential property
- Construction: Wood siding construction
- Exterior features: Lot zoned NC.3 / R-3
Interior
- Heating & cooling: Central heating; Electric heating; Window unit cooling
- Interior features: 5 total rooms
Neighborhood map
What this means for you Summary
Snapshot
- This is a 2-bed/2.0-bath single-family listed at $37k.
Deal economics
- At list price, monthly cash flow is $580 ($7k/yr) — positive.
- The deal already cash-flows at list — no discount required.
- Meets the 1% rule at list price ($1k rent vs $37k).
- Recommended offer: $32k (12.0% below list) — sets the bar for market timing.
Location & tenants
- Location reads 72/100 on livability (#120 in KS) — a middle-class / working-renter tenant base. Strengths: cost of living A+, housing A+, health & safety A+; Watch: schools C-, employment D+, amenities F.
- Ft Larned (town): math 32% / reading 43% proficiency, ranked #49 of 169 in KS (top 29%) — families likely to look elsewhere, expect single-tenant / working-renter base with shorter leases.
- Market conditions: 50 active listings in the ZIP.
Forward outlook
- Local home prices are declining (-3.0%/yr); year-one equity from $255 of loan paydown is wiped out by about $1k of value loss. Plan a longer hold.
- Pawnee County population projected to shrink 5% by 2050 — rents likely to lag national; underwrite the cash flow, not the appreciation.
- At projected returns (-3.0% appreciation + 3.0% rent growth), your $10k cash investment doubles in ~2 years — after that, you're playing with house money.
Negotiation context
- It's been on market 156 days — a 12% lower offer ($32k) is reasonable based on typical stale-listing flexibility.
Risks & watch-outs
- Watch-outs: built in 1930 — expect roof / HVAC / electrical / plumbing capex.
- Climate carrying-cost: extreme-heat days projected 7→18/yr by 2055 (HVAC capex compounding) — expect insurance premiums to compound above CPI over the hold.
Questions for the listing agent
- It's been on market 156 days. Have you received any prior offers? Is the seller open to a 12% concession, seller financing, or rate buy-down credit?
- Built in 1930 — when were the roof, HVAC, electrical panel, plumbing, and water heater last replaced?
- Why hasn't it sold? Are there any deal-killer items the seller is aware of (foundation, flood, title, zoning, code violations)?
- Is there a deadline driving the sale (1031 exchange, divorce, estate, relocation)? That informs how much negotiation room exists.
- What's the average days-on-market for RENTAL listings here right now (not sales)? A rising rental-DOM trend means longer vacancies and softer asking-rent achievability than the comps imply.
- What's the recent tenant-quality profile in this submarket — average credit score on applications, eviction rate, late-payment / NSF rate, and stable-employment percentage? A property-management company in the area should have these aggregated.
- How much new for-sale + rental construction is in the pipeline within 1–3 miles? Heavy new supply typically softens prices + rents 12–24 months out; constrained supply supports both.
Investment metrics
- 1% rule
- 2.86% ✓
- Cap rate
- 25.15%
- Cash-on-cash
- 67.35%
- DSCR
- 4.00
- GRM
- 2.9
CMA / ARV
No comps found within radius.
Projected returns pro-forma
-3.0% appreciation · 3.0% rent growth · sell at horizon
- IRR
- 66.7%
- Equity multiple
- 4.00×
- Total profit
- $30,967
- Equity at exit
- $5,502
- IRR
- 70.9%
- Equity multiple
- 8.22×
- Total profit
- $74,585
- Equity at exit
- $3,190
Cash invested: $10,332 (down + closing). Projections, not guarantees.
Landlord ↔ Tenant lean methodology
- Overall (STATE)
- 83 Strongly Landlord-Friendly
- State Kansas
- 83 Strongly Landlord-Friendly · R+10
- County
- — inherits STATE
- City
- — inherits STATE
ZIP-level market 67550
- Home prices YoY
- -4.2%
- Active inventory
- 50
- Price-to-rent
- 2.9×
Monthly cashflow live
- Estimated rent
- $1,057 medium interval (Pro) →
- Mortgage (P&I)
- −$194
- Tax est. 1.5%
- −$46 /mo · $554/yr
- Insurance
- −$15
- HOA
- −$0
- Vacancy / Maint / Mgmt
- −$222
- Net cashflow
- $580
Break-even live
UW: 25.0% down · 7.5% · 30yr · 1.5% tax · 5.0% vac · 8.0% maint · 8.0% mgmt
Financing live
Cash to close
- Down payment
- $9,225
- Closing costs
- $1,107
- Reserves months
- —
- Total cash needed
- —
Loan-product check · same deal, 3 products live
Conventional
25% down · 7.5% · 30yr
- Down + closing
- —
- Monthly P&I
- —
- Monthly cashflow
- —
- DSCR
- —
- Eligible?
- —
Personal DTI + credit; lowest rate.
DSCR
20% down · 8.5% · 30yr
- Down + closing
- —
- Monthly P&I
- —
- Monthly cashflow
- —
- DSCR
- —
- Eligible?
- —
No personal income docs; deal must DSCR.
Hard money
10% down · 12.0% · 12mo
- Down + closing
- —
- Monthly P&I
- —
- Monthly cashflow
- —
- DSCR
- —
- Eligible?
- —
Short-term bridge; refi at stabilization.
Listing history 17 events
-
2026-06-18days on market $36,900 Active 156 DOM
-
2026-06-17days on market $36,900 Active 155 DOM
-
2026-06-16days on market $36,900 Active 154 DOM
-
2026-06-15days on market $36,900 Active 153 DOM
-
2026-06-13days on market $36,900 Active 151 DOM
-
2026-06-12days on market $36,900 Active 150 DOM
-
2026-06-09days on market $36,900 Active 147 DOM
-
2026-06-08days on market $36,900 Active 146 DOM
-
2026-06-07days on market $36,900 Active 145 DOM
-
2026-06-05days on market $36,900 Active 143 DOM
-
2026-06-04days on market $36,900 Active 141 DOM
-
2026-06-02days on market $36,900 Active 140 DOM
-
2026-06-01days on market $36,900 Active 139 DOM
-
2026-05-31days on market $36,900 Active 138 DOM
-
2026-05-31days on market $36,900 Active 137 DOM
-
2026-05-07price $36,900
-
2026-01-13$39,900 Active
ⓘ Source: listings_history table (triggers on properties + properties_extension) + one-shot
backfill from property_details.listing_events for pre-trigger history.
Climate risk First Street
- Flood 1/10 Low 0% chance over 30 yrs
- Wildfire 4/10 Moderate
- Heat 5/10 Major 7 d/yr ≥104°F today · 18 d/yr by 30 yrs out
- Wind 2/10 Low
- Air quality 2/10 Low 0 unhealthy d/yr today · 1 by 30 yrs out
Nearby sold comps map
Loading sold comps map…
Walkable amenities ~0.75 mi
Loading nearby amenities…
Taxation est. · year 1
- Rental income
- $12,681
- − Mortgage interest
- −$2,067
- − Property taxes
- −$554
- − Insurance
- −$184
- − Repairs & maintenance
- −$1,015
- − Management
- −$1,015
- − Depreciation
- −$1,073
- Taxable income
- $6,774
- Est. tax owed @ 24.0%
- −$1,626
- After-tax cash flow
- $5,332/yr
For passive investors: Depreciation is non-cash, so a rental often shows a tax loss while cash-flowing — sheltering income. Rental losses are passive: they offset passive income freely, and up to $25,000/yr can offset ordinary (W-2) income if you actively participate and your MAGI is under $100k (phasing out to $0 by $150k); unused losses carry forward. On sale, claimed depreciation is recaptured at up to 25%, and gains may owe capital-gains tax (a 1031 exchange can defer both). Figures are a year-1 estimate at your 24.0% rate — not tax advice; consult a CPA.
Schools (NCES district)
- District
- Ft Larned
- NCES district ID
- 2008370
- Math proficiency
- 32% ▬ 0.00%
- Reading proficiency
- 43% ▲ 8.00%
- Median HH income
- $42,806
- Composite
- 31.69/100
- National rank
- #5919
- State rank
- #49 of 169 in KS
Livability — Larned
- Score
- 72/100
- State rank
- #120
- US rank
- #6324
Category grades
Schools grade is shown separately in the Schools card above.
Census & demographics
- Census place
- Larned, KS
- Population (ZIP)
- 5,137
Population outlook (Pawnee County) Hauer SSP2
- Today (2025)
- 6,800 people
- By 2030
- 6,739 · -0.9%
- By 2040
- 6,627 · -2.5%
- By 2050
- 6,477 · -4.8%
- By 2075
- 6,369 · -6.3%
- By 2100
- 6,266 · -7.9%
Race, ethnicity, and origin ACS 2023
- Neighborhood character
- Predominantly White (80%)
- Race & ethnicity
- White 80% Hispanic / Latino 9% Black 8% Two or more races 3% Native American 1%
- Hispanic origin (detail)
- Mexican 4%
- Common ancestry
- Italian 3% Iranian 3% Serbian 2%
- Foreign-born
- 0%
- Languages at home
- 98% English-only · Spanish 2%
Political lean MEDSL · Pawnee
- 2024 margin
- Solid R (+51.5) · D 23.4% · R 74.9% · Other 1.8%
- 2008→2024 swing
- -14.4pp toward R · 2008: -37.1pp · 2024: -51.5pp
- All cycles
- 2024: R+51.5 2020: R+51.4 2016: R+50.1 2012: R+43.0 2008: R+37.1
Not yet ingested
- Civics
- —
Market trends
- HPI YoY
- ▼ -7.95%
- Current HPI
- 182.5283
- Rent YoY
- —
- Metro
- —
- State GDP YoY
- —
- F500 in state
- 0
Price history
-7.5% since first listed2 events — show timeline
- 2026-05-07 Price Changed $36,900 Hays MLS
- 2026-01-13 Listed $39,900 Hays MLS
Cash-flow waterfall
monthlySold comps — $/sqft
last 12 mo · ≤1 miLoading sold comps…