 Duplex
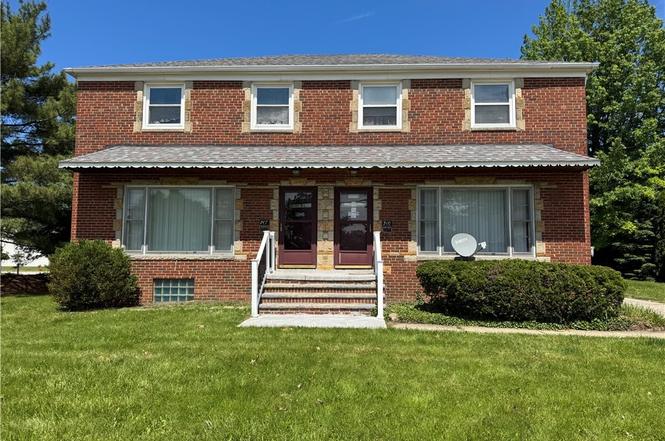
747 Babbitt Rd · Euclid, OH
Flood risk 1/10 · Minimal
- FEMA flood zone
- X (unshaded)
- Chance of flooding over 30 yrs
- 0.0%
- Est. flood insurance / yr
- $473 – $860
Fire risk 1/10 · Minimal
- Est. fire insurance / yr
- $713 – $1,323
Heat risk 3/10 · Minor
- Hot days now (above 94°F)
- 7 days/yr
- Hot days in 30 yrs
- 17 days/yr
Wind risk 1/10 · Minimal
- Chance of severe wind over 30 yrs
- —
Air-quality risk 3/10 · Minor
- Unhealthy air days now
- 3 days/yr
- Unhealthy air days in 30 yrs
- 4 days/yr
Risk factors via First Street. Map © Google.
Why this score? — see what drove the C+ grade
The composite is a weighted blend of 9 inputs, each scored 0–100. Each bar is that input's sub-score; the figure is the points it added to the 100-point composite (weight × sub-score).
- Cash flow +25.9/30.0
- DSCR +8.7/10.0
- ARV discount +7.9/15.0
- 1% rule +7.4/10.0
- Livability +3.9/5.0
- Rent growth +3.8/5.0
- Condition / age +2.5/5.0
- Schools +1.7/10.0
- Appreciation +0.0/10.0
$239,900
🖨 Deal sheet (PDF) 📄 Offer letter ✓ Due diligence
Multi-family units
County records classify this as Multi-Family (2-4 Unit). Listing-text estimate: 2 units. confirmed
Listing remarks
Investor opportunity in the heart of Euclid! This well-maintained brick side-by-side duplex features two spacious units with a total of 3 bedrooms and 1 bathroom. The property offers solid rental income potential with both tenant leases in place through July 1, 2026, and August 1, 2026, providing immediate cash flow and stability for the next owner. Major improvements have already been completed, including a newer roof, updated mechanical systems, and several newer windows, helping reduce future capital expenditures. The durable brick exterior provides low-maintenance ownership, while the side-by-side layout offers privacy and strong tenant appeal. Conveniently located near shopping, dining
Key facts
- Newer roof
- Side-by-side layout
- Newer windows
Tags
Property features AI
Finance
- Other:
- Financial info: Owner pays water and sewer; Annual tax amount available
- HOA & community:
Exterior
- Parking: Attached garage; 2-car garage
- Security:
- Utilities: Public water; Public sewer
- Home design: 2-story brick home; Asphalt roof; Year built per assessor
- Construction: Brick construction; Asphalt roof
- Exterior features: Public water; Public sewer
Interior
- Kitchen:
- Bedrooms:
- Flooring:
- Bathrooms: 2 full bathrooms
- Heating & cooling: Central air conditioning; Forced air heating
- Interior features: Partially finished basement; 12 total rooms; One building on the property
- Laundry & utility:
Neighborhood map
What this means for you Summary
Snapshot
- This is a 2 × 3-bed/1.0-bath units multifamily listed at $240k.
Deal economics
- At list price, monthly cash flow is $590 ($7k/yr) — positive. Per door: $295/mo.
- The deal already cash-flows at list — no discount required.
- Meets the 1% rule at list price ($3k rent vs $240k).
- Cap rate 9.2% vs local median 6.8% in Euclid — top-decile yield for the area; either an underpriced asset or a hidden risk that comps aren't pricing in. Stress-test before assuming the spread holds.
Location & tenants
- Location reads 77/100 on livability (#204 in OH, #3,149 nationally) — a middle-class / working-renter tenant base. Strengths: cost of living A+, housing A+, crime B+; Watch: schools C-, commute F, employment D-.
- Euclid City (suburban): math 14% / reading 28% proficiency, ranked #625 of 656 in OH (top 95%) — low school quality limits family demand, transient renter base, plan for 1-2y turnover; 70% free/reduced lunch — lower-income household profile, screen leases tightly.
- Market conditions: Rents rising fast (+5.3%/yr); 93 active listings in the ZIP; 1 comparable units currently listed for rent nearby; 1,441 units permitted in Cuyahoga County in 2024 (700 in 5+ unit buildings).
- At $2,982/mo this rent would consume 64% of the median local household income ($56k/yr) (locally 1085% of renters already pay >50% of income on rent) — very limited rent-growth headroom before tenants either downsize or default.
Forward outlook
- Local home prices are declining (-3.0%/yr); year-one equity from $2k of loan paydown is wiped out by about $7k of value loss. Plan a longer hold.
- Cuyahoga County population projected to shrink 8% by 2050 — rents likely to lag national; underwrite the cash flow, not the appreciation.
- At projected returns (-3.0% appreciation + 5.3% rent growth), your $67k cash investment doubles in ~9 years — after that, you're playing with house money.
Negotiation context
- Only 4 days on market — expect competitive offers; lowballing is unlikely to land.
- 2 sale attempts since 26y ago with the ask held roughly flat each time — persistent listings suggest the price (not the market) is what's stuck; bring a comps-based counter.
- Current owner paid $153k; list at $240k implies a 57% gain — meaningful room to come down on a strong offer.
Risks & watch-outs
- Watch-outs: built in 1956 — expect roof / HVAC / electrical / plumbing capex.
Questions for the listing agent
- Can we see the unit-by-unit rent roll, current vacancy, and any below-market leases? What's the average tenancy length?
- What capital expenditures (roof, boiler, parking lot, exteriors) have been made in the last 5 years, and what's planned in the next 2?
- Built in 1956 — when were the roof, HVAC, electrical panel, plumbing, and water heater last replaced?
- Is there a deadline driving the sale (1031 exchange, divorce, estate, relocation)? That informs how much negotiation room exists.
- What's the average days-on-market for RENTAL listings here right now (not sales)? A rising rental-DOM trend means longer vacancies and softer asking-rent achievability than the comps imply.
- What's the recent tenant-quality profile in this submarket — average credit score on applications, eviction rate, late-payment / NSF rate, and stable-employment percentage? A property-management company in the area should have these aggregated.
- How much new apartment / multifamily construction is in the pipeline within 1–3 miles? Heavy new supply (>2% of stock underway) typically softens rents 12–24 months out; light construction supports rent growth.
Investment metrics
- 1% rule
- 1.24% ✓
- Cap rate
- 9.24%
- Cash-on-cash
- 10.53%
- DSCR
- 1.47
- GRM
- 6.7
CMA / ARV
- ARV (on-the-fly)
- $241,920
- Comps found
- 3
Show comp detail 3 sales within ~0.75 mi
| Address | Dist | Beds/Ba | Sqft | Sold | Price | $/sf | Match |
|---|---|---|---|---|---|---|---|
| 663 Babbitt Rd | 0.14mi | 6/3.0 | 2,940 (+9%) | 0mo | $265,000 | $90 | 73 |
| 665 Babbitt Rd | 0.13mi | 6/2.0 | 2,382 (-11%) | 11mo | $239,900 | $101 | 65 |
| 836 E 236th St | 0.25mi | 5/3.0 (-1) | 2,900 (+8%) | 8mo | $205,000 | $71 | 59 |
Match score weights: distance 35% · size 25% · config 20% · recency 20%. Top-matched comps best support the ARV.
Projected returns pro-forma
-3.0% appreciation · 5.28% rent growth · sell at horizon
- IRR
- 2.2%
- Equity multiple
- 1.09×
- Total profit
- $5,790
- Equity at exit
- $35,770
- IRR
- 14.0%
- Equity multiple
- 2.25×
- Total profit
- $83,937
- Equity at exit
- $20,742
Cash invested: $67,172 (down + closing). Projections, not guarantees.
Landlord ↔ Tenant lean methodology
- Overall (STATE)
- 73 Landlord-Friendly
- State Ohio
- 73 Landlord-Friendly · R+6
- County
- — inherits STATE
- City
- — inherits STATE
ZIP-level market 44123
- Home prices YoY
- -25.0%
- Rents YoY
- 5.3%
- Active inventory
- 93
- Price-to-rent
- 13.4×
Monthly cashflow live
- Estimated rent
- $2,982 high interval (Pro) →
- Mortgage (P&I)
- −$1,258
- Tax from tax record
- −$408 /mo · $4,897/yr
- Insurance
- −$100
- HOA
- −$0
- Vacancy / Maint / Mgmt
- −$626
- Net cashflow
- $590
Break-even live
Sensitivity live
| Price | -10% $725 | -5% $658 | +0% $590 | +5% $522 | +10% $454 |
|---|---|---|---|---|---|
| Rent | -10% $354 | -5% $472 | +0% $590 | +5% $707 | +10% $825 |
| Rate | -1.0pp $710 | -0.5pp $651 | base $590 | +0.5pp $528 | +1.0pp $464 |
2-unit breakdown (identical units grouped — click to expand)
| Units | Beds | Baths | Est. rent |
|---|---|---|---|
| 2× units | 3 | 1 | $2,982 |
| #1 | 3 | 1 | $1,491 |
| #2 | 3 | 1 | $1,491 |
| Total (2 units) | $2,982 | ||
UW: 25.0% down · 7.5% · 30yr · 1.5% tax · 5.0% vac · 8.0% maint · 8.0% mgmt
Financing live
Cash to close
- Down payment
- $59,975
- Closing costs
- $7,197
- Reserves months
- —
- Total cash needed
- —
Loan-product check · same deal, 3 products live
Conventional
25% down · 7.5% · 30yr
- Down + closing
- —
- Monthly P&I
- —
- Monthly cashflow
- —
- DSCR
- —
- Eligible?
- —
Personal DTI + credit; lowest rate.
DSCR
20% down · 8.5% · 30yr
- Down + closing
- —
- Monthly P&I
- —
- Monthly cashflow
- —
- DSCR
- —
- Eligible?
- —
No personal income docs; deal must DSCR.
Hard money
10% down · 12.0% · 12mo
- Down + closing
- —
- Monthly P&I
- —
- Monthly cashflow
- —
- DSCR
- —
- Eligible?
- —
Short-term bridge; refi at stabilization.
Rent comps 1 comps
| Address | Beds | Baths | Sqft | Rent | $/sqft | DOM | Units | Dist |
|---|---|---|---|---|---|---|---|---|
| 19450 Monterey Ave Cleveland, OH | 5.0 | 1.5 | 1800 | $1,690 | $0.94 | 5d | 1 | 1.50mi |
Listing history 5 events
-
2026-06-18days on market $239,900 Active 4 DOM
-
2026-06-17days on market $239,900 Active 3 DOM
-
2026-06-16days on market $239,900 Active 2 DOM
-
2026-06-15remarks 699-char remark
-
2026-06-15$239,900 Active 1 DOM
ⓘ Source: listings_history table (triggers on properties + properties_extension) + one-shot
backfill from property_details.listing_events for pre-trigger history.
Tax reassessment forecast OH · Partial reset (capped growth)
- Current annual tax
- $4,897 · $408/mo
- Projected year-2 tax
- $4,897 · $408/mo
- Expected delta
- $0/yr ($0/mo · 0.0%)
ⓘ Screening estimate from a state-policy table — verify with the county assessor before closing.
Climate risk First Street
- Flood 1/10 Low FEMA zone X (unshaded) · 0% chance over 30 yrs
- Wildfire 1/10 Low
- Heat 3/10 Moderate 7 d/yr ≥94°F today · 17 d/yr by 30 yrs out
- Wind 1/10 Low
- Air quality 3/10 Moderate 3 unhealthy d/yr today · 4 by 30 yrs out
Nearby sold comps map
Loading sold comps map…
Walkable amenities ~0.75 mi
Loading nearby amenities…
Taxation est. · year 1
- Rental income
- $35,784
- − Mortgage interest
- −$13,438
- − Property taxes
- −$4,897
- − Insurance
- −$1,200
- − Repairs & maintenance
- −$2,863
- − Management
- −$2,863
- − Depreciation
- −$6,979
- Taxable income
- $3,545
- Est. tax owed @ 24.0%
- −$851
- After-tax cash flow
- $6,225/yr
For passive investors: Depreciation is non-cash, so a rental often shows a tax loss while cash-flowing — sheltering income. Rental losses are passive: they offset passive income freely, and up to $25,000/yr can offset ordinary (W-2) income if you actively participate and your MAGI is under $100k (phasing out to $0 by $150k); unused losses carry forward. On sale, claimed depreciation is recaptured at up to 25%, and gains may owe capital-gains tax (a 1031 exchange can defer both). Figures are a year-1 estimate at your 24.0% rate — not tax advice; consult a CPA.
Schools (NCES district)
- District
- Euclid City
- NCES district ID
- 3904395
- Math proficiency
- 14% ▼ -19.00%
- Reading proficiency
- 28% ▼ -14.00%
- Median HH income
- $36,385
- Composite
- 17.39/100
- National rank
- #9067
- State rank
- #625 of 656 in OH
Livability — Euclid
- Score
- 77/100
- State rank
- #204
- US rank
- #3149
Category grades
Schools grade is shown separately in the Schools card above.
Census & demographics
- Census place
- Euclid, OH
- County
- Cuyahoga County · 1,090,369 people
- City population
- 41,855
- Metro
- Cleveland-Elyria, OH
- Population (ZIP)
- 18,050
- Household income
- $55,676
- Rent vs Own
- Severe rent burden
- 1085.0
Population outlook (Cuyahoga County) Hauer SSP2
- Today (2025)
- 1,244,621 people
- By 2030
- 1,230,093 · -1.2%
- By 2040
- 1,189,108 · -4.5%
- By 2050
- 1,145,706 · -7.9%
- By 2075
- 1,076,557 · -13.5%
- By 2100
- 978,987 · -21.3%
Race, ethnicity, and origin ACS 2023
- Neighborhood character
- Majority Black (65%)
- Race & ethnicity
- Black 65% White 28% Two or more races 6% Hispanic / Latino 1%
- Common ancestry
- Romanian 5%
- Foreign-born
- 2% · Canada
- Languages at home
- 96% English-only · Spanish 2% Chinese 1%
Political lean MEDSL · Cuyahoga
- 2024 margin
- Solid D (+31.5) · D 65.4% · R 33.9%
- 2008→2024 swing
- -7.4pp toward R · 2008: 38.9pp · 2024: 31.5pp
- All cycles
- 2024: D+31.5 2020: D+34.1 2016: D+35.0 2012: D+38.7 2008: D+38.9
Not yet ingested
- Civics
- —
Market trends
- HPI YoY
- ▼ -62.82%
- Current HPI
- 188.4932
- Rent YoY
- ▲ 5.28%
- Metro
- Cleveland-Elyria, OH
- State GDP YoY
- ▲ 1.98%
- F500 in state
- 48
Industry mix (Fortune 500 HQ in OH)
| Industry | F500 HQs | Revenue |
|---|---|---|
| Insurance | 3 | $145B |
|
||
| Industrial Machinery | 3 | $49B |
|
||
| Financial Services | 3 | $24B |
|
||
| Consumer Goods | 2 | $93B |
|
||
| Aerospace / Defense | 2 | $47B |
|
||
| Utilities | 2 | $33B |
|
||
Price history
+196.2% since first listed8 events — show timeline
- 2026-06-14 Listed $239,900 MLSNOW
- 2001-06-13 Listing Removed — MLSNOW
- 2001-05-11 Sold (Public Records) $153,000 Public Records
- 2000-12-16 Listed $155,000 MLSNOW
- 1992-06-30 Sold (Public Records) $110,000 Public Records
- 1990-11-08 Sold (Public Records) $115,000 Public Records
- 1989-08-30 Sold (Public Records) $82,500 Public Records
- 1984-12-28 Sold (Public Records) $81,000 Public Records
Property tax history
+2.4%/yrLatest (2025): $4,897 · -3.0% YoY. Source: county tax records.
Cash-flow waterfall
monthlySold comps — $/sqft
last 12 mo · ≤1 miLoading sold comps…