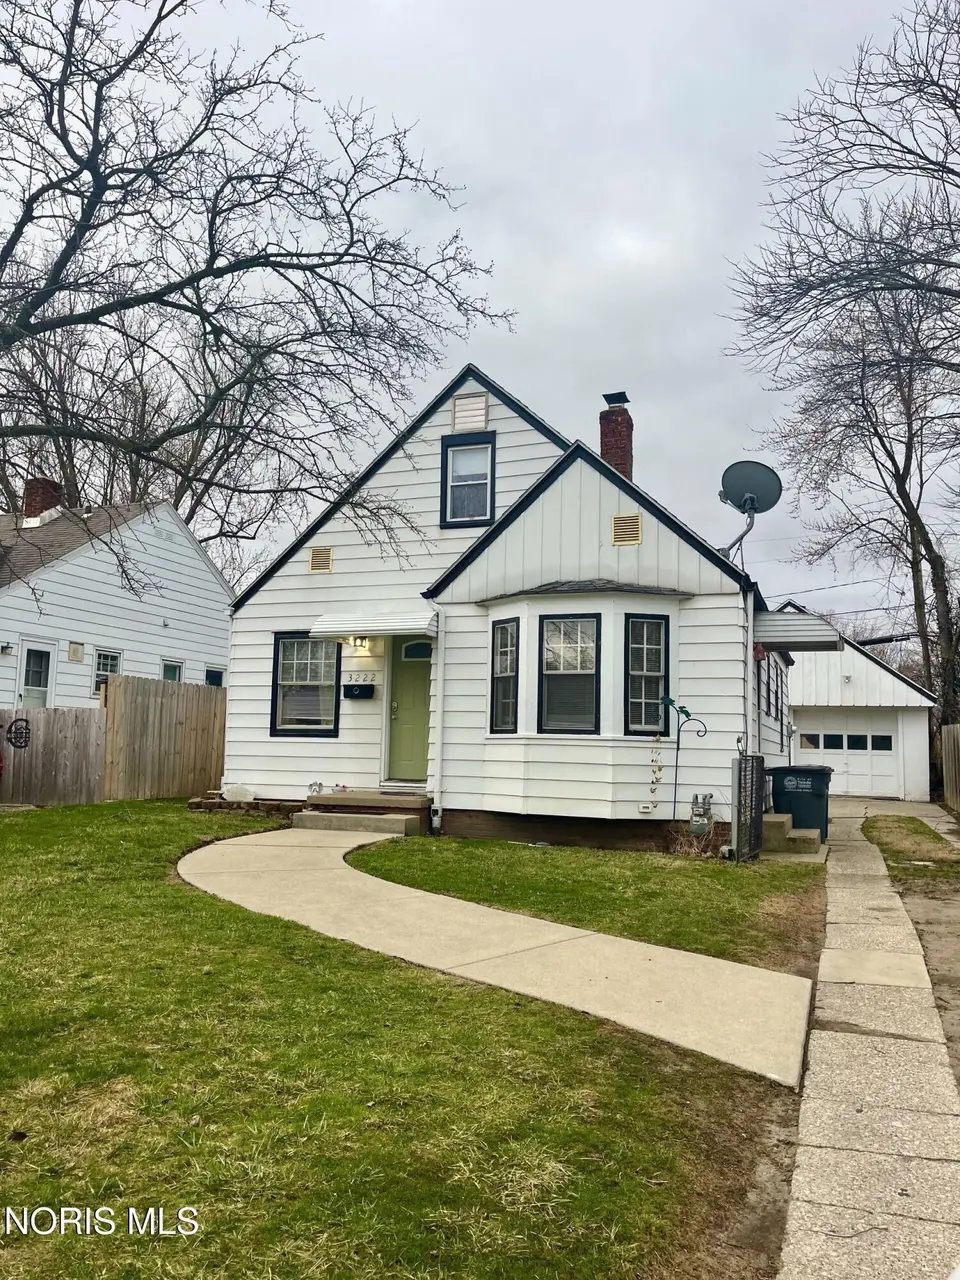
3222 Escott Ave · Toledo, OH
Flood risk 1/10 · Minimal
- FEMA flood zone
- X (unshaded)
- Chance of flooding over 30 yrs
- 0.0%
- Est. flood insurance / yr
- $473 – $860
Fire risk 1/10 · Minimal
- Est. fire insurance / yr
- $713 – $1,323
Heat risk 3/10 · Minor
- Hot days now (above 100°F)
- 7 days/yr
- Hot days in 30 yrs
- 16 days/yr
Wind risk 2/10 · Minimal
- Chance of severe wind over 30 yrs
- —
Air-quality risk 2/10 · Minimal
- Unhealthy air days now
- 1 days/yr
- Unhealthy air days in 30 yrs
- 2 days/yr
Risk factors via First Street. Map © Google.
Why this score? — see what drove the D+ grade
The composite is a weighted blend of 9 inputs, each scored 0–100. Each bar is that input's sub-score; the figure is the points it added to the 100-point composite (weight × sub-score).
- Cash flow +14.2/30.0
- ARV discount +11.5/15.0
- Rent growth +4.5/5.0
- DSCR +4.3/10.0
- 1% rule +3.8/10.0
- Livability +3.3/5.0
- Condition / age +2.5/5.0
- Schools +1.6/10.0
- Appreciation +0.0/10.0
$159,900
🖨 Deal sheet 📄 Offer letter ✓ Due diligence
Listing remarks MLS
Clean and well-maintained home with gorgeous hardwood floors! Second floor master offers large storage and skylights. Bathroom has a jacuzzi tub. Rec rooms adds additional living space. Glass block in basement provides natural light! 1-year home warranty offered!
Key facts
- 5,000 sq ft lot
- 2 garage spots
- Built 1947
Property features AI
Finance
- Other: Lot on a city street with asphalt road frontage; Lot size approximately 0.12 acre; Below-grade finished area present (finished basement space)
Exterior
- Parking: Detached garage; 2 parking spaces total; Driveway with ribbon concrete
- Utilities: Public water; Public sewer; 100 amp electric service; Natural gas available; Cable available; Internet available; Sewer connected; Water connected
- Home design: Single-family residence (house); One and one-half levels; No attached units or common walls
- Construction: Aluminum roof; Block foundation; Other construction materials; Public records used for year built
- Exterior features: Rear patio; Partial wood fencing
Interior
- Kitchen: Eat-in kitchen; Electric range; Refrigerator; Dishwasher not listed
- Bedrooms: Primary bedroom on main level with ceiling fan and wood flooring; Second bedroom on main level with wood flooring; Third bedroom on upper level with carpet
- Flooring: Wood flooring; Carpet; Vinyl
- Bathrooms: 1 full bathroom
- Heating & cooling: Forced air heating; Central air conditioning
- Interior features: Eat-in kitchen; Storage; Window coverings; Cove ceilings; Has basement; 6 total rooms
- Laundry & utility: Washer and dryer included; Laundry located in basement
Neighborhood map
What this means for you Summary
Snapshot
- This is a 3-bed/1.0-bath single-family listed at $160k.
Deal economics
- At list price, monthly cash flow is $25 ($305/yr) — positive.
- The deal already cash-flows at list — no discount required.
- To meet the 1% rule (rent ≥ 1% of price), the offer needs to be $140k (12.2% below list).
- Recommended offer: $140k (12.2% below list) — sets the bar for 1% rule.
Location & tenants
- Location reads 66/100 on livability (#645 in OH) — a middle-class / working-renter tenant base. Strengths: cost of living A+, housing A+, health & safety A+; Watch: amenities C-, crime F, commute F.
- Toledo City (urban): math 15% / reading 24% proficiency, ranked #634 of 656 in OH (top 97%) — low school quality limits family demand, transient renter base, plan for 1-2y turnover; 72% free/reduced lunch — lower-income household profile, screen leases tightly.
- Zoned schools: Beverly Elementary School (math 32% / reading 46%, grade F, #1,078 of 1,584 statewide, top 68%, 536 students, 48% FRL); Bowsher High School (math 23% / reading 45%, grade F, #596 of 781 statewide, top 76%, 1,240 students, 49% FRL) — zoned schools average 49% FRL vs 72% district-wide (23 pts lower); this property's tenant base skews higher-income than the district average.
- Zoned-school proficiency averages 36% at this address vs 20% district-wide (+17 pts) — the actual schools serving this property are materially stronger than the Toledo City average implies; a family-tenant draw the district grade alone would hide.
- Market conditions: Rents rising fast (+8.0%/yr); 71 active listings in the ZIP; 7 comparable units currently listed for rent nearby; rentals at typical pace (median 23d on market — plan ~3-4 weeks tenant-placement turnaround); 43% of comp listings sitting > 30 days — soft ceiling on asking rent; 415 units permitted in Lucas County in 2024 (122 in 5+ unit buildings).
Forward outlook
- Local home prices are declining (-3.0%/yr); year-one equity from $1k of loan paydown is wiped out by about $5k of value loss. Plan a longer hold.
- Lucas County population projected at -16% by 2050 — secular population decline; favor cash flow + early exit over multi-decade hold.
Negotiation context
- It's been on market 68 days — a 6% lower offer ($150k) is reasonable based on typical stale-listing flexibility.
- 4 sale attempts since 11y ago with the ask held roughly flat each time — persistent listings suggest the price (not the market) is what's stuck; bring a comps-based counter.
- Current owner paid $76k; list at $160k implies a 109% gain — meaningful room to come down on a strong offer.
Risks & watch-outs
- Watch-outs: built in 1947 — expect roof / HVAC / electrical / plumbing capex.
Questions for the listing agent
- It's been on market 68 days. Have you received any prior offers? Is the seller open to a 12% concession, seller financing, or rate buy-down credit?
- Built in 1947 — when were the roof, HVAC, electrical panel, plumbing, and water heater last replaced?
- Why hasn't it sold? Are there any deal-killer items the seller is aware of (foundation, flood, title, zoning, code violations)?
- Is there a deadline driving the sale (1031 exchange, divorce, estate, relocation)? That informs how much negotiation room exists.
- Schools are D-rated, which usually means shorter tenancies and higher turnover. Who's the typical renter profile here, and what's been the actual vacancy rate?
- Crime grade is F in this area — have there been break-ins, vandalism, or insurance claims at this property in the last 3 years? What carrier currently insures it and at what premium?
- The area grade is low — what's the realistic commute time and amenity access for the typical tenant pool here? Any planned neighborhood developments (good or bad) we should know about?
- What's the average days-on-market for RENTAL listings here right now (not sales)? A rising rental-DOM trend means longer vacancies and softer asking-rent achievability than the comps imply.
- What's the recent tenant-quality profile in this submarket — average credit score on applications, eviction rate, late-payment / NSF rate, and stable-employment percentage? A property-management company in the area should have these aggregated.
- How much new for-sale + rental construction is in the pipeline within 1–3 miles? Heavy new supply typically softens prices + rents 12–24 months out; constrained supply supports both.
Investment metrics
- 1% rule
- 0.88% ✗
- Cap rate
- 6.48%
- Cash-on-cash
- 0.68%
- DSCR
- 1.03
- GRM
- 9.5
CMA / ARV
- ARV (on-the-fly)
- $175,538
- Comps found
- 12
Show comp detail 12 sales within ~0.75 mi
| Address | Dist | Beds/Ba | Sqft | Sold | Price | $/sf | Match |
|---|---|---|---|---|---|---|---|
| 3222 Escott Ave | 0.00mi | 3/1.0 | 1,111 (0%) | 1mo | $159,000 | $143 | 99 |
| 3205 Penrose Ave | 0.09mi | 3/1.5 | 1,114 (+0%) | 6mo | $149,900 | $135 | 88 |
| 4347 S Detroit Ave | 0.28mi | 3/2.0 | 1,210 (+9%) | 2mo | $189,900 | $157 | 67 |
| 3121 Daleford Dr | 0.58mi | 3/1.5 | 1,076 (-3%) | 2mo | $153,500 | $143 | 64 |
| 715 Carew Ln | 0.66mi | 3/1.0 | 1,153 (+4%) | 1mo | $200,000 | $173 | 62 |
| 1377 Kirk St | 0.59mi | 3/1.0 | 1,148 (+3%) | 7mo | $181,000 | $158 | 61 |
| 3905 Chipplegate Rd | 0.55mi | 3/1.0 | 1,180 (+6%) | 4mo | $164,900 | $140 | 60 |
| 1135 Richland St | 0.51mi | 3/1.0 | 1,008 (-9%) | 7mo | $209,000 | $207 | 55 |
| 1216 Cady St | 0.54mi | 3/1.5 | 1,232 (+11%) | 1mo | $197,500 | $160 | 54 |
| 851 Lamonde Dr | 0.70mi | 3/1.0 | 1,206 (+9%) | 3mo | $185,000 | $153 | 50 |
| 2944 Daleford Dr | 0.69mi | 3/1.5 | 1,204 (+8%) | 3mo | $232,500 | $193 | 50 |
| 5022 Stengel Ave | 0.56mi | 3/1.0 | 960 (-14%) | 6mo | $166,500 | $173 | 46 |
Match score weights: distance 35% · size 25% · config 20% · recency 20%. Top-matched comps best support the ARV.
Projected returns pro-forma
-3.0% appreciation · 8.0% rent growth · sell at horizon
- IRR
- -9.8%
- Equity multiple
- 0.62×
- Total profit
- $-16,862
- Equity at exit
- $23,842
- IRR
- 5.3%
- Equity multiple
- 1.47×
- Total profit
- $21,212
- Equity at exit
- $13,825
Cash invested: $44,772 (down + closing). Projections, not guarantees.
Landlord ↔ Tenant lean methodology
- Overall (STATE)
- 73 Landlord-Friendly
- State Ohio
- 73 Landlord-Friendly · R+6
- County
- — inherits STATE
- City
- — inherits STATE
ZIP-level market 43614
- Home prices YoY
- -22.4%
- Rents YoY
- 8.0%
- Active inventory
- 71
- Price-to-rent
- 9.5×
Monthly cashflow live
- Estimated rent
- $1,404 high interval (Pro) →
- Mortgage (P&I)
- −$839
- Tax from tax record
- −$179 /mo · $2,145/yr
- Insurance
- −$67
- HOA
- −$0
- Vacancy / Maint / Mgmt
- −$295
- Net cashflow
- $25
Break-even live
UW: 25.0% down · 7.5% · 30yr · 1.5% tax · 5.0% vac · 8.0% maint · 8.0% mgmt
Financing live
Cash to close
- Down payment
- $39,975
- Closing costs
- $4,797
- Reserves months
- —
- Total cash needed
- —
Loan-product check · same deal, 3 products live
Conventional
25% down · 7.5% · 30yr
- Down + closing
- —
- Monthly P&I
- —
- Monthly cashflow
- —
- DSCR
- —
- Eligible?
- —
Personal DTI + credit; lowest rate.
DSCR
20% down · 8.5% · 30yr
- Down + closing
- —
- Monthly P&I
- —
- Monthly cashflow
- —
- DSCR
- —
- Eligible?
- —
No personal income docs; deal must DSCR.
Hard money
10% down · 12.0% · 12mo
- Down + closing
- —
- Monthly P&I
- —
- Monthly cashflow
- —
- DSCR
- —
- Eligible?
- —
Short-term bridge; refi at stabilization.
Rent comps 7 comps
| Address | Beds | Baths | Sqft | Rent | $/sqft | DOM | Units | Dist |
|---|---|---|---|---|---|---|---|---|
| 1027 Valley Side Dr Maumee, OH | 2.0 | 1.5 | 1260 | $1,495 | $1.19 | 23d | 1 | 0.23mi |
| 1010 Valley Side Dr Unit 1010 Maumee, OH | 2.0 | 1.5 | 1260 | $1,395 | $1.11 | 13d | 1 | 0.23mi |
| 3025 S Byrne Rd Unit 1 Toledo, OH | 3.0 | 1.0 | 1064 | $1,095 | $1.03 | 21d | 1 | 0.44mi |
| 1106 Hugo St Maumee, OH | 3.0 | 1.0 | 1006 | $1,595 | $1.59 | 43d | 1 | 0.64mi |
| 3165 Glanzman Rd Toledo, OH | 1.0–2.0 | 1.0 | 658 | $799 | $1.21 | 43d | 1 | 0.97mi |
| 2647 Eastgate Rd Toledo, OH | 1.0–2.0 | 1.0 | 722 | $1,209 | $1.67 | 23d | 1 | 1.21mi |
| 3042 Cragmoor Ave Toledo, OH | 3.0 | 1.0 | 1250 | $1,800 | $1.44 | 43d | 1 | 1.40mi |
Listing history 16 events
-
2026-04-30historical Contingent
-
2026-04-23status Active
-
2026-04-13historical Contingent
-
2026-03-21$159,900 Active
-
2026-03-16historical $159,900
-
2025-10-14price $76,500 265-char remark
Show marketing remark (265 chars)
Clean and well-maintained home with gorgeous hardwood floors! Second floor master offers large storage and skylights. Bathroom has a jacuzzi tub. Rec rooms adds additional living space. Glass block in basement provides natural light! 1-year home warranty offered!
-
2016-06-24soldstatus $76,500
-
2016-06-23soldstatus $76,500 265-char remark
Show marketing remark (265 chars)
Clean and well-maintained home with gorgeous hardwood floors! Second floor master offers large storage and skylights. Bathroom has a jacuzzi tub. Rec rooms adds additional living space. Glass block in basement provides natural light! 1-year home warranty offered!
-
2016-06-10price $79,900 265-char remark
Show marketing remark (265 chars)
Clean and well-maintained home with gorgeous hardwood floors! Second floor master offers large storage and skylights. Bathroom has a jacuzzi tub. Rec rooms adds additional living space. Glass block in basement provides natural light! 1-year home warranty offered!
-
2016-03-24$79,900 265-char remark
Show marketing remark (265 chars)
Clean and well-maintained home with gorgeous hardwood floors! Second floor master offers large storage and skylights. Bathroom has a jacuzzi tub. Rec rooms adds additional living space. Glass block in basement provides natural light! 1-year home warranty offered!
-
2016-01-28historical
-
2015-06-05$79,900
-
2000-01-03soldstatus $75,000
-
1991-10-25soldstatus $61,500
-
1987-06-01soldstatus $45,000
-
1978-06-07soldstatus $37,000
ⓘ Source: listings_history table (triggers on properties + properties_extension) + one-shot
backfill from property_details.listing_events for pre-trigger history.
Tax reassessment forecast OH · Partial reset (capped growth)
- Current annual tax
- $2,145 · $179/mo
- Projected year-2 tax
- $2,320 · $193/mo
- Expected delta
- +$175/yr (+$15/mo · 8.1%)
ⓘ Screening estimate from a state-policy table — verify with the county assessor before closing.
Climate risk First Street
- Flood 1/10 Low FEMA zone X (unshaded) · 0% chance over 30 yrs
- Wildfire 1/10 Low
- Heat 3/10 Moderate 7 d/yr ≥100°F today · 16 d/yr by 30 yrs out
- Wind 2/10 Low
- Air quality 2/10 Low 1 unhealthy d/yr today · 2 by 30 yrs out
Nearby sold comps map
Loading sold comps map…
Walkable amenities ~0.75 mi
Loading nearby amenities…
Taxation est. · year 1
- Rental income
- $16,851
- − Mortgage interest
- −$8,957
- − Property taxes
- −$2,145
- − Insurance
- −$800
- − Repairs & maintenance
- −$1,348
- − Management
- −$1,348
- − Depreciation
- −$4,652
- Taxable loss
- −$2,398
- Est. tax savings @ 24.0%
- +$576
- After-tax cash flow
- $881/yr
For passive investors: Depreciation is non-cash, so a rental often shows a tax loss while cash-flowing — sheltering income. Rental losses are passive: they offset passive income freely, and up to $25,000/yr can offset ordinary (W-2) income if you actively participate and your MAGI is under $100k (phasing out to $0 by $150k); unused losses carry forward. On sale, claimed depreciation is recaptured at up to 25%, and gains may owe capital-gains tax (a 1031 exchange can defer both). Figures are a year-1 estimate at your 24.0% rate — not tax advice; consult a CPA.
Schools (NCES district)
- District
- Toledo City
- NCES district ID
- 3904490
- Math proficiency
- 15% ▼ -16.00%
- Reading proficiency
- 24% ▼ -13.00%
- Median HH income
- $32,137
- Composite
- 15.76/100
- National rank
- #9276
- State rank
- #634 of 656 in OH
Livability — Toledo
- Score
- 66/100
- State rank
- #645
- US rank
- #11442
Category grades
Schools grade is shown separately in the Schools card above.
Census & demographics
- Census place
- Toledo, OH
- County
- Lucas County · 380,724 people
- City population
- 280,811
- Metro
- Toledo, OH
- Population (ZIP)
- 29,075
- Household income
- $58,961
- Rent vs Own
- Severe rent burden
- 1407.0
Population outlook (Lucas County) Hauer SSP2
- Today (2025)
- 420,751 people
- By 2030
- 410,187 · -2.5%
- By 2040
- 384,019 · -8.7%
- By 2050
- 355,125 · -15.6%
- By 2075
- 291,683 · -30.7%
- By 2100
- 233,670 · -44.5%
Race, ethnicity, and origin ACS 2023
- Neighborhood character
- Predominantly White (67%)
- Race & ethnicity
- White 67% Black 21% Hispanic / Latino 7% Two or more races 4% Asian 2%
- Hispanic origin (detail)
- Mexican 6% Puerto Rican 1%
- Common ancestry
- Romanian 8% Italian 5% Lithuanian 3%
- Foreign-born
- 3% · Canada
- Languages at home
- 96% English-only · Other Indo-European 1% Spanish 1%
Political lean MEDSL · Lucas
- 2024 margin
- D (+12.6) · D 55.8% · R 43.2%
- 2008→2024 swing
- -18.9pp toward R · 2008: 31.4pp · 2024: 12.6pp
- All cycles
- 2024: D+12.6 2020: D+16.8 2016: D+17.4 2012: D+30.4 2008: D+31.4
Not yet ingested
- Civics
- —
Market trends
- HPI YoY
- ▼ -61.96%
- Current HPI
- 214.7031
- Rent YoY
- ▲ 8.03%
- Metro
- Toledo, OH
- State GDP YoY
- ▲ 1.98%
- F500 in state
- 48
Industry mix (Fortune 500 HQ in OH)
| Industry | F500 HQs | Revenue |
|---|---|---|
| Insurance | 3 | $145B |
|
||
| Industrial Machinery | 3 | $49B |
|
||
| Financial Services | 3 | $24B |
|
||
| Consumer Goods | 2 | $93B |
|
||
| Aerospace / Defense | 2 | $47B |
|
||
| Utilities | 2 | $33B |
|
||
Price history
+332.2% since first listed16 events — show timeline
- 2026-04-30 Contingent — NORIS
- 2026-04-23 Relisted — NORIS
- 2026-04-13 Contingent — NORIS
- 2026-03-21 Listed $159,900 NORIS
- 2026-03-16 Coming Soon $159,900 NORIS
- 2025-10-14 Price Changed $76,500 NORIS
- 2016-06-24 Sold (Public Records) $76,500 Public Records
- 2016-06-23 Sold (MLS) $76,500 NORIS
- 2016-06-10 Price Changed $79,900 NORIS
- 2016-03-24 Listed $79,900 NORIS
- 2016-01-28 Listing Removed — NORIS
- 2015-06-05 Listed $79,900 NORIS
- 2000-01-03 Sold (Public Records) $75,000 Public Records
- 1991-10-25 Sold (Public Records) $61,500 Public Records
- 1987-06-01 Sold (Public Records) $45,000 Public Records
- 1978-06-07 Sold (Public Records) $37,000 Public Records
Property tax history
+1.8%/yrLatest (2025): $2,145 · -0.0% YoY. Source: county tax records.
Cash-flow waterfall
monthlySold comps — $/sqft
last 12 mo · ≤1 miLoading sold comps…