 Fourplex
800 N Kentucky St · Alton, TX
Flood risk 6/10 · Moderate
- FEMA flood zone
- A
- Chance of flooding over 30 yrs
- 0.75%
- Est. flood insurance / yr
- $1,009 – $1,996
Fire risk 6/10 · Moderate
- Est. fire insurance / yr
- $1,222 – $2,270
Heat risk 9/10 · Severe
- Hot days now (above 112°F)
- 7 days/yr
- Hot days in 30 yrs
- 22 days/yr
Wind risk 8/10 · Major
- Chance of severe wind over 30 yrs
- 99.0%
Air-quality risk 2/10 · Minimal
- Unhealthy air days now
- 0 days/yr
- Unhealthy air days in 30 yrs
- 1 days/yr
Risk factors via First Street. Map © Google.
Why this score? — see what drove the C- grade
The composite is a weighted blend of 9 inputs, each scored 0–100. Each bar is that input's sub-score; the figure is the points it added to the 100-point composite (weight × sub-score).
- Cash flow +14.8/30.0
- Appreciation +10.0/10.0
- ARV discount +8.3/15.0
- DSCR +4.5/10.0
- 1% rule +4.2/10.0
- Condition / age +4.0/5.0
- Rent growth +3.1/5.0
- Livability +2.9/5.0
- Schools +1.7/10.0
$480,000
🖨 Deal sheet (PDF) 📄 Offer letter ✓ Due diligence
Multi-family units
County records classify this as Multi-Family (2-4 Unit). Listing-text estimate: 4 units. confirmed
Listing remarks MLS
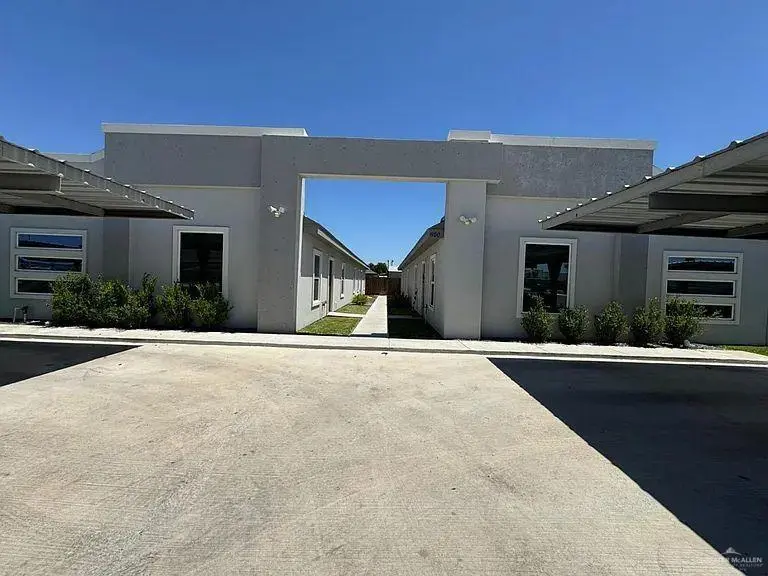
Upcoming Investment Property located in the New Sunset Subdivision Phase 2 located in the growing City of Alton! This is a New Construction, Fourplex (3Bed/2bath and 2bed/2bath) which will include new appliances, granite countertops, tile flooring, ceiling fans, wooden fence and 9 covered parking in total.
Key facts
- Near schools
- One vacant unit
- Near dining
Tags
Property features AI
Finance
- Other: Lot size approximately 0.2566 acres
- HOA & community: Association: Sunset Valley Apartments Association; Association fee $550 annually; POA mandatory with $250 transfer fee; Community features: sidewalks; Number of units in community: 4
Exterior
- Parking: 8 total parking spaces; 8 covered spaces; 8 carport spaces; Attached parking
- Security: Motorized gate; Smoke detector(s)
- Utilities: Public water; 5 separate water meters
- Home design: Sunset Valley Apartments community; Outbuilding: none
- Construction: Stucco construction; Shingle roof; Slab foundation
- Exterior features: Motorized gate; Sprinkler system; Curb and gutters; Sidewalks; Paved road
Interior
- Kitchen: Smooth electric cooktop; Microwave; Refrigerator
- Flooring: Tile
- Heating & cooling: Central heating (electric); Central cooling (electric); Has heating; Has cooling
- Interior features: Dryer; Microwave; Split bedrooms; Washer; Smoke detector(s)
- Laundry & utility: Laundry closet; Laundry room; Electric water heater; Washer; Dryer
Neighborhood map
What this means for you Summary
Snapshot
- This is a 2×3bd/2.0ba + 2×2bd/2.0ba units multifamily listed at $480k. Condition is rated good.
Deal economics
- At list price, monthly cash flow is $11 ($126/yr) — positive. Per door: $3/mo.
- The deal already cash-flows at list — no discount required.
- To meet the 1% rule (rent ≥ 1% of price), the offer needs to be $443k (7.7% below list).
- Recommended offer: $443k (7.7% below list) — sets the bar for 1% rule.
- Cap rate 6.6% vs local median 2.5% in Alton — top-decile yield for the area; either an underpriced asset or a hidden risk that comps aren't pricing in. Stress-test before assuming the spread holds.
Location & tenants
- Location reads 58/100 on livability (#1,230 in TX) — a working-class tenant base; expect higher turnover. Strengths: cost of living A+, housing A; Watch: crime F, amenities F, commute F.
- Mission CISD (urban): math 15% / reading 28% proficiency, ranked #775 of 826 in TX (top 94%) — low school quality limits family demand, transient renter base, plan for 1-2y turnover; 78% free/reduced lunch — lower-income household profile, screen leases tightly.
- Zoned schools: Cantu El (math 22% / reading 32%, grade F, #2,791 of 4,322 statewide, top 68%, 417 students, 94% FRL); Alton Memorial J H (math 10% / reading 21%, grade F, #1,556 of 1,662 statewide, top 94%, 819 students, 91% FRL); Mission H S (math 18% / reading 28%, grade F, #1,348 of 1,632 statewide, top 83%, 2,218 students, 91% FRL).
- Market conditions: Rents rising (+2.5%/yr); 625 active listings in the ZIP; 10 comparable units currently listed for rent nearby; rentals at typical pace (median 26d on market — plan ~3-4 weeks tenant-placement turnaround); 40% of comp listings sitting > 30 days — soft ceiling on asking rent; 7,378 units permitted in Hidalgo County in 2024 (641 in 5+ unit buildings).
Forward outlook
- In year one you build about $51k of equity ($3k loan paydown + $48k appreciation (10.0% local appreciation)).
- Hidalgo County population projected at +28% by 2050 — long-run rental-demand tailwind backs the buy-and-hold thesis.
- At projected returns (10.0% appreciation + 2.5% rent growth), your $134k cash investment doubles in ~3 years — after that, you're playing with house money.
- By year 2, paydown + projected appreciation supports a ~$82k cash-out refi (75% LTV) — recoverable capital for the next deal without selling this one.
Negotiation context
- Only 13 days on market — expect competitive offers; lowballing is unlikely to land.
- 3 sale attempts since 4y ago with the ask held roughly flat each time — persistent listings suggest the price (not the market) is what's stuck; bring a comps-based counter.
Risks & watch-outs
- Watch-outs: flood insurance adds $125/mo.
- Climate carrying-cost: in FEMA flood zone A (mandatory federal flood insurance); severe wind risk, 99% chance of damaging wind over 30y; major wildfire risk; extreme-heat days projected 7→22/yr by 2055 (HVAC capex compounding) — expect insurance premiums to compound above CPI over the hold.
Questions for the listing agent
- Can we see the unit-by-unit rent roll, current vacancy, and any below-market leases? What's the average tenancy length?
- What capital expenditures (roof, boiler, parking lot, exteriors) have been made in the last 5 years, and what's planned in the next 2?
- What's the actual annual flood-insurance premium (NFIP or private), and is the property in a SFHA with mandatory coverage?
- What does the HOA fee cover, when was the last increase, and are there any pending special assessments or reserve-fund shortfalls?
- Is there a deadline driving the sale (1031 exchange, divorce, estate, relocation)? That informs how much negotiation room exists.
- Schools are F-rated, which usually means shorter tenancies and higher turnover. Who's the typical renter profile here, and what's been the actual vacancy rate?
- Crime grade is F in this area — have there been break-ins, vandalism, or insurance claims at this property in the last 3 years? What carrier currently insures it and at what premium?
- What's the average days-on-market for RENTAL listings here right now (not sales)? A rising rental-DOM trend means longer vacancies and softer asking-rent achievability than the comps imply.
- What's the recent tenant-quality profile in this submarket — average credit score on applications, eviction rate, late-payment / NSF rate, and stable-employment percentage? A property-management company in the area should have these aggregated.
- How much new apartment / multifamily construction is in the pipeline within 1–3 miles? Heavy new supply (>2% of stock underway) typically softens rents 12–24 months out; light construction supports rent growth.
Investment metrics
- 1% rule
- 0.92% ✗
- Cap rate
- 6.63%
- Cash-on-cash
- 1.21%
- DSCR
- 1.05
- GRM
- 9.0
CMA / ARV
- ARV (on-the-fly)
- $489,090
- Comps found
- 12
Show comp detail 12 sales within ~0.75 mi
| Address | Dist | Beds/Ba | Sqft | Sold | Price | $/sf | Match |
|---|---|---|---|---|---|---|---|
| 311 W Campeche Ave | 0.37mi | —/— | 4,180 (+2%) | 3mo | $469,000 | $112 | 78 |
| 220 W Campeche Ave | 0.40mi | —/— | 4,110 (0%) | 6mo | $490,000 | $119 | 76 |
| 320 W Campeche Ave | 0.18mi | —/— | 4,100 (-0%) | 22mo | $500,000 | $122 | 73 |
| 908 Kentucky St | 0.37mi | —/— | 4,032 (-2%) | 10mo | $480,000 | $119 | 71 |
| 913 W Kohala Ave | 0.30mi | —/— | 4,354 (+6%) | 12mo | $480,000 | $110 | 67 |
| 808 W Sunset Valley St | 0.44mi | —/— | 4,032 (-2%) | 14mo | $475,000 | $118 | 64 |
| 804 W Sunset Valley St | 0.44mi | —/— | 4,032 (-2%) | 14mo | $475,000 | $118 | 64 |
| 1000 Kohala Ave | 0.29mi | —/— | 3,540 (-14%) | 2mo | $390,000 | $110 | 62 |
| 120 W Diamond Ave | 0.54mi | —/— | 4,200 (+2%) | 17mo | $520,000 | $124 | 57 |
| 913 W Mahala Ave | 0.30mi | —/— | 3,600 (-12%) | 15mo | $495,000 | $138 | 53 |
| 1005 W Mahala Ave | 0.31mi | —/— | 3,644 (-11%) | 20mo | $485,000 | $133 | 50 |
| 904 Mahala Ave | 0.30mi | —/— | 3,636 (-12%) | 22mo | $479,500 | $132 | 48 |
Match score weights: distance 35% · size 25% · config 20% · recency 20%. Top-matched comps best support the ARV.
Projected returns pro-forma
10.0% appreciation · 2.45% rent growth · sell at horizon
- IRR
- 24.2%
- Equity multiple
- 2.93×
- Total profit
- $259,826
- Equity at exit
- $432,422
- IRR
- 21.3%
- Equity multiple
- 6.66×
- Total profit
- $760,122
- Equity at exit
- $932,534
Cash invested: $134,400 (down + closing). Projections, not guarantees.
Landlord ↔ Tenant lean methodology
- Overall (STATE)
- 87 Strongly Landlord-Friendly
- State Texas
- 87 Strongly Landlord-Friendly · R+5
- County
- — inherits STATE
- City
- — inherits STATE
ZIP-level market 78573
- Home prices YoY
- 8.0%
- Rents YoY
- 2.5%
- Active inventory
- 625
- Price-to-rent
- 35.2×
Monthly cashflow live
- Estimated rent
- $4,429 high interval (Pro) →
- Mortgage (P&I)
- −$2,517
- Tax est. 1.5%
- −$600 /mo · $7,200/yr
- Insurance
- −$200
- Flood insurance flood zone
- −$125 /mo · $1,502/yr
- HOA
- −$46
- Vacancy / Maint / Mgmt
- −$930
- Net cashflow
- $11
Break-even live
Sensitivity live
| Price | -10% $342 | -5% $176 | +0% $11 | +5% $-155 | +10% $-321 |
|---|---|---|---|---|---|
| Rent | -10% $-339 | -5% $-164 | +0% $11 | +5% $185 | +10% $360 |
| Rate | -1.0pp $252 | -0.5pp $133 | base $11 | +0.5pp $-114 | +1.0pp $-240 |
4-unit breakdown (identical units grouped — click to expand)
| Units | Beds | Baths | Est. rent |
|---|---|---|---|
| 2× units | 3 | 2 | $2,274 |
| #1 | 3 | 2 | $1,137 |
| #2 | 3 | 2 | $1,137 |
| 2× units | 2 | 2 | $2,154 |
| #3 | 2 | 2 | $1,077 |
| #4 | 2 | 2 | $1,077 |
| Total (4 units) | $4,429 | ||
UW: 25.0% down · 7.5% · 30yr · 1.5% tax · 5.0% vac · 8.0% maint · 8.0% mgmt
Financing live
Cash to close
- Down payment
- $120,000
- Closing costs
- $14,400
- Reserves months
- —
- Total cash needed
- —
Loan-product check · same deal, 3 products live
Conventional
25% down · 7.5% · 30yr
- Down + closing
- —
- Monthly P&I
- —
- Monthly cashflow
- —
- DSCR
- —
- Eligible?
- —
Personal DTI + credit; lowest rate.
DSCR
20% down · 8.5% · 30yr
- Down + closing
- —
- Monthly P&I
- —
- Monthly cashflow
- —
- DSCR
- —
- Eligible?
- —
No personal income docs; deal must DSCR.
Hard money
10% down · 12.0% · 12mo
- Down + closing
- —
- Monthly P&I
- —
- Monthly cashflow
- —
- DSCR
- —
- Eligible?
- —
Short-term bridge; refi at stabilization.
Rent comps 10 comps
| Address | Beds | Baths | Sqft | Rent | $/sqft | DOM | Units | Dist |
|---|---|---|---|---|---|---|---|---|
| 312 W Campeche Ave Unit 3 Alton, TX | 2.0 | 2.0 | 4050 | $1,000 | $0.25 | 25d | 1 | 0.18mi |
| 913 W Kohala Ave #3 Mission, TX | 2.0 | 2.0 | 4354 | $975 | $0.22 | 16d | 1 | 0.22mi |
| 1008 W Kohala Ave Unit 4 Alton, TX | 2.0 | 2.0 | 3596 | $1,100 | $0.31 | 25d | 1 | 0.28mi |
| 812 N Kentucky St Unit 2 Alton, TX | 3.0 | 2.0 | 4032 | $1,050 | $0.26 | 45d | 1 | 0.30mi |
| 810 N Missouri St Unit 2 Alton, TX | 2.0 | 2.0 | 3960 | $950 | $0.24 | 45d | 1 | 0.38mi |
| 1101 W Sunset Valley St Unit 3 Alton, TX | 2.0 | 2.0 | 4032 | $1,000 | $0.25 | 25d | 1 | 0.41mi |
| 116 W Campeche Ave Mission, TX | 2.0 | 2.0 | 4050 | $1,100 | $0.27 | 25d | 1 | 0.49mi |
| 312 E Campeche St Unit 4 Alton, TX | 3.0 | 2.0 | 4050 | $1,165 | $0.29 | 45d | 1 | 0.73mi |
| 825 S Michigan St Mission, TX | 2.0 | 1.5 | 4144 | $685 | $0.17 | 25d | 1 | 0.80mi |
| 1404 W Harrison Ave Unit 3 Alton, TX | 3.0 | 2.0 | 4320 | $1,100 | $0.25 | 45d | 1 | 0.87mi |
HOA detail
- Monthly dues
- $46 · $552/yr
Listing history 9 events
-
2026-06-21days on market $480,000 Active 13 DOM
-
2026-06-18days on market $480,000 Active 10 DOM
-
2026-06-17days on market $480,000 Active 9 DOM
-
2026-06-16days on market $480,000 Active 8 DOM
-
2026-06-15days on market $480,000 Active 7 DOM
-
2026-06-14days on market $480,000 Active 5 DOM
-
2026-06-10days on market $480,000 Active 2 DOM
-
2026-06-09remarks 699-char remark
-
2026-06-09$480,000 Active 1 DOM
ⓘ Source: listings_history table (triggers on properties + properties_extension) + one-shot
backfill from property_details.listing_events for pre-trigger history.
Climate risk First Street
- Flood 6/10 Major FEMA zone A · 75% chance over 30 yrs
- Wildfire 6/10 Major
- Heat 9/10 Extreme 7 d/yr ≥112°F today · 22 d/yr by 30 yrs out
- Wind 8/10 Severe 99% chance of damaging wind over 30 yrs
- Air quality 2/10 Low 0 unhealthy d/yr today · 1 by 30 yrs out
Nearby sold comps map
Loading sold comps map…
Walkable amenities ~0.75 mi
Loading nearby amenities…
Taxation est. · year 1
- Rental income
- $53,148
- − Mortgage interest
- −$26,887
- − Property taxes
- −$7,200
- − Insurance
- −$3,902
- − Repairs & maintenance
- −$4,252
- − Management
- −$4,252
- − HOA
- −$552
- − Depreciation
- −$13,964
- Taxable loss
- −$7,861
- Est. tax savings @ 24.0%
- +$1,887
- After-tax cash flow
- $2,013/yr
For passive investors: Depreciation is non-cash, so a rental often shows a tax loss while cash-flowing — sheltering income. Rental losses are passive: they offset passive income freely, and up to $25,000/yr can offset ordinary (W-2) income if you actively participate and your MAGI is under $100k (phasing out to $0 by $150k); unused losses carry forward. On sale, claimed depreciation is recaptured at up to 25%, and gains may owe capital-gains tax (a 1031 exchange can defer both). Figures are a year-1 estimate at your 24.0% rate — not tax advice; consult a CPA.
Condition & rehab AI · 10 photos
This fourplex is in good condition with modern finishes and a good location. It's ready for immediate rental income and has potential for further improvements.
Value-add opportunities
- Both Landscaping — Enhances curb appeal and property value
- Both Painting — Fresh paint can make the property more appealing
- Both Window treatments — Improves energy efficiency and aesthetics
Renovation cost estimate screening
Value-add ROI direction
- Both Landscaping — Enhances curb appeal and property value ↑
- Both Painting — Fresh paint can make the property more appealing ↑
- Both Window treatments — Improves energy efficiency and aesthetics ↑
ⓘ Cost ranges are severity-bucket heuristics (US national rule-of-thumb). Get contractor quotes + a written scope before underwriting a rehab budget.
Schools (NCES district)
- District
- Mission CISD
- NCES district ID
- 4831040
- Math proficiency
- 15% ▼ -35.00%
- Reading proficiency
- 28% ▼ -15.00%
- Median HH income
- $32,855
- Composite
- 17.47/100
- National rank
- #9061
- State rank
- #775 of 826 in TX
Livability — Alton
- Score
- 58/100
- State rank
- #1230
- US rank
- #21479
Category grades
Schools grade is shown separately in the Schools card above.
Census & demographics
- Census place
- Alton, TX
- County
- Hidalgo County · 623,128 people
- City population
- 44,809
- Metro
- McAllen-Edinburg-Mission, TX
- Population (ZIP)
- 44,809
- Household income
- $55,000
- Rent vs Own
- Severe rent burden
- 855.0
Population outlook (Hidalgo County) Hauer SSP2
- Today (2025)
- 955,232 people
- By 2030
- 1,009,774 · +5.7%
- By 2040
- 1,120,332 · +17.3%
- By 2050
- 1,225,036 · +28.2%
- By 2075
- 1,439,189 · +50.7%
- By 2100
- 1,533,429 · +60.5%
Race, ethnicity, and origin ACS 2023
- Neighborhood character
- Predominantly Hispanic (96%)
- Race & ethnicity
- Hispanic / Latino 96% Two or more races 63% White 3%
- Hispanic origin (detail)
- Mexican 94%
- Foreign-born
- 28% · Canada
- Languages at home
- 12% English-only · Spanish 88%
Political lean MEDSL · Hidalgo
- 2024 margin
- Toss-up / Even · D 48.1% · R 51.0%
- 2008→2024 swing
- -41.6pp toward R · 2008: 38.7pp · 2024: -2.9pp
- All cycles
- 2024: R+2.9 2020: D+17.1 2016: D+40.5 2012: D+41.8 2008: D+38.7
Not yet ingested
- Civics
- —
Market trends
- HPI YoY
- ▲ 17.95%
- Current HPI
- 242.0711
- Rent YoY
- ▲ 2.45%
- Metro
- McAllen-Edinburg-Mission, TX
- State GDP YoY
- ▲ 3.95%
- F500 in state
- 110
Industry mix (Fortune 500 HQ in TX)
| Industry | F500 HQs | Revenue |
|---|---|---|
| Energy | 16 | $1,198B |
|
||
| Technology | 5 | $198B |
|
||
| Engineering / Construction | 4 | $72B |
|
||
| Energy Services | 3 | $60B |
|
||
| Utilities | 3 | $41B |
|
||
| Healthcare | 2 | $330B |
|
||
Price history
-5.1% since first listed8 events — show timeline
- 2026-06-08 Listed $480,000 MCALLENMLS
- 2024-09-25 Rental Removed $1,250 RENTALBEAST
- 2024-09-05 Listed for Rent $1,250 RENTALBEAST
- 2023-03-03 Sold (MLS) — MCALLENMLS
- 2023-02-16 Pending — MCALLENMLS
- 2022-11-30 Price Changed $506,000 MCALLENMLS
- 2022-11-28 Price Changed $495,000 MCALLENMLS
- 2022-10-15 Listed $506,000 MCALLENMLS
Cash-flow waterfall
monthlySold comps — $/sqft
last 12 mo · ≤1 miLoading sold comps…