 Duplex
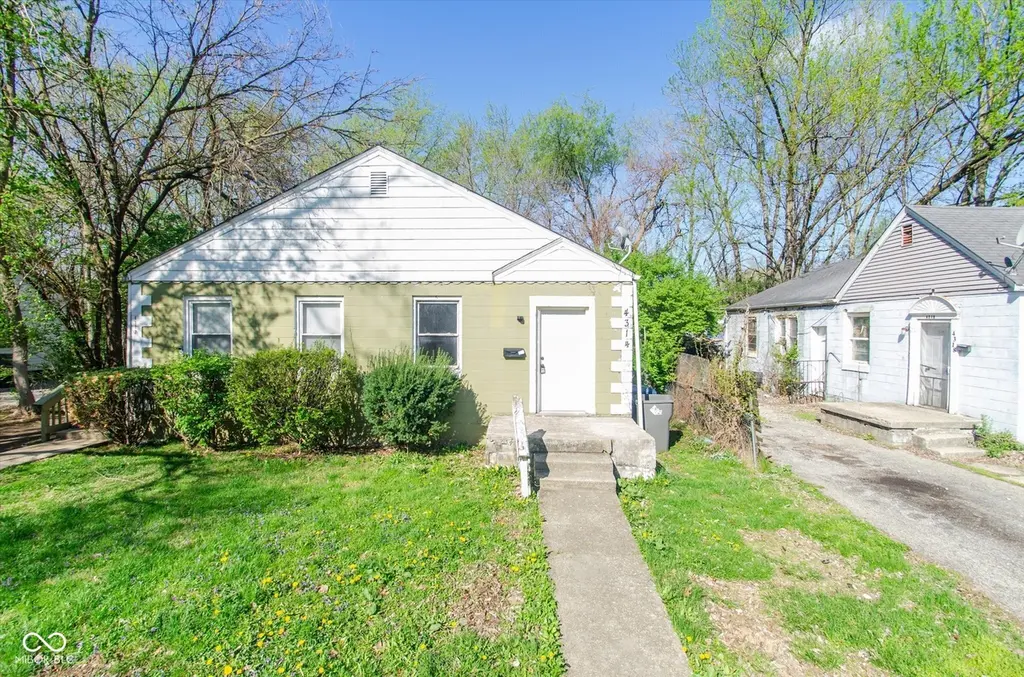
4312 Norwaldo Ave · Indianapolis city (balance), IN
Flood risk 1/10 · Minimal
- FEMA flood zone
- X (unshaded)
- Chance of flooding over 30 yrs
- 0.0%
- Est. flood insurance / yr
- $473 – $860
Fire risk 1/10 · Minimal
- Est. fire insurance / yr
- $717 – $1,331
Heat risk 3/10 · Minor
- Hot days now (above 102°F)
- 7 days/yr
- Hot days in 30 yrs
- 18 days/yr
Wind risk 2/10 · Minimal
- Chance of severe wind over 30 yrs
- 1.0%
Air-quality risk 4/10 · Minor
- Unhealthy air days now
- 5 days/yr
- Unhealthy air days in 30 yrs
- 7 days/yr
Risk factors via First Street. Map © Google.
Why this score? — see what drove the C+ grade
The composite is a weighted blend of 9 inputs, each scored 0–100. Each bar is that input's sub-score; the figure is the points it added to the 100-point composite (weight × sub-score).
- Cash flow +30.0/30.0
- DSCR +10.0/10.0
- 1% rule +9.6/10.0
- Rent growth +4.1/5.0
- Livability +2.5/5.0
- Condition / age +2.5/5.0
- Schools +1.4/10.0
- ARV discount +0.0/15.0
- Appreciation +0.0/10.0
$175,000
🖨 Deal sheet 📄 Offer letter ✓ Due diligence
Multi-family units
County records classify this as Multi-Family (2-4 Unit). Listing-text estimate: 2 units. confirmed
Listing remarks MLS
Opportunity knocks at 4312-4314 Norwaldo Ave! This duplex is perfectly positioned just steps from the Indiana State Fairgrounds, one of Indianapolis' most active event hubs, bringing year-round traffic from the Indiana State Fair, concerts, festivals, and exhibitions. The location alone makes this property a standout for investors looking to capitalize on strong rental demand and future appreciation. Each unit features 2 bedrooms and 1 bathroom, with basement laundry offering added convenience for tenants. While the property could use some TLC, it presents a fantastic value-add opportunity for those looking to renovate, increase rents, and build equity quickly. Whether you're considering a full renovation, light cosmetic updates, or a long-term hold strategy, the upside here is clear. A great addition to any portfolio. Don't miss your chance to turn potential into profit in one of Indianapolis' most active and accessible locations!
Key facts
- Strong rental demand
- Basement laundry
- 7,840 sq ft lot
Tags
Neighborhood map
What this means for you Summary
Snapshot
- This is a 2 × 2-bed/1.0-bath units multifamily listed at $175k.
Deal economics
- At list price, monthly cash flow is $701 ($8k/yr) — positive. Per door: $350/mo.
- The deal already cash-flows at list — no discount required.
- Meets the 1% rule at list price ($3k rent vs $175k).
- Recommended offer: $170k (3.0% below list) — sets the bar for market timing.
- Cap rate 11.1% vs local median 4.4% in Indianapolis city (balance) — top-decile yield for the area; either an underpriced asset or a hidden risk that comps aren't pricing in. Stress-test before assuming the spread holds.
Location & tenants
- Location reads: area grade C — affects rentability + tenant quality, not the cash-flow math above.
- Indianapolis Public Schools (urban): math 14% / reading 20% proficiency, ranked #286 of 301 in IN (top 95%) — low school quality limits family demand, transient renter base, plan for 1-2y turnover; 77% free/reduced lunch — lower-income household profile, screen leases tightly.
- Market conditions: Rents rising fast (+6.2%/yr); 314 active listings in the ZIP; 32 comparable units currently listed for rent nearby; rentals at typical pace (median 16d on market — plan ~3-4 weeks tenant-placement turnaround); 1,906 units permitted in Marion County in 2024 (621 in 5+ unit buildings).
- This rent runs 42% of the median local income ($72k/yr) — at the standard rent-burdened threshold; future hikes will face affordability resistance.
Forward outlook
- Local home prices are declining (-3.0%/yr); year-one equity from $1k of loan paydown is wiped out by about $5k of value loss. Plan a longer hold.
- Marion County population projected at +18% by 2050 — long-run rental-demand tailwind backs the buy-and-hold thesis.
- At projected returns (-3.0% appreciation + 6.2% rent growth), your $49k cash investment doubles in ~6 years — after that, you're playing with house money.
Negotiation context
- It's been on market 59 days — a 3% lower offer ($170k) is reasonable based on typical stale-listing flexibility.
- 7 sale attempts since 22y ago with the ask held roughly flat each time — persistent listings suggest the price (not the market) is what's stuck; bring a comps-based counter.
- Current owner paid $45k; list at $175k implies a 289% gain — meaningful room to come down on a strong offer.
Risks & watch-outs
- Watch-outs: built in 1945 — expect roof / HVAC / electrical / plumbing capex.
Questions for the listing agent
- It's been on market 59 days. Have you received any prior offers? Is the seller open to a 3% concession, seller financing, or rate buy-down credit?
- Can we see the unit-by-unit rent roll, current vacancy, and any below-market leases? What's the average tenancy length?
- What capital expenditures (roof, boiler, parking lot, exteriors) have been made in the last 5 years, and what's planned in the next 2?
- Built in 1945 — when were the roof, HVAC, electrical panel, plumbing, and water heater last replaced?
- Is there a deadline driving the sale (1031 exchange, divorce, estate, relocation)? That informs how much negotiation room exists.
- What's the average days-on-market for RENTAL listings here right now (not sales)? A rising rental-DOM trend means longer vacancies and softer asking-rent achievability than the comps imply.
- What's the recent tenant-quality profile in this submarket — average credit score on applications, eviction rate, late-payment / NSF rate, and stable-employment percentage? A property-management company in the area should have these aggregated.
- How much new apartment / multifamily construction is in the pipeline within 1–3 miles? Heavy new supply (>2% of stock underway) typically softens rents 12–24 months out; light construction supports rent growth.
Investment metrics
- 1% rule
- 1.46% ✓
- Cap rate
- 11.10%
- Cash-on-cash
- 17.16%
- DSCR
- 1.76
- GRM
- 5.7
CMA / ARV
- ARV (median comp)
- $137,660
- List price
- $175,000
- Delta
- 27.12%
- Verdict
- OVERPRICED
- Comps
- 9 within 1.0 mi
Show comp detail 1 sale within ~0.75 mi
| Address | Dist | Beds/Ba | Sqft | Sold | Price | $/sf | Match |
|---|---|---|---|---|---|---|---|
| 4354 Norwaldo Ave | 0.08mi | 1/1.0 (-1) | 800 (+9%) | 9mo | $160,000 | $200 | 58 |
Match score weights: distance 35% · size 25% · config 20% · recency 20%. Top-matched comps best support the ARV.
Projected returns pro-forma
-3.0% appreciation · 6.21% rent growth · sell at horizon
- IRR
- 12.3%
- Equity multiple
- 1.51×
- Total profit
- $24,908
- Equity at exit
- $26,093
- IRR
- 23.8%
- Equity multiple
- 3.39×
- Total profit
- $116,950
- Equity at exit
- $15,131
Cash invested: $49,000 (down + closing). Projections, not guarantees.
Landlord ↔ Tenant lean methodology
- Overall (STATE)
- 90 Strongly Landlord-Friendly
- State Indiana
- 90 Strongly Landlord-Friendly · R+11
- County
- — inherits STATE
- City
- — inherits STATE
ZIP-level market 46205
- Rents YoY
- 6.2%
- Active inventory
- 314
- Price-to-rent
- 11.4×
Monthly cashflow live
- Estimated rent
- $2,556 medium interval (Pro) →
- Mortgage (P&I)
- −$918
- Tax from tax record
- −$328 /mo · $3,933/yr
- Insurance
- −$73
- HOA
- −$0
- Vacancy / Maint / Mgmt
- −$537
- Net cashflow
- $701
Break-even live
2-unit breakdown (identical units grouped — click to expand)
| Units | Beds | Baths | Est. rent |
|---|---|---|---|
| 2× units | 2 | 1 | $2,556 |
| #1 | 2 | 1 | $1,278 |
| #2 | 2 | 1 | $1,278 |
| Total (2 units) | $2,556 | ||
UW: 25.0% down · 7.5% · 30yr · 1.5% tax · 5.0% vac · 8.0% maint · 8.0% mgmt
Financing live
Cash to close
- Down payment
- $43,750
- Closing costs
- $5,250
- Reserves months
- —
- Total cash needed
- —
Loan-product check · same deal, 3 products live
Conventional
25% down · 7.5% · 30yr
- Down + closing
- —
- Monthly P&I
- —
- Monthly cashflow
- —
- DSCR
- —
- Eligible?
- —
Personal DTI + credit; lowest rate.
DSCR
20% down · 8.5% · 30yr
- Down + closing
- —
- Monthly P&I
- —
- Monthly cashflow
- —
- DSCR
- —
- Eligible?
- —
No personal income docs; deal must DSCR.
Hard money
10% down · 12.0% · 12mo
- Down + closing
- —
- Monthly P&I
- —
- Monthly cashflow
- —
- DSCR
- —
- Eligible?
- —
Short-term bridge; refi at stabilization.
Rent comps 32 comps
| Address | Beds | Baths | Sqft | Rent | $/sqft | DOM | Units | Dist |
|---|---|---|---|---|---|---|---|---|
| 4560 Marcy Ln Indianapolis, IN | 1.0–2.0 | 1.0 | 770 | $1,565 | $2.03 | 14d | 8 | 0.40mi |
| 2106 E 46th St Indianapolis, IN | 1.0 | 1.0 | 552 | $925 | $1.68 | 10d | 1 | 0.43mi |
| 4525 Indianola Ave Indianapolis, IN | 1.0 | 1.0 | 480 | $774 | $1.61 | 4d | 1 | 0.48mi |
| 2511 E 46th St Indianapolis, IN | 1.0–2.0 | 1.0–2.0 | 830 | $1,305 | $1.57 | 43d | 2 | 0.56mi |
| 5006 Rosslyn Ave Indianapolis, IN | 2.0 | 1.0 | 744 | $2,000 | $2.69 | 23d | 1 | 0.71mi |
| 3763 Baltimore Ave Unit 3765 Indianapolis, IN | 1.0 | 1.0 | 750 | $750 | $1.00 | 43d | 1 | 0.76mi |
| 4400 E Fall Creek Parkway North Dr Indianapolis, IN | 1.0–2.0 | 1.0–1.5 | 857 | $1,349 | $1.57 | 1d | 31 | 0.77mi |
| 3723 Orchard Ave Unit 3723 Indianapolis, IN | 1.0 | 1.5 | 700 | $1,300 | $1.86 | 23d | 1 | 0.77mi |
| 3709 Kinnear Ave Indianapolis, IN | 2.0 | 1.0 | 650 | $1,000 | $1.54 | 43d | 1 | 0.80mi |
| 3719 Hillside Ave Indianapolis, IN | 1.0 | 1.0 | 644 | $725 | $1.13 | 23d | 1 | 0.83mi |
| 5018 Lemans Dr Indianapolis, IN | 4.0 | 1.0–2.0 | 762 | $1,209 | $1.59 | 2d | 37 | 0.85mi |
| 2111 E 52nd St Indianapolis, IN | 1.0–2.0 | 1.0 | 750 | $1,150 | $1.53 | 7d | 4 | 0.86mi |
| 5169 Caroline Ave Indianapolis, IN | 1.0 | 1.0 | 600 | $1,400 | $2.33 | 23d | 1 | 0.86mi |
| 3609 Balsam Ave Indianapolis, IN | 1.0 | 1.0 | 541 | $755 | $1.40 | 14d | 1 | 0.95mi |
| 3609 Balsam Ave Indianapolis, IN | 1.0 | 1.0 | 541 | $775 | $1.43 | 2d | 1 | 0.95mi |
| 3610 Balsam Ave Indianapolis, IN | 1.0 | 1.0 | 464 | $775 | $1.67 | 2d | 9 | 0.97mi |
| 3519 Balsam Ave Unit 7 Indianapolis, IN | 1.0 | 1.0 | 450 | $850 | $1.89 | 23d | 1 | 0.98mi |
| 3519 Balsam Ave Unit 6 Indianapolis, IN | 1.0 | 1.0 | 450 | $775 | $1.72 | 43d | 1 | 0.99mi |
| 5220 Luzzane Dr Indianapolis, IN | 1.0–3.0 | 1.0–2.0 | 1046 | $1,410 | $1.35 | 16d | 19 | 1.00mi |
| 5220 Luzzane Ln Unit V-802 Indianapolis, IN | 1.0 | 1.0 | 750 | $978 | $1.30 | 2d | 1 | 1.01mi |
| 5220 Luzzane Ln Unit V-301 Indianapolis, IN | 1.0 | 1.0 | 750 | $1,099 | $1.47 | 7d | 1 | 1.01mi |
| 5220 Luzzane Ln Unit V-503 Indianapolis, IN | 1.0 | 1.0 | 750 | $999 | $1.33 | 19d | 1 | 1.01mi |
| 5220 Luzzane Ln Unit V-906 Indianapolis, IN | 1.0 | 1.0 | 750 | $1,016 | $1.35 | 13d | 1 | 1.01mi |
| 2135 Winthrop Ave Indianapolis, IN | 1.0–3.0 | 1.0–2.0 | 926 | $1,918 | $2.07 | 7d | 1 | 1.07mi |
| 1040 Fairfield Ave Unit 104011 Indianapolis, IN | 1.0 | 1.0 | 519 | $799 | $1.54 | 23d | 1 | 1.09mi |
| 4115 Meadows Dr Indianapolis, IN | 1.0–3.0 | 1.0–2.0 | 1013 | $1,374 | $1.36 | 43d | 9 | 1.13mi |
| 636 E 37th St Unit 5 Indianapolis, IN | 2.0 | 1.0 | 700 | $695 | $0.99 | 23d | 1 | 1.14mi |
| 633 E 38th St #4 Indianapolis, IN | 3.0 | 1.0 | 650 | $1,050 | $1.62 | 43d | 1 | 1.14mi |
| 3363 Nicholas Ave Indianapolis, IN | 2.0 | 1.0 | 720 | $1,000 | $1.39 | 3d | 1 | 1.20mi |
| 3836 Central Ave Indianapolis, IN | 1.0 | 1.0 | 600 | $1,125 | $1.88 | 23d | 1 | 1.28mi |
| 3615 Sherman Forest Dr Indianapolis, IN | 4.0 | 1.0–2.5 | 1057 | $1,288 | $1.22 | 4d | 1 | 1.39mi |
| 721 E 54th St Indianapolis, IN | 1.0 | 1.0 | 650 | $1,295 | $1.99 | 7d | 1 | 1.39mi |
Listing history 28 events
-
2026-06-18days on market $175,000 Active 59 DOM
-
2026-06-17days on market $175,000 Active 58 DOM
-
2026-06-16days on market $175,000 Active 57 DOM
-
2026-06-15days on market $175,000 Active 56 DOM
-
2026-06-13days on market $175,000 Active 54 DOM
-
2026-06-13days on market $175,000 Active 53 DOM
-
2026-06-09days on market $175,000 Active 50 DOM
-
2026-06-08days on market $175,000 Active 49 DOM
-
2026-06-07days on market $175,000 Active 48 DOM
-
2026-06-03days on market $175,000 Active 44 DOM
-
2026-06-02days on market $175,000 Active 43 DOM
-
2026-06-01days on market $175,000 Active 42 DOM
-
2026-05-31days on market $175,000 Active 41 DOM
-
2026-04-17$175,000 Active 945-char remark
Show marketing remark (945 chars)
Opportunity knocks at 4312-4314 Norwaldo Ave! This duplex is perfectly positioned just steps from the Indiana State Fairgrounds, one of Indianapolis' most active event hubs, bringing year-round traffic from the Indiana State Fair, concerts, festivals, and exhibitions. The location alone makes this property a standout for investors looking to capitalize on strong rental demand and future appreciation. Each unit features 2 bedrooms and 1 bathroom, with basement laundry offering added convenience for tenants. While the property could use some TLC, it presents a fantastic value-add opportunity for those looking to renovate, increase rents, and build equity quickly. Whether you're considering a full renovation, light cosmetic updates, or a long-term hold strategy, the upside here is clear. A great addition to any portfolio. Don't miss your chance to turn potential into profit in one of Indianapolis' most active and accessible locations!
-
2024-09-09historical $825
-
2024-08-18$825
-
2024-03-14historical $825
-
2024-01-26$825
-
2024-01-13historical $895
-
2023-12-15$895
-
2009-07-24historical 277-char remark
Show marketing remark (277 chars)
Awesome Opportunity! Re-conditioned double / duplex fully leased. 2 Bedroom / 1 Bath w/ Basement on each side. Appliances, new carpet, paint & cosmetics. Property maintained by professional management. Low utilities, low taxes, great location! Must see - investment payoff!
-
2009-07-24soldstatus $45,000 277-char remark
Show marketing remark (277 chars)
Awesome Opportunity! Re-conditioned double / duplex fully leased. 2 Bedroom / 1 Bath w/ Basement on each side. Appliances, new carpet, paint & cosmetics. Property maintained by professional management. Low utilities, low taxes, great location! Must see - investment payoff!
-
2009-01-15$49,900 277-char remark
Show marketing remark (277 chars)
Awesome Opportunity! Re-conditioned double / duplex fully leased. 2 Bedroom / 1 Bath w/ Basement on each side. Appliances, new carpet, paint & cosmetics. Property maintained by professional management. Low utilities, low taxes, great location! Must see - investment payoff!
-
2008-06-30soldstatus $20,000
-
2008-03-06$23,500
-
2008-01-10soldstatus $40,544
-
2004-03-30soldstatus $49,000
-
2004-01-31$52,500
ⓘ Source: listings_history table (triggers on properties + properties_extension) + one-shot
backfill from property_details.listing_events for pre-trigger history.
Tax reassessment forecast IN · Partial reset (capped growth)
- Current annual tax
- $3,933 · $328/mo
- Projected year-2 tax
- $3,933 · $328/mo
- Expected delta
- $0/yr ($0/mo · 0.0%)
ⓘ Screening estimate from a state-policy table — verify with the county assessor before closing.
Climate risk First Street
- Flood 1/10 Low FEMA zone X (unshaded) · 0% chance over 30 yrs
- Wildfire 1/10 Low
- Heat 3/10 Moderate 7 d/yr ≥102°F today · 18 d/yr by 30 yrs out
- Wind 2/10 Low 100% chance of damaging wind over 30 yrs
- Air quality 4/10 Moderate 5 unhealthy d/yr today · 7 by 30 yrs out
Nearby sold comps map
Loading sold comps map…
Walkable amenities ~0.75 mi
Loading nearby amenities…
Taxation est. · year 1
- Rental income
- $30,672
- − Mortgage interest
- −$9,803
- − Property taxes
- −$3,933
- − Insurance
- −$875
- − Repairs & maintenance
- −$2,454
- − Management
- −$2,454
- − Depreciation
- −$5,091
- Taxable income
- $6,063
- Est. tax owed @ 24.0%
- −$1,455
- After-tax cash flow
- $6,955/yr
For passive investors: Depreciation is non-cash, so a rental often shows a tax loss while cash-flowing — sheltering income. Rental losses are passive: they offset passive income freely, and up to $25,000/yr can offset ordinary (W-2) income if you actively participate and your MAGI is under $100k (phasing out to $0 by $150k); unused losses carry forward. On sale, claimed depreciation is recaptured at up to 25%, and gains may owe capital-gains tax (a 1031 exchange can defer both). Figures are a year-1 estimate at your 24.0% rate — not tax advice; consult a CPA.
Schools (NCES district)
- District
- Indianapolis Public Schools
- NCES district ID
- 1804770
- Math proficiency
- 14% ▼ -7.00%
- Reading proficiency
- 20% ▼ -3.00%
- Median HH income
- $32,034
- Composite
- 13.69/100
- National rank
- #9499
- State rank
- #286 of 301 in IN
Livability — Indianapolis city (balance)
No livability data for this city. (Only ~50 U.S. cities are tracked.)
Census & demographics
- Census place
- Indianapolis city (balance), IN
- County
- Marion County · 998,460 people
- City population
- 881,119
- Metro
- Indianapolis-Carmel-Anderson, IN
- Population (ZIP)
- 28,259
- Household income
- $72,417
- Rent vs Own
- Severe rent burden
- 1149.0
Population outlook (Marion County) Hauer SSP2
- Today (2025)
- 1,025,572 people
- By 2030
- 1,065,727 · +3.9%
- By 2040
- 1,141,577 · +11.3%
- By 2050
- 1,208,920 · +17.9%
- By 2075
- 1,367,288 · +33.3%
- By 2100
- 1,438,201 · +40.2%
Race, ethnicity, and origin ACS 2023
- Neighborhood character
- Diverse neighborhood (Simpson 0.64)
- Race & ethnicity
- White 50% Black 32% Two or more races 10% Hispanic / Latino 7% Asian 3%
- Hispanic origin (detail)
- Mexican 4%
- Common ancestry
- Italian 3% Slovak 2% Romanian 2%
- Foreign-born
- 5% · Canada
- Languages at home
- 89% English-only · Spanish 6% Other Indo-European 2% German/W. Germanic 1%
Political lean MEDSL · Marion
- 2024 margin
- Strong D (+27.7) · D 63.0% · R 35.3% · Other 1.7%
- 2008→2024 swing
- -0.7pp no change · 2008: 28.4pp · 2024: 27.7pp
- All cycles
- 2024: D+27.7 2020: D+29.1 2016: D+22.8 2012: D+22.2 2008: D+28.4
Not yet ingested
- Civics
- —
Market trends
- HPI YoY
- ▼ -322.77%
- Current HPI
- 380.5407
- Rent YoY
- ▲ 6.21%
- Metro
- Indianapolis-Carmel-Anderson, IN
- State GDP YoY
- ▲ 2.90%
- F500 in state
- 18
Industry mix (Fortune 500 HQ in IN)
| Industry | F500 HQs | Revenue |
|---|---|---|
| Industrial Machinery | 2 | $37B |
|
||
| Healthcare | 1 | $177B |
|
||
| Pharmaceuticals | 1 | $45B |
|
||
| Metals / Steel | 1 | $18B |
|
||
| Agriculture | 1 | $17B |
|
||
| Packaging | 1 | $12B |
|
||
Price history
+233.3% since first listed15 events — show timeline
- 2026-04-17 Listed $175,000 MIBOR as Distributed by MLS Grid
- 2024-09-09 Rental Removed $825 APPFOLIO
- 2024-08-18 Listed for Rent $825 APPFOLIO
- 2024-03-14 Rental Removed $825 APPFOLIO
- 2024-01-26 Listed for Rent $825 APPFOLIO
- 2024-01-13 Rental Removed $895 APPFOLIO
- 2023-12-15 Listed for Rent $895 APPFOLIO
- 2009-07-24 Listing Removed — MIBOR as Distributed by MLS Grid
- 2009-07-24 Sold (MLS) $45,000 MIBOR as Distributed by MLS Grid
- 2009-01-15 Listed $49,900 MIBOR as Distributed by MLS Grid
- 2008-06-30 Sold (MLS) $20,000 MIBOR as Distributed by MLS Grid
- 2008-03-06 Listed $23,500 MIBOR as Distributed by MLS Grid
- 2008-01-10 Sold (Public Records) $40,544 Public Records
- 2004-03-30 Sold (MLS) $49,000 MIBOR as Distributed by MLS Grid
- 2004-01-31 Listed $52,500 MIBOR as Distributed by MLS Grid
Property tax history
+9.4%/yrLatest (2025): $3,933 · +14.0% YoY. Source: county tax records.
Cash-flow waterfall
monthlySold comps — $/sqft
last 12 mo · ≤1 miLoading sold comps…