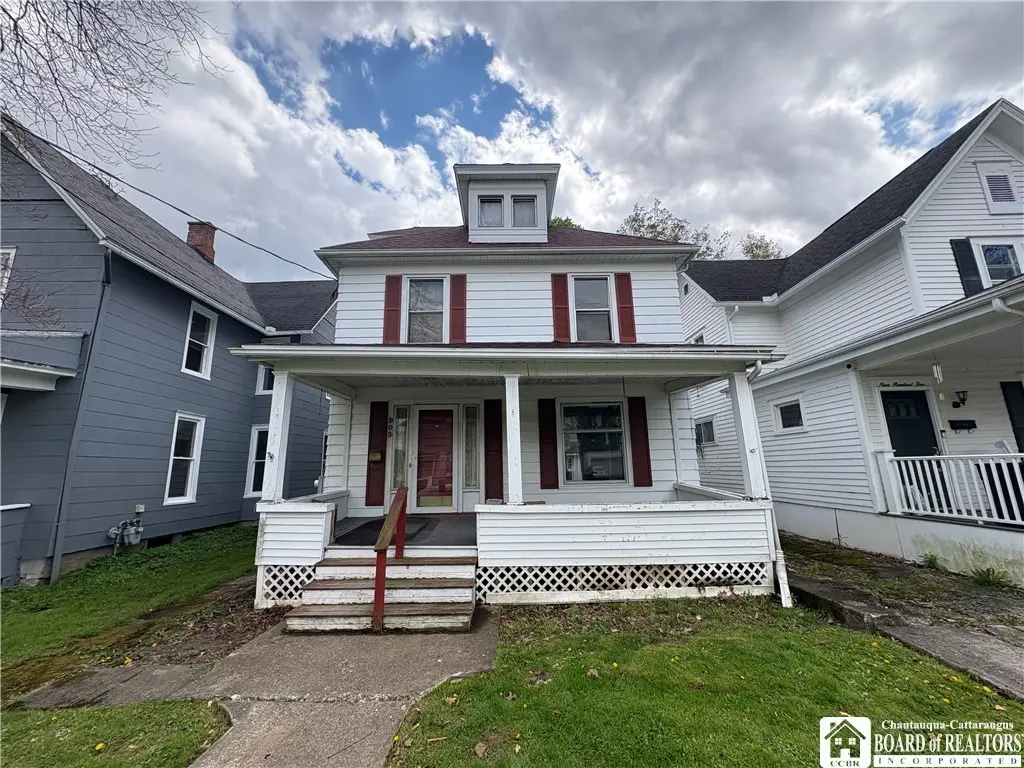
903 W Henley St · Olean, NY
Flood risk 5/10 · Moderate
- FEMA flood zone
- X (shaded)
- Chance of flooding over 30 yrs
- 0.24%
- Est. flood insurance / yr
- $473 – $860
Fire risk 2/10 · Minimal
- Est. fire insurance / yr
- $691 – $1,283
Heat risk 2/10 · Minimal
- Hot days now (above 90°F)
- 8 days/yr
- Hot days in 30 yrs
- 19 days/yr
Wind risk 1/10 · Minimal
- Chance of severe wind over 30 yrs
- —
Air-quality risk 1/10 · Minimal
- Unhealthy air days now
- 0 days/yr
- Unhealthy air days in 30 yrs
- 0 days/yr
Risk factors via First Street. Map © Google.
Why this score? — see what drove the B+ grade
The composite is a weighted blend of 9 inputs, each scored 0–100. Each bar is that input's sub-score; the figure is the points it added to the 100-point composite (weight × sub-score).
- Cash flow +30.0/30.0
- ARV discount +15.0/15.0
- 1% rule +10.0/10.0
- DSCR +10.0/10.0
- Livability +3.6/5.0
- Schools +3.5/10.0
- Rent growth +2.5/5.0
- Condition / age +2.5/5.0
- Appreciation +0.0/10.0
$74,900
🖨 Deal sheet (PDF) 📄 Offer letter ✓ Due diligence
Listing remarks
Charming 3-bedroom, 1-bath home in Olean full of character and opportunity! This home features a brand-new roof, covered front porch, and a rear deck perfect for relaxing or entertaining. Large windows provide plenty of natural light throughout the home, creating bright and inviting living spaces. The basement offers ample storage space, while the home’s solid bones provide an excellent foundation for future updates and improvements. With its comfortable layout and classic charm, this property offers the opportunity to blend modern updates with original character, making it a great canvas to create your dream home. Shared driveway and garage.
Key facts
- Covered front porch
- Ample storage space
- Solid bones
Tags
Property features AI
Exterior
- Parking: Detached garage with shared driveway; 1 garage space
- Utilities: Electricity connected; Public water connected; Sewer connected
- Home design: 2-story existing home; Resale property
- Construction: Block foundation; Shingle roof; Construction details: see remarks
- Exterior features: Rectangular lot; Main thoroughfare frontage
Interior
- Kitchen: Free-standing range; Oven; Refrigerator
- Bedrooms: Total rooms: 9; Living room (listed as a room type)
- Bathrooms: 1 full bathroom
- Heating & cooling: Gas forced-air heating
- Interior features: Separate/formal dining room; Separate/formal living room; Full basement
- Laundry & utility: Gas water heater
Neighborhood map
What this means for you Summary
Snapshot
- This is a 3-bed/1.0-bath single-family listed at $75k.
Deal economics
- At list price, monthly cash flow is $478 ($6k/yr) — positive.
- The deal already cash-flows at list — no discount required.
- Meets the 1% rule at list price ($1k rent vs $75k).
- Recommended offer: $73k (3.0% below list) — sets the bar for market timing.
- Cap rate 14.0% vs local median 8.1% in Olean — top-decile yield for the area; either an underpriced asset or a hidden risk that comps aren't pricing in. Stress-test before assuming the spread holds.
Location & tenants
- Location reads 72/100 on livability (#353 in NY) — a middle-class / working-renter tenant base. Strengths: cost of living A+, housing A+, health & safety A+; Watch: crime F, amenities F, commute F.
- Olean City School District (town): math 40% / reading 43% proficiency, ranked #511 of 590 in NY (top 87%) — families likely to look elsewhere, expect single-tenant / working-renter base with shorter leases.
- Zoned schools: Washington West Elementary School (math 24% / reading 44%, grade F, #1,577 of 2,108 statewide, top 77%, 304 students, 57% FRL); Olean Intermediate-Middle School (math 23% / reading 36%, 564 students, 58% FRL); Olean Senior High School (math 77% / reading 67%, grade B+, #677 of 1,100 statewide, top 63%, 659 students, 49% FRL).
- Market conditions: 143 active listings in the ZIP; 128 units permitted in Cattaraugus County in 2024 (21 in 5+ unit buildings).
Forward outlook
- Local home prices are declining (-3.0%/yr); year-one equity from $518 of loan paydown is wiped out by about $2k of value loss. Plan a longer hold.
- Cattaraugus County population projected at -28% by 2050 — secular population decline; favor cash flow + early exit over multi-decade hold.
- At projected returns (-3.0% appreciation + 3.0% rent growth), your $21k cash investment doubles in ~5 years — after that, you're playing with house money.
Negotiation context
- It's been on market 41 days — a 3% lower offer ($73k) is reasonable based on typical stale-listing flexibility.
- Current owner paid $49k; list at $75k implies a 53% gain — meaningful room to come down on a strong offer.
Risks & watch-outs
- Watch-outs: property tax is 2.7% of price; built in 1900 — expect roof / HVAC / electrical / plumbing capex.
- Climate carrying-cost: moderate flood risk — expect insurance premiums to compound above CPI over the hold.
Questions for the listing agent
- It's been on market 41 days. Have you received any prior offers? Is the seller open to a 3% concession, seller financing, or rate buy-down credit?
- Built in 1900 — when were the roof, HVAC, electrical panel, plumbing, and water heater last replaced?
- Property tax is high relative to price — has the assessment been appealed recently, and will the sale trigger a re-assessment?
- Is there a deadline driving the sale (1031 exchange, divorce, estate, relocation)? That informs how much negotiation room exists.
- Schools are B-rated — typically a magnet for longer-tenancy family renters. What's the average tenant stay here, and is there a school-zone premium baked into asking?
- Crime grade is F in this area — have there been break-ins, vandalism, or insurance claims at this property in the last 3 years? What carrier currently insures it and at what premium?
- What's the average days-on-market for RENTAL listings here right now (not sales)? A rising rental-DOM trend means longer vacancies and softer asking-rent achievability than the comps imply.
- What's the recent tenant-quality profile in this submarket — average credit score on applications, eviction rate, late-payment / NSF rate, and stable-employment percentage? A property-management company in the area should have these aggregated.
- How much new for-sale + rental construction is in the pipeline within 1–3 miles? Heavy new supply typically softens prices + rents 12–24 months out; constrained supply supports both.
Investment metrics
- 1% rule
- 1.81% ✓
- Cap rate
- 13.95%
- Cash-on-cash
- 27.36%
- DSCR
- 2.22
- GRM
- 4.6
CMA / ARV
- ARV (median comp)
- $121,585
- List price
- $74,900
- Delta
- -38.40%
- Verdict
- UNDERPRICED
- Comps
- 20 within 1.0 mi
Show comp detail 12 sales within ~0.75 mi
| Address | Dist | Beds/Ba | Sqft | Sold | Price | $/sf | Match |
|---|---|---|---|---|---|---|---|
| 112 S 7th St | 0.13mi | 2/1.5 (-1) | 1,516 (+2%) | 5mo | $150,000 | $99 | 79 |
| 133 N 13th St | 0.41mi | 3/2.0 | 1,496 (+1%) | 6mo | $149,900 | $100 | 71 |
| 216 N 14th St | 0.52mi | 3/1.5 | 1,516 (+2%) | 3mo | $143,000 | $94 | 68 |
| 1117 W Sullivan St | 0.45mi | 3/1.5 | 1,400 (-6%) | 6mo | $53,500 | $38 | 63 |
| 2005 W State St | 0.67mi | 3/1.0 | 1,504 (+1%) | 5mo | $115,000 | $76 | 62 |
| 133 N 15th St | 0.49mi | 3/1.5 | 1,554 (+5%) | 9mo | $180,000 | $116 | 60 |
| 123 S 4th St | 0.28mi | 2/1.0 (-1) | 1,300 (-12%) | 4mo | $90,000 | $69 | 58 |
| 309 S 3rd St | 0.35mi | 3/1.0 | 1,270 (-14%) | 5mo | $10,000 | $8 | 56 |
| 334 N 13th St | 0.60mi | 2/1.0 (-1) | 1,392 (-6%) | 5mo | $74,500 | $54 | 52 |
| 108 Fulton St | 0.74mi | 3/2.0 | 1,560 (+5%) | 6mo | $69,900 | $45 | 48 |
| 119 W Green St | 0.48mi | 2/1.0 (-1) | 1,278 (-14%) | 9mo | $85,000 | $67 | 42 |
| 115 N 17th St | 0.59mi | 4/2.0 (+1) | 1,638 (+10%) | 9mo | $176,000 | $107 | 38 |
Match score weights: distance 35% · size 25% · config 20% · recency 20%. Top-matched comps best support the ARV.
Projected returns pro-forma
-3.0% appreciation · 3.0% rent growth · sell at horizon
- IRR
- 21.4%
- Equity multiple
- 1.88×
- Total profit
- $18,384
- Equity at exit
- $11,168
- IRR
- 29.6%
- Equity multiple
- 3.65×
- Total profit
- $55,495
- Equity at exit
- $6,476
Cash invested: $20,972 (down + closing). Projections, not guarantees.
Landlord ↔ Tenant lean methodology
- Overall (STATE)
- 15 Strongly Tenant-Friendly
- State New York
- 15 Strongly Tenant-Friendly · D+10
- County
- — inherits STATE
- City
- — inherits STATE
ZIP-level market 14760
- Home prices YoY
- -7.7%
- Active inventory
- 143
- Price-to-rent
- 4.6×
Monthly cashflow live
- Estimated rent
- $1,356 medium interval (Pro) →
- Mortgage (P&I)
- −$393
- Tax from tax record
- −$169 /mo · $2,031/yr
- Insurance
- −$31
- HOA
- −$0
- Vacancy / Maint / Mgmt
- −$285
- Net cashflow
- $478
Break-even live
Sensitivity live
| Price | -10% $521 | -5% $499 | +0% $478 | +5% $457 | +10% $436 |
|---|---|---|---|---|---|
| Rent | -10% $371 | -5% $425 | +0% $478 | +5% $532 | +10% $585 |
| Rate | -1.0pp $516 | -0.5pp $497 | base $478 | +0.5pp $459 | +1.0pp $439 |
UW: 25.0% down · 7.5% · 30yr · 1.5% tax · 5.0% vac · 8.0% maint · 8.0% mgmt
Financing live
Cash to close
- Down payment
- $18,725
- Closing costs
- $2,247
- Reserves months
- —
- Total cash needed
- —
Loan-product check · same deal, 3 products live
Conventional
25% down · 7.5% · 30yr
- Down + closing
- —
- Monthly P&I
- —
- Monthly cashflow
- —
- DSCR
- —
- Eligible?
- —
Personal DTI + credit; lowest rate.
DSCR
20% down · 8.5% · 30yr
- Down + closing
- —
- Monthly P&I
- —
- Monthly cashflow
- —
- DSCR
- —
- Eligible?
- —
No personal income docs; deal must DSCR.
Hard money
10% down · 12.0% · 12mo
- Down + closing
- —
- Monthly P&I
- —
- Monthly cashflow
- —
- DSCR
- —
- Eligible?
- —
Short-term bridge; refi at stabilization.
Listing history 18 events
-
2026-06-21days on market $74,900 Active 41 DOM
-
2026-06-21days on market $74,900 Active 40 DOM
-
2026-06-18days on market $74,900 Active 38 DOM
-
2026-06-17days on market $74,900 Active 37 DOM
-
2026-06-16days on market $74,900 Active 36 DOM
-
2026-06-15days on market $74,900 Active 35 DOM
-
2026-06-13days on market $74,900 Active 33 DOM
-
2026-06-12days on market $74,900 Active 32 DOM
-
2026-06-09days on market $74,900 Active 29 DOM
-
2026-06-08days on market $74,900 Active 28 DOM
-
2026-06-07days on market $74,900 Active 27 DOM
-
2026-06-07days on market $74,900 Active 26 DOM
-
2026-06-04days on market $74,900 Active 23 DOM
-
2026-06-02days on market $74,900 Active 22 DOM
-
2026-06-01days on market $74,900 Active 21 DOM
-
2026-05-31days on market $74,900 Active 20 DOM
-
2026-05-11$74,900 Active 656-char remark
-
2003-11-03soldstatus $49,000
ⓘ Source: listings_history table (triggers on properties + properties_extension) + one-shot
backfill from property_details.listing_events for pre-trigger history.
Tax reassessment forecast NY · Partial reset (capped growth)
- Current annual tax
- $2,031 · $169/mo
- Projected year-2 tax
- $2,031 · $169/mo
- Expected delta
- $0/yr ($0/mo · 0.0%)
ⓘ Screening estimate from a state-policy table — verify with the county assessor before closing.
Climate risk First Street
- Flood 5/10 Major FEMA zone X (shaded) · 24% chance over 30 yrs
- Wildfire 2/10 Low
- Heat 2/10 Low 8 d/yr ≥90°F today · 19 d/yr by 30 yrs out
- Wind 1/10 Low
- Air quality 1/10 Low 0 unhealthy d/yr today · 0 by 30 yrs out
Nearby sold comps map
Loading sold comps map…
Walkable amenities ~0.75 mi
Loading nearby amenities…
Taxation est. · year 1
- Rental income
- $16,274
- − Mortgage interest
- −$4,196
- − Property taxes
- −$2,031
- − Insurance
- −$374
- − Repairs & maintenance
- −$1,302
- − Management
- −$1,302
- − Depreciation
- −$2,179
- Taxable income
- $4,891
- Est. tax owed @ 24.0%
- −$1,174
- After-tax cash flow
- $4,564/yr
For passive investors: Depreciation is non-cash, so a rental often shows a tax loss while cash-flowing — sheltering income. Rental losses are passive: they offset passive income freely, and up to $25,000/yr can offset ordinary (W-2) income if you actively participate and your MAGI is under $100k (phasing out to $0 by $150k); unused losses carry forward. On sale, claimed depreciation is recaptured at up to 25%, and gains may owe capital-gains tax (a 1031 exchange can defer both). Figures are a year-1 estimate at your 24.0% rate — not tax advice; consult a CPA.
Schools (NCES district)
- District
- Olean City School District
- NCES district ID
- 3621720
- Math proficiency
- 40% ▼ -10.00%
- Reading proficiency
- 43% ▼ -3.00%
- Median HH income
- $40,365
- Composite
- 34.81/100
- National rank
- #5104
- State rank
- #511 of 590 in NY
Livability — Olean
- Score
- 72/100
- State rank
- #353
- US rank
- #5930
Category grades
Schools grade is shown separately in the Schools card above.
Census & demographics
- Census place
- Olean, NY
- City population
- 17,272
- Population (ZIP)
- 17,272
Population outlook (Cattaraugus County) Hauer SSP2
- Today (2025)
- 71,623 people
- By 2030
- 67,751 · -5.4%
- By 2040
- 59,488 · -16.9%
- By 2050
- 51,601 · -28.0%
- By 2075
- 35,025 · -51.1%
- By 2100
- 21,243 · -70.3%
Race, ethnicity, and origin ACS 2023
- Neighborhood character
- Predominantly White (89%)
- Race & ethnicity
- White 89% Two or more races 5% Black 2% Asian 2% Hispanic / Latino 1%
- Common ancestry
- Romanian 10% Iranian 2% Lithuanian 1%
- Foreign-born
- 3% · Canada
- Languages at home
- 97% English-only · Other Indo-European 1%
Political lean MEDSL · Cattaraugus
- 2024 margin
- Solid R (+32.8) · D 33.6% · R 66.4%
- 2008→2024 swing
- -22.2pp toward R · 2008: -10.6pp · 2024: -32.8pp
- All cycles
- 2024: R+32.8 2020: R+29.5 2016: R+34.4 2012: R+13.4 2008: R+10.6
Not yet ingested
- Civics
- —
Market trends
- HPI YoY
- ▼ -19.85%
- Current HPI
- 237.327
- Rent YoY
- —
- Metro
- —
- State GDP YoY
- ▲ 2.60%
- F500 in state
- 92
Industry mix (Fortune 500 HQ in NY)
| Industry | F500 HQs | Revenue |
|---|---|---|
| Financial Services | 10 | $950B |
|
||
| Consumer Goods | 9 | $162B |
|
||
| Insurance | 4 | $225B |
|
||
| Telecommunications | 2 | $144B |
|
||
| Pharmaceuticals | 2 | $112B |
|
||
| Media / Entertainment | 2 | $69B |
|
||
Price history
+52.9% since first listed2 events — show timeline
- 2026-05-11 Listed $74,900 UNYREIS
- 2003-11-03 Sold (Public Records) $49,000 Public Records
Property tax history
+10.1%/yrLatest (2025): $2,031 · -40.0% YoY. Source: county tax records.
Cash-flow waterfall
monthlySold comps — $/sqft
last 12 mo · ≤1 miLoading sold comps…