166 Dover Dr · Saw Creek, PA
Flood risk 1/10 · Minimal
- FEMA flood zone
- X (unshaded)
- Chance of flooding over 30 yrs
- 0.0%
- Est. flood insurance / yr
- $473 – $860
Fire risk 5/10 · Moderate
- Est. fire insurance / yr
- $511 – $949
Heat risk 3/10 · Minor
- Hot days now (above 95°F)
- 7 days/yr
- Hot days in 30 yrs
- 14 days/yr
Wind risk 4/10 · Minor
- Chance of severe wind over 30 yrs
- 8.0%
Air-quality risk 2/10 · Minimal
- Unhealthy air days now
- 1 days/yr
- Unhealthy air days in 30 yrs
- 2 days/yr
Risk factors via First Street. Map © Google.
Why this score? — see what drove the B+ grade
The composite is a weighted blend of 9 inputs, each scored 0–100. Each bar is that input's sub-score; the figure is the points it added to the 100-point composite (weight × sub-score).
- Cash flow +26.5/30.0
- ARV discount +15.0/15.0
- DSCR +9.0/10.0
- 1% rule +8.8/10.0
- Appreciation +6.8/10.0
- Schools +3.0/10.0
- Livability +3.0/5.0
- Rent growth +2.5/5.0
- Condition / age +2.5/5.0
$149,900
🖨 Deal sheet 📄 Offer letter ✓ Due diligence
Listing remarks MLS
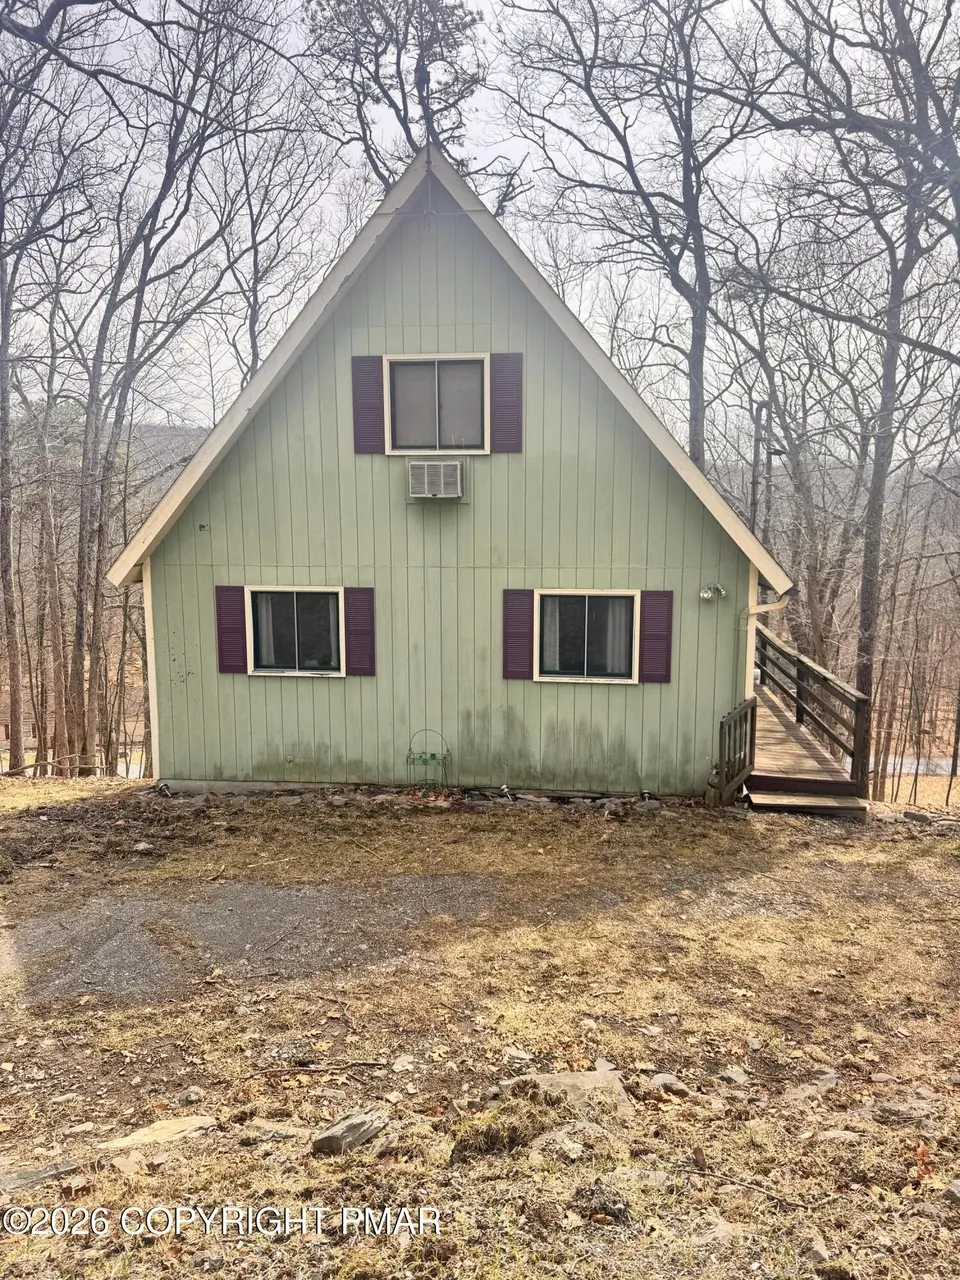
Classic A-frame with a loft, set in a wooded Pocono community just two hours from New York City and Philadelphia. Warm, cozy interior with that classic cabin feel, plus loft space perfect for additional sleeping or a relaxed hangout area. Located in Saw Creek Estates featuring multiple outdoor pools, an indoor pool, indoor tennis courts, and a ski hill. A great option for a weekend escape, vacation home, or Pocono retreat.
Key facts
- A-frame
- Wooded community
- Indoor tennis courts
Tags
Neighborhood map
What this means for you Summary
Snapshot
- This is a 2-bed/1.0-bath single-family listed at $150k.
Deal economics
- At list price, monthly cash flow is $396 ($5k/yr) — positive.
- The deal already cash-flows at list — no discount required.
- Meets the 1% rule at list price ($2k rent vs $150k).
- Recommended offer: $145k (3.0% below list) — sets the bar for market timing.
- Cap rate 9.5% vs local median 4.3% in Saw Creek — top-decile yield for the area; either an underpriced asset or a hidden risk that comps aren't pricing in. Stress-test before assuming the spread holds.
Location & tenants
- Location reads 59/100 on livability (#1,538 in PA) — a working-class tenant base; expect higher turnover. Strengths: crime A+, cost of living A+, housing A+; Watch: employment C-, health & safety D, schools F.
- East Stroudsburg Area SD (rural): math 25% / reading 43% proficiency, ranked #413 of 539 in PA (top 77%) — families likely to look elsewhere, expect single-tenant / working-renter base with shorter leases.
- Market conditions: 290 active listings in the ZIP; 2 comparable units currently listed for rent nearby; 213 units permitted in Pike County in 2024 (0 in 5+ unit buildings).
Forward outlook
- In year one you build about $6k of equity ($1k loan paydown + $5k appreciation (3.5% local appreciation)).
- Pike County population projected at -25% by 2050 — secular population decline; favor cash flow + early exit over multi-decade hold.
- At projected returns (3.5% appreciation + 3.0% rent growth), your $42k cash investment doubles in ~4 years — after that, you're playing with house money.
- By year 6, paydown + projected appreciation supports a ~$33k cash-out refi (75% LTV) — recoverable capital for the next deal without selling this one.
Negotiation context
- It's been on market 60 days — a 3% lower offer ($145k) is reasonable based on typical stale-listing flexibility.
- Current owner paid $128k; 17% above their basis — modest negotiation headroom, anchor on the comps not their cost.
Risks & watch-outs
- Climate carrying-cost: moderate wildfire risk — expect insurance premiums to compound above CPI over the hold.
Questions for the listing agent
- It's been on market 60 days. Have you received any prior offers? Is the seller open to a 3% concession, seller financing, or rate buy-down credit?
- Built in 1978 — when were the roof, HVAC, electrical panel, plumbing, and water heater last replaced?
- What does the HOA fee cover, when was the last increase, and are there any pending special assessments or reserve-fund shortfalls?
- Is there a deadline driving the sale (1031 exchange, divorce, estate, relocation)? That informs how much negotiation room exists.
- Schools are F-rated, which usually means shorter tenancies and higher turnover. Who's the typical renter profile here, and what's been the actual vacancy rate?
- What's the average days-on-market for RENTAL listings here right now (not sales)? A rising rental-DOM trend means longer vacancies and softer asking-rent achievability than the comps imply.
- What's the recent tenant-quality profile in this submarket — average credit score on applications, eviction rate, late-payment / NSF rate, and stable-employment percentage? A property-management company in the area should have these aggregated.
- How much new for-sale + rental construction is in the pipeline within 1–3 miles? Heavy new supply typically softens prices + rents 12–24 months out; constrained supply supports both.
Investment metrics
- 1% rule
- 1.38% ✓
- Cap rate
- 9.46%
- Cash-on-cash
- 11.31%
- DSCR
- 1.50
- GRM
- 6.0
CMA / ARV
- ARV (median comp)
- $247,624
- List price
- $149,900
- Delta
- -39.46%
- Verdict
- UNDERPRICED
- Comps
- 20 within 1.0 mi
Show comp detail 10 sales within ~0.75 mi
| Address | Dist | Beds/Ba | Sqft | Sold | Price | $/sf | Match |
|---|---|---|---|---|---|---|---|
| 167 Dorchester Dr | 0.23mi | 2/1.0 | 1,080 (+7%) | 1mo | $195,000 | $181 | 77 |
| 244 Canterbury Rd | 0.40mi | 3/1.0 (+1) | 1,000 (-1%) | 1mo | $175,000 | $175 | 74 |
| 225 Canterbury Rd | 0.33mi | 3/1.5 (+1) | 1,008 (0%) | 14mo | $155,000 | $154 | 66 |
| 172 Dover Drive Dr | 0.04mi | 3/2.0 (+1) | 1,144 (+14%) | 5mo | $160,000 | $140 | 62 |
| 114 Salisbury Rd | 0.08mi | 3/2.0 (+1) | 1,152 (+14%) | 12mo | $212,500 | $184 | 54 |
| 3126 Snowden Dr | 0.65mi | 3/2.0 (+1) | 1,008 (0%) | 9mo | $265,000 | $263 | 53 |
| 216 Dorchester Dr | 0.25mi | 3/2.0 (+1) | 1,080 (+7%) | 20mo | $259,896 | $241 | 51 |
| 210 Dover Dr | 0.19mi | 3/2.0 (+1) | 1,156 (+15%) | 9mo | $235,000 | $203 | 50 |
| 5936 Decker Rd | 0.57mi | 3/2.0 (+1) | 1,080 (+7%) | 7mo | $218,000 | $202 | 47 |
| 6359 Decker Rd | 0.71mi | 3/3.0 (+1) | 1,101 (+9%) | 22mo | $185,000 | $168 | 20 |
Match score weights: distance 35% · size 25% · config 20% · recency 20%. Top-matched comps best support the ARV.
Projected returns pro-forma
3.51% appreciation · 3.0% rent growth · sell at horizon
- IRR
- 19.3%
- Equity multiple
- 2.13×
- Total profit
- $47,466
- Equity at exit
- $71,713
- IRR
- 20.2%
- Equity multiple
- 4.07×
- Total profit
- $128,989
- Equity at exit
- $113,994
Cash invested: $41,972 (down + closing). Projections, not guarantees.
Landlord ↔ Tenant lean methodology
- Overall (STATE)
- 62 Landlord-Friendly
- State Pennsylvania
- 62 Landlord-Friendly · EVEN
- County
- — inherits STATE
- City
- — inherits STATE
ZIP-level market 18324
- Home prices YoY
- 1.5%
- Active inventory
- 290
- Price-to-rent
- 6.0×
Monthly cashflow live
- Estimated rent
- $2,074 medium interval (Pro) →
- Mortgage (P&I)
- −$786
- Tax from tax record
- −$240 /mo · $2,886/yr
- Insurance
- −$62
- HOA
- −$154
- Vacancy / Maint / Mgmt
- −$436
- Net cashflow
- $396
Break-even live
UW: 25.0% down · 7.5% · 30yr · 1.5% tax · 5.0% vac · 8.0% maint · 8.0% mgmt
Financing live
Cash to close
- Down payment
- $37,475
- Closing costs
- $4,497
- Reserves months
- —
- Total cash needed
- —
Loan-product check · same deal, 3 products live
Conventional
25% down · 7.5% · 30yr
- Down + closing
- —
- Monthly P&I
- —
- Monthly cashflow
- —
- DSCR
- —
- Eligible?
- —
Personal DTI + credit; lowest rate.
DSCR
20% down · 8.5% · 30yr
- Down + closing
- —
- Monthly P&I
- —
- Monthly cashflow
- —
- DSCR
- —
- Eligible?
- —
No personal income docs; deal must DSCR.
Hard money
10% down · 12.0% · 12mo
- Down + closing
- —
- Monthly P&I
- —
- Monthly cashflow
- —
- DSCR
- —
- Eligible?
- —
Short-term bridge; refi at stabilization.
Rent comps 2 comps
| Address | Beds | Baths | Sqft | Rent | $/sqft | DOM | Units | Dist |
|---|---|---|---|---|---|---|---|---|
| 353 Saunders Dr Unit PA East Stroudsburg, PA | 3.0 | 2.0 | 1287 | $2,200 | $1.71 | 20d | 1 | 0.68mi |
| 104 Condor Dr #1 Tamiment, PA | 2.0 | 2.5 | 1308 | $1,800 | $1.38 | 24d | 1 | 1.46mi |
HOA detail
- Monthly dues
- $154 · $1,848/yr
- Likely covers
- pool
Listing history 19 events
-
2026-06-19days on market $149,900 Active 60 DOM
-
2026-06-18days on market $149,900 Active 59 DOM
-
2026-06-17days on market $149,900 Active 58 DOM
-
2026-06-16days on market $149,900 Active 57 DOM
-
2026-06-15days on market $149,900 Active 56 DOM
-
2026-06-14days on market $149,900 Active 54 DOM
-
2026-06-13remarks 547-char remark
-
2026-06-13days on market $149,900 Active 53 DOM
-
2026-06-10days on market $149,900 Active 51 DOM
-
2026-06-09days on market $149,900 Active 50 DOM
-
2026-06-08days on market $149,900 Active 49 DOM
-
2026-06-07days on market $149,900 Active 48 DOM
-
2026-06-05days on market $149,900 Active 45 DOM
-
2026-06-02days on market $149,900 Active 43 DOM
-
2026-06-01days on market $149,900 Active 42 DOM
-
2026-05-31days on market $149,900 Active 41 DOM
-
2026-05-30days on market $149,900 Active 40 DOM
-
2026-04-13$149,900 Active 426-char remark
Show marketing remark (426 chars)
Classic A-frame with a loft, set in a wooded Pocono community just two hours from New York City and Philadelphia. Warm, cozy interior with that classic cabin feel, plus loft space perfect for additional sleeping or a relaxed hangout area. Located in Saw Creek Estates featuring multiple outdoor pools, an indoor pool, indoor tennis courts, and a ski hill. A great option for a weekend escape, vacation home, or Pocono retreat.
-
2005-10-27soldstatus $128,125
ⓘ Source: listings_history table (triggers on properties + properties_extension) + one-shot
backfill from property_details.listing_events for pre-trigger history.
Tax reassessment forecast PA · Partial reset (capped growth)
- Current annual tax
- $2,886 · $240/mo
- Projected year-2 tax
- $2,886 · $240/mo
- Expected delta
- $0/yr ($0/mo · 0.0%)
ⓘ Screening estimate from a state-policy table — verify with the county assessor before closing.
Climate risk First Street
- Flood 1/10 Low FEMA zone X (unshaded) · 0% chance over 30 yrs
- Wildfire 5/10 Major
- Heat 3/10 Moderate 7 d/yr ≥95°F today · 14 d/yr by 30 yrs out
- Wind 4/10 Moderate 8% chance of damaging wind over 30 yrs
- Air quality 2/10 Low 1 unhealthy d/yr today · 2 by 30 yrs out
Nearby sold comps map
Loading sold comps map…
Walkable amenities ~0.75 mi
Loading nearby amenities…
Taxation est. · year 1
- Rental income
- $24,891
- − Mortgage interest
- −$8,397
- − Property taxes
- −$2,886
- − Insurance
- −$750
- − Repairs & maintenance
- −$1,991
- − Management
- −$1,991
- − HOA
- −$1,848
- − Depreciation
- −$4,361
- Taxable income
- $2,668
- Est. tax owed @ 24.0%
- −$640
- After-tax cash flow
- $4,107/yr
For passive investors: Depreciation is non-cash, so a rental often shows a tax loss while cash-flowing — sheltering income. Rental losses are passive: they offset passive income freely, and up to $25,000/yr can offset ordinary (W-2) income if you actively participate and your MAGI is under $100k (phasing out to $0 by $150k); unused losses carry forward. On sale, claimed depreciation is recaptured at up to 25%, and gains may owe capital-gains tax (a 1031 exchange can defer both). Figures are a year-1 estimate at your 24.0% rate — not tax advice; consult a CPA.
Schools (NCES district)
- District
- East Stroudsburg Area SD
- NCES district ID
- 4208670
- Math proficiency
- 25% ▼ -11.00%
- Reading proficiency
- 43% ▼ -18.00%
- Median HH income
- $57,142
- Composite
- 30.13/100
- National rank
- #6332
- State rank
- #413 of 539 in PA
Livability — Saw Creek
- Score
- 59/100
- State rank
- #1538
- US rank
- #20241
Category grades
Schools grade is shown separately in the Schools card above.
Census & demographics
- Census place
- Saw Creek, PA
- Population (ZIP)
- 9,591
Population outlook (Pike County) Hauer SSP2
- Today (2025)
- 53,548 people
- By 2030
- 51,622 · -3.6%
- By 2040
- 46,490 · -13.2%
- By 2050
- 40,372 · -24.6%
- By 2075
- 31,951 · -40.3%
- By 2100
- 26,821 · -49.9%
Race, ethnicity, and origin ACS 2023
- Neighborhood character
- Diverse neighborhood (Simpson 0.67)
- Race & ethnicity
- White 47% Hispanic / Latino 26% Black 21% Two or more races 12% Asian 1%
- Hispanic origin (detail)
- Mexican 1% Puerto Rican 12% Cuban 3% Dominican 5%
- Common ancestry
- Romanian 2% Estonian 1% Lithuanian 1%
- Foreign-born
- 19% · Canada, South Korea
- Languages at home
- 69% English-only · Spanish 19% Russian/Polish/Slavic 4% French/Haitian/Cajun 3%
Political lean MEDSL · Pike
- 2024 margin
- Strong R (+24.1) · D 37.6% · R 61.6%
- 2008→2024 swing
- -19.8pp toward R · 2008: -4.2pp · 2024: -24.1pp
- All cycles
- 2024: R+24.1 2020: R+19.0 2016: R+26.0 2012: R+11.0 2008: R+4.2
Not yet ingested
- Civics
- —
Market trends
- HPI YoY
- ▲ 3.51%
- Current HPI
- 243.6754
- Rent YoY
- —
- Metro
- —
- State GDP YoY
- ▲ 1.68%
- F500 in state
- 34
Industry mix (Fortune 500 HQ in PA)
| Industry | F500 HQs | Revenue |
|---|---|---|
| Healthcare | 2 | $309B |
|
||
| Insurance | 2 | $27B |
|
||
| Telecommunications / Media | 1 | $124B |
|
||
| Industrial Distribution | 1 | $22B |
|
||
| Financial Services | 1 | $20B |
|
||
| Chemicals / Materials | 1 | $18B |
|
||
Price history
+17.0% since first listed2 events — show timeline
- 2026-04-13 Listed $149,900 PMAR
- 2005-10-27 Sold (Public Records) $128,125 Public Records
Property tax history
+1.0%/yrLatest (2026): $2,886 · +1.6% YoY. Source: county tax records.
Cash-flow waterfall
monthlySold comps — $/sqft
last 12 mo · ≤1 miLoading sold comps…