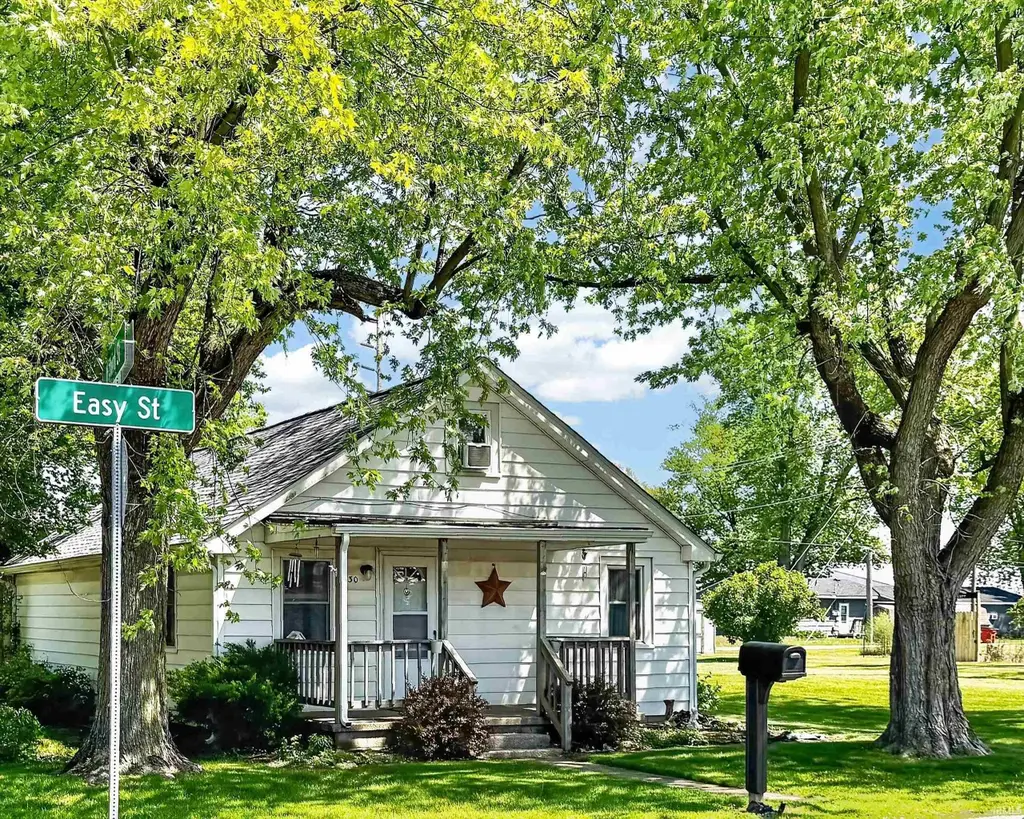
530 Easy St · Monticello, IN
Flood risk 1/10 · Minimal
- FEMA flood zone
- X (unshaded)
- Chance of flooding over 30 yrs
- 0.0%
- Est. flood insurance / yr
- $507 – $1,088
Fire risk 3/10 · Minor
- Est. fire insurance / yr
- $717 – $1,331
Heat risk 3/10 · Minor
- Hot days now (above 102°F)
- 7 days/yr
- Hot days in 30 yrs
- 17 days/yr
Wind risk 2/10 · Minimal
- Chance of severe wind over 30 yrs
- —
Air-quality risk 2/10 · Minimal
- Unhealthy air days now
- 1 days/yr
- Unhealthy air days in 30 yrs
- 2 days/yr
Risk factors via First Street. Map © Google.
Why this score? — see what drove the B- grade
The composite is a weighted blend of 9 inputs, each scored 0–100. Each bar is that input's sub-score; the figure is the points it added to the 100-point composite (weight × sub-score).
- Cash flow +25.9/30.0
- ARV discount +15.0/15.0
- DSCR +8.7/10.0
- 1% rule +5.5/10.0
- Schools +3.6/10.0
- Livability +3.6/5.0
- Rent growth +2.5/5.0
- Condition / age +2.5/5.0
- Appreciation +0.0/10.0
$112,000
🖨 Deal sheet 📄 Offer letter ✓ Due diligence
Listing remarks
Charming and cozy 3-bedroom, 1.5-bath home perfectly situated on a corner lot on Easy Street in Monticello! This inviting property offers a warm and welcoming feel with plenty of potential to make it your own. The 1-car garage provides flexible space—ideal for parking, a workshop, potting shed, or creative studio. Whether you're looking for a starter home, downsizing, or an investment opportunity, this property checks the boxes. Being sold AS IS and priced to sell—don’t miss your chance to bring your vision to life and make this home your own!
Key facts
- Flexible space
- 1 car garage
- Corner lot
Tags
Property features AI
Exterior
- Parking: Detached gravel garage with 1 garage space
- Utilities: Public water; Public sewer
- Home design: Single-family residence (site-built); One story
- Construction: Vinyl siding; Asphalt roof; Block foundation; Built as site-built home
- Exterior features: Deck; Porch; Corner, level, landscaped lot; Shed(s)
Interior
- Kitchen: Refrigerator; Gas range
- Bedrooms: Total rooms: 6
- Flooring: Carpet; Vinyl
- Bathrooms: 1 full bathroom; 1 half bathroom; 2 main-level bathrooms
- Heating & cooling: Natural gas heating; Central air conditioning
- Interior features: Window treatments; 1 fireplace; Crawl space basement
- Laundry & utility: Washer; Dryer; Main-level laundry; Gas water heater; Water heater
Neighborhood map
What this means for you Summary
Snapshot
- This is a 3-bed/1.5-bath single-family listed at $112k.
Deal economics
- At list price, monthly cash flow is $274 ($3k/yr) — positive.
- The deal already cash-flows at list — no discount required.
- Meets the 1% rule at list price ($1k rent vs $112k).
- Recommended offer: $109k (3.0% below list) — sets the bar for market timing.
- Cap rate 9.2% vs local median 3.3% in Monticello — top-decile yield for the area; either an underpriced asset or a hidden risk that comps aren't pricing in. Stress-test before assuming the spread holds.
Location & tenants
- Location reads 71/100 on livability (#141 in IN) — a middle-class / working-renter tenant base. Strengths: cost of living A+, housing A+, health & safety A+; Watch: amenities F, commute F, employment F.
- Twin Lakes School Corporation (town): math 39% / reading 46% proficiency, ranked #116 of 301 in IN (top 38%) — families likely to look elsewhere, expect single-tenant / working-renter base with shorter leases.
- Zoned schools: Meadowlawn Elementary School (math 36% / reading 37%, grade F, #571 of 994 statewide, top 58%, 567 students, 56% FRL); Roosevelt Middle School (math 38% / reading 47%, grade D-, #98 of 330 statewide, top 30%, 523 students, 67% FRL); Twin Lakes Senior High School (math 37% / reading 62%, grade D, #123 of 369 statewide, top 36%, 674 students, 59% FRL) — zoned schools average 60% FRL vs 41% district-wide (20 pts higher); higher-poverty schools than district average — tighter screening recommended.
- Market conditions: 220 active listings in the ZIP; 2 comparable units currently listed for rent nearby; 47 units permitted in White County in 2024 (0 in 5+ unit buildings).
Forward outlook
- Local home prices are declining (-3.0%/yr); year-one equity from $774 of loan paydown is wiped out by about $3k of value loss. Plan a longer hold.
- White County population projected at -19% by 2050 — secular population decline; favor cash flow + early exit over multi-decade hold.
Negotiation context
- It's been on market 44 days — a 3% lower offer ($109k) is reasonable based on typical stale-listing flexibility.
- 2 sale attempts with the ask held roughly flat each time — persistent listings suggest the price (not the market) is what's stuck; bring a comps-based counter.
Risks & watch-outs
- Watch-outs: built in 1945 — expect roof / HVAC / electrical / plumbing capex.
Questions for the listing agent
- It's been on market 44 days. Have you received any prior offers? Is the seller open to a 3% concession, seller financing, or rate buy-down credit?
- Built in 1945 — when were the roof, HVAC, electrical panel, plumbing, and water heater last replaced?
- Is there a deadline driving the sale (1031 exchange, divorce, estate, relocation)? That informs how much negotiation room exists.
- What's the average days-on-market for RENTAL listings here right now (not sales)? A rising rental-DOM trend means longer vacancies and softer asking-rent achievability than the comps imply.
- What's the recent tenant-quality profile in this submarket — average credit score on applications, eviction rate, late-payment / NSF rate, and stable-employment percentage? A property-management company in the area should have these aggregated.
- How much new for-sale + rental construction is in the pipeline within 1–3 miles? Heavy new supply typically softens prices + rents 12–24 months out; constrained supply supports both.
Investment metrics
- 1% rule
- 1.05% ✓
- Cap rate
- 9.23%
- Cash-on-cash
- 10.50%
- DSCR
- 1.47
- GRM
- 7.9
CMA / ARV
- ARV (median comp)
- $145,070
- List price
- $112,000
- Delta
- -22.80%
- Verdict
- UNDERPRICED
- Comps
- 20 within 1.0 mi
Show comp detail 9 sales within ~0.75 mi
| Address | Dist | Beds/Ba | Sqft | Sold | Price | $/sf | Match |
|---|---|---|---|---|---|---|---|
| 442 Walnut St | 0.20mi | 3/1.0 | 930 (+2%) | 6mo | $138,500 | $149 | 80 |
| 418 Chestnut St | 0.29mi | 2/1.0 (-1) | 794 (-13%) | 1mo | $165,000 | $208 | 58 |
| 503 Hanawalt St | 0.14mi | 2/1.0 (-1) | 832 (-9%) | 21mo | $130,000 | $156 | 54 |
| 102 Pierce Cir | 0.48mi | 2/1.5 (-1) | 988 (+8%) | 13mo | $178,000 | $180 | 47 |
| 720 N Illinois St | 0.29mi | 2/2.0 (-1) | 996 (+9%) | 20mo | $164,900 | $166 | 47 |
| 102 Pierce Cir | 0.48mi | 2/1.5 (-1) | 988 (+8%) | 21mo | $137,500 | $139 | 41 |
| 610 N Main St | 0.38mi | 3/1.0 | 1,048 (+15%) | 21mo | $139,900 | $133 | 38 |
| 960 Mitchell Ave | 0.72mi | 3/1.5 | 1,026 (+12%) | 13mo | $184,000 | $179 | 35 |
| 323 N Beach Dr | 0.75mi | 2/1.0 (-1) | 960 (+5%) | 18mo | $160,100 | $167 | 34 |
Match score weights: distance 35% · size 25% · config 20% · recency 20%. Top-matched comps best support the ARV.
Projected returns pro-forma
-3.0% appreciation · 3.0% rent growth · sell at horizon
- IRR
- -0.6%
- Equity multiple
- 0.98×
- Total profit
- $-725
- Equity at exit
- $16,700
- IRR
- 9.0%
- Equity multiple
- 1.69×
- Total profit
- $21,651
- Equity at exit
- $9,684
Cash invested: $31,360 (down + closing). Projections, not guarantees.
Landlord ↔ Tenant lean methodology
- Overall (STATE)
- 90 Strongly Landlord-Friendly
- State Indiana
- 90 Strongly Landlord-Friendly · R+11
- County
- — inherits STATE
- City
- — inherits STATE
ZIP-level market 47960
- Home prices YoY
- -17.8%
- Active inventory
- 220
- Price-to-rent
- 7.9×
Monthly cashflow live
- Estimated rent
- $1,176 medium interval (Pro) →
- Mortgage (P&I)
- −$587
- Tax from tax record
- −$21 /mo · $250/yr
- Insurance
- −$47
- HOA
- −$0
- Vacancy / Maint / Mgmt
- −$247
- Net cashflow
- $274
Break-even live
UW: 25.0% down · 7.5% · 30yr · 1.5% tax · 5.0% vac · 8.0% maint · 8.0% mgmt
Financing live
Cash to close
- Down payment
- $28,000
- Closing costs
- $3,360
- Reserves months
- —
- Total cash needed
- —
Loan-product check · same deal, 3 products live
Conventional
25% down · 7.5% · 30yr
- Down + closing
- —
- Monthly P&I
- —
- Monthly cashflow
- —
- DSCR
- —
- Eligible?
- —
Personal DTI + credit; lowest rate.
DSCR
20% down · 8.5% · 30yr
- Down + closing
- —
- Monthly P&I
- —
- Monthly cashflow
- —
- DSCR
- —
- Eligible?
- —
No personal income docs; deal must DSCR.
Hard money
10% down · 12.0% · 12mo
- Down + closing
- —
- Monthly P&I
- —
- Monthly cashflow
- —
- DSCR
- —
- Eligible?
- —
Short-term bridge; refi at stabilization.
Rent comps 2 comps
| Address | Beds | Baths | Sqft | Rent | $/sqft | DOM | Units | Dist |
|---|---|---|---|---|---|---|---|---|
| 1101 Foxwood Ct Monticello, IN | 1.0–3.0 | 1.0–2.0 | 969 | $1,183 | $1.22 | 13d | 7 | 0.34mi |
| 6568a E Riverview Rd Apt A Monticello, IN | 2.0 | 1.5 | 950 | $1,150 | $1.21 | 13d | 1 | 1.35mi |
Listing history 17 events
-
2026-06-18days on market $112,000 Active 44 DOM
-
2026-06-17days on market $112,000 Active 43 DOM
-
2026-06-16days on market $112,000 Active 42 DOM
-
2026-06-15days on market $112,000 Active 41 DOM
-
2026-06-13days on market $112,000 Active 39 DOM
-
2026-06-12days on market $112,000 Active 38 DOM
-
2026-06-09days on market $112,000 Active 35 DOM
-
2026-06-08days on market $112,000 Active 34 DOM
-
2026-06-07days on market $112,000 Active 33 DOM
-
2026-06-07statusdays on market $112,000 Active 32 DOM
-
2026-06-04days on market $112,000 Active Under Contract 29 DOM
-
2026-06-02days on market $112,000 Active Under Contract 28 DOM
-
2026-06-01days on market $112,000 Active Under Contract 27 DOM
-
2026-05-31days on market $112,000 Active Under Contract 26 DOM
-
2026-05-31days on market $112,000 Active Under Contract 25 DOM
-
2026-05-09historical Active Under Contract 567-char remark
-
2026-05-05$112,000 Active 567-char remark
ⓘ Source: listings_history table (triggers on properties + properties_extension) + one-shot
backfill from property_details.listing_events for pre-trigger history.
Tax reassessment forecast IN · Partial reset (capped growth)
- Current annual tax
- $250 · $21/mo
- Projected year-2 tax
- $601 · $50/mo
- Expected delta
- +$351/yr (+$29/mo · 140.7%)
ⓘ Screening estimate from a state-policy table — verify with the county assessor before closing.
Climate risk First Street
- Flood 1/10 Low FEMA zone X (unshaded) · 0% chance over 30 yrs
- Wildfire 3/10 Moderate
- Heat 3/10 Moderate 7 d/yr ≥102°F today · 17 d/yr by 30 yrs out
- Wind 2/10 Low
- Air quality 2/10 Low 1 unhealthy d/yr today · 2 by 30 yrs out
Nearby sold comps map
Loading sold comps map…
Walkable amenities ~0.75 mi
Loading nearby amenities…
Taxation est. · year 1
- Rental income
- $14,115
- − Mortgage interest
- −$6,274
- − Property taxes
- −$250
- − Insurance
- −$560
- − Repairs & maintenance
- −$1,129
- − Management
- −$1,129
- − Depreciation
- −$3,258
- Taxable income
- $1,515
- Est. tax owed @ 24.0%
- −$364
- After-tax cash flow
- $2,930/yr
For passive investors: Depreciation is non-cash, so a rental often shows a tax loss while cash-flowing — sheltering income. Rental losses are passive: they offset passive income freely, and up to $25,000/yr can offset ordinary (W-2) income if you actively participate and your MAGI is under $100k (phasing out to $0 by $150k); unused losses carry forward. On sale, claimed depreciation is recaptured at up to 25%, and gains may owe capital-gains tax (a 1031 exchange can defer both). Figures are a year-1 estimate at your 24.0% rate — not tax advice; consult a CPA.
Schools (NCES district)
- District
- Twin Lakes School Corporation
- NCES district ID
- 1811580
- Math proficiency
- 39% ▼ -10.00%
- Reading proficiency
- 46% ▼ -5.00%
- Median HH income
- $48,963
- Composite
- 36.44/100
- National rank
- #4666
- State rank
- #116 of 301 in IN
Livability — Monticello
- Score
- 71/100
- State rank
- #141
- US rank
- #7278
Category grades
Schools grade is shown separately in the Schools card above.
Census & demographics
- Census place
- Monticello, IN
- Population (ZIP)
- 15,313
Population outlook (White County) Hauer SSP2
- Today (2025)
- 23,006 people
- By 2030
- 22,204 · -3.5%
- By 2040
- 20,441 · -11.1%
- By 2050
- 18,711 · -18.7%
- By 2075
- 14,989 · -34.8%
- By 2100
- 10,896 · -52.6%
Race, ethnicity, and origin ACS 2023
- Neighborhood character
- Predominantly White (92%)
- Race & ethnicity
- White 92% Hispanic / Latino 6% Two or more races 3%
- Hispanic origin (detail)
- Mexican 5%
- Common ancestry
- Romanian 4% Iranian 3% Lithuanian 2%
- Foreign-born
- 4% · Canada
- Languages at home
- 94% English-only · Spanish 4%
Political lean MEDSL · White
- 2024 margin
- Solid R (+45.0) · D 26.4% · R 71.4% · Other 2.2%
- 2008→2024 swing
- -36.7pp toward R · 2008: -8.3pp · 2024: -45.0pp
- All cycles
- 2024: R+45.0 2020: R+44.1 2016: R+42.9 2012: R+23.6 2008: R+8.3
Not yet ingested
- Civics
- —
Market trends
- HPI YoY
- ▼ -52.85%
- Current HPI
- 243.8468
- Rent YoY
- —
- Metro
- —
- State GDP YoY
- ▲ 2.90%
- F500 in state
- 18
Industry mix (Fortune 500 HQ in IN)
| Industry | F500 HQs | Revenue |
|---|---|---|
| Industrial Machinery | 2 | $37B |
|
||
| Healthcare | 1 | $177B |
|
||
| Pharmaceuticals | 1 | $45B |
|
||
| Metals / Steel | 1 | $18B |
|
||
| Agriculture | 1 | $17B |
|
||
| Packaging | 1 | $12B |
|
||
Price history
3 events — show timeline
- 2026-06-05 Relisted — IRMLS
- 2026-05-09 Contingent — IRMLS
- 2026-05-05 Listed $112,000 IRMLS
Property tax history
+136.7%/yrLatest (2024): $250 · +94.8% YoY. Source: county tax records.
Cash-flow waterfall
monthlySold comps — $/sqft
last 12 mo · ≤1 miLoading sold comps…