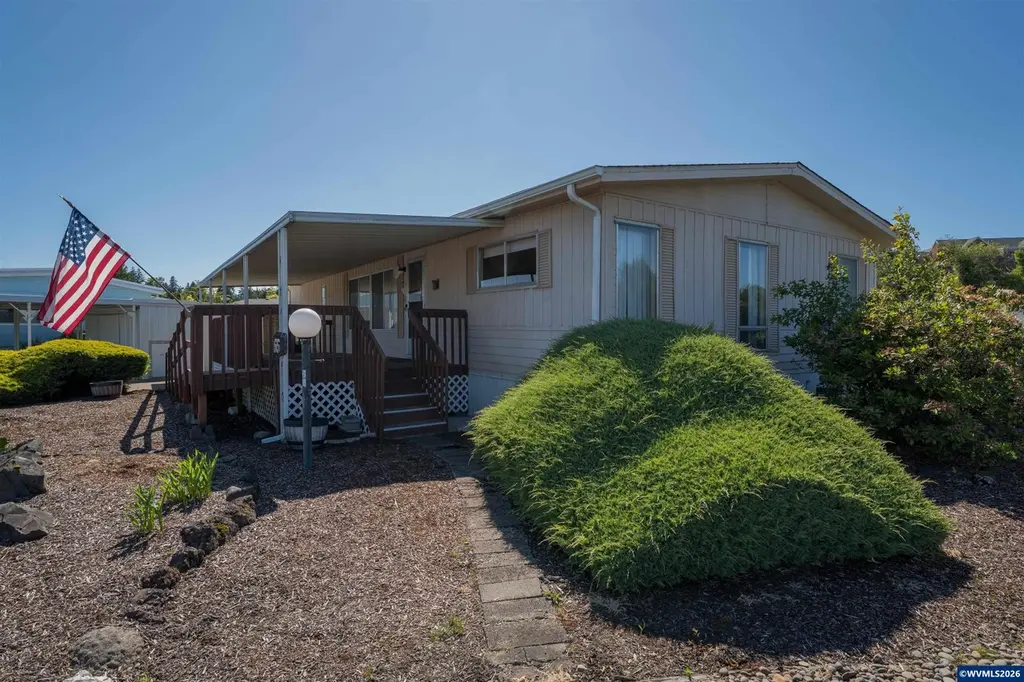
277 NE Conifer Blvd #65 · Corvallis, OR
Flood risk 3/10 · Minor
- FEMA flood zone
- AE
- Chance of flooding over 30 yrs
- 0.1%
- Est. flood insurance / yr
- $1,737 – $8,500
Fire risk 4/10 · Minor
- Est. fire insurance / yr
- $498 – $926
Heat risk 4/10 · Minor
- Hot days now (above 91°F)
- 7 days/yr
- Hot days in 30 yrs
- 14 days/yr
Wind risk 1/10 · Minimal
- Chance of severe wind over 30 yrs
- —
Air-quality risk 9/10 · Severe
- Unhealthy air days now
- 12 days/yr
- Unhealthy air days in 30 yrs
- 12 days/yr
Risk factors via First Street. Map © Google.
Why this score? — see what drove the A- grade
The composite is a weighted blend of 9 inputs, each scored 0–100. Each bar is that input's sub-score; the figure is the points it added to the 100-point composite (weight × sub-score).
- Cash flow +30.0/30.0
- ARV discount +15.0/15.0
- 1% rule +10.0/10.0
- DSCR +10.0/10.0
- Schools +4.9/10.0
- Livability +4.1/5.0
- Rent growth +3.9/5.0
- Condition / age +2.5/5.0
- Appreciation +0.0/10.0
$89,900
🖨 Deal sheet 📄 Offer letter ✓ Due diligence
Listing remarks MLS
Apple trees just outside your back door make for a wonderful privacy feature. Placed on a corner lot, this manufactured home is ready to move in. The generous windows provide ample lighting throughout the home. A large living room with a formal dining give space for gathering. Built in cabinets in the dining room create more storage space. Right off the kitchen is a cozy family room with a wood stove. This split bedroom floor plan creates space and privacy with a bedroom and bathroom on either side.
Key facts
- Large windows
- Covered deck
- Wood stove
Tags
Property features AI
Finance
- Other: Home warranty not included; Possession at COE; Refrigerator, washer, and dryer included
- HOA & community: Adult park community (Meadow Park); Park rent covers water, sewer, garbage, and cable
Exterior
- Parking: One garage space; Carport
- Utilities: City water (connected); City sewer; Electric water heater; Park rent includes water, sewer, garbage, and cable
- Home design: Double-wide mobile home; Single-story; Front door described in building notes; Beige exterior color
- Construction: Built in 1972; Aluminum siding; T111 siding style; Pier foundation; Composition roof; Mobile home size approx. 24 x 52 (Spacemaster, serial S24552FR1282)
- Exterior features: Covered deck; Private backyard (garden potential); Shed; Adult park community; Floodplain (property is in a floodplain); No formal landscaping noted; Handicap amenities (refer to remarks)
Interior
- Kitchen: Electric range; Dishwasher; Refrigerator included
- Bedrooms: Master bedroom on the main level (approx. 11.1 x 14.2); Second bedroom on the main level (approx. 10.3 x 11.6)
- Flooring: Carpet; Vinyl
- Bathrooms: Full bathrooms (details not provided)
- Heating & cooling: Electric heating; Forced air; Central air conditioning
- Interior features: Wood stove fireplace; High-speed communication available; Disposal
- Laundry & utility: Washer included; Dryer included; Utility room on the main level (approx. 5.3 x 7.4)
Neighborhood map
What this means for you Summary
Snapshot
- This is a 2-bed/2.0-bath manufactured listed at $90k.
Deal economics
- At list price, monthly cash flow is $490 ($6k/yr) — positive.
- The deal already cash-flows at list — no discount required.
- Meets the 1% rule at list price ($2k rent vs $90k).
- Recommended offer: $89k (1.5% below list) — sets the bar for market timing.
- Cap rate 18.5% vs local median 2.6% in Corvallis — top-decile yield for the area; either an underpriced asset or a hidden risk that comps aren't pricing in. Stress-test before assuming the spread holds.
Location & tenants
- Location reads 82/100 on livability (#45 in OR, #1,113 nationally) — a professional / high-income tenant draw. Strengths: amenities A+, commute A+, health & safety A+; Watch: cost of living F.
- Corvallis SD 509J (urban): math 49% / reading 62% proficiency, ranked #15 of 183 in OR (top 8%) — acceptable for families but not a draw, mixed tenant base, ~2y average lease.
- Zoned schools: Crescent Valley High School (931 students, 19% FRL).
- Market conditions: Rents rising fast (+5.7%/yr); 229 active listings in the ZIP; 16 comparable units currently listed for rent nearby; rentals lingering (median 44d on market — plan ~5-8 weeks vacancy on turnover, expect pricing pressure); 100% of comp listings sitting > 30 days — soft ceiling on asking rent; 116 units permitted in Benton County in 2024 (0 in 5+ unit buildings).
Forward outlook
- Local home prices are declining (-3.0%/yr); year-one equity from $622 of loan paydown is wiped out by about $3k of value loss. Plan a longer hold.
- Benton County population projected at +23% by 2050 — long-run rental-demand tailwind backs the buy-and-hold thesis.
- At projected returns (-3.0% appreciation + 5.7% rent growth), your $25k cash investment doubles in ~5 years — after that, you're playing with house money.
Negotiation context
- It's been on market 16 days — a 2% lower offer ($89k) is reasonable based on typical stale-listing flexibility.
- 3 sale attempts since 9y ago with the ask held roughly flat each time — persistent listings suggest the price (not the market) is what's stuck; bring a comps-based counter.
- Current owner paid $30k; list at $90k implies a 201% gain — meaningful room to come down on a strong offer.
Risks & watch-outs
- Watch-outs: flood insurance adds $427/mo.
- Climate carrying-cost: in FEMA flood zone AE (mandatory federal flood insurance) — expect insurance premiums to compound above CPI over the hold.
Questions for the listing agent
- Built in 1972 — when were the roof, HVAC, electrical panel, plumbing, and water heater last replaced?
- What's the actual annual flood-insurance premium (NFIP or private), and is the property in a SFHA with mandatory coverage?
- Is there a deadline driving the sale (1031 exchange, divorce, estate, relocation)? That informs how much negotiation room exists.
- Schools are A-rated — typically a magnet for longer-tenancy family renters. What's the average tenant stay here, and is there a school-zone premium baked into asking?
- What's the average days-on-market for RENTAL listings here right now (not sales)? A rising rental-DOM trend means longer vacancies and softer asking-rent achievability than the comps imply.
- What's the recent tenant-quality profile in this submarket — average credit score on applications, eviction rate, late-payment / NSF rate, and stable-employment percentage? A property-management company in the area should have these aggregated.
- How much new for-sale + rental construction is in the pipeline within 1–3 miles? Heavy new supply typically softens prices + rents 12–24 months out; constrained supply supports both.
Investment metrics
- 1% rule
- 2.07% ✓
- Cap rate
- 18.53%
- Cash-on-cash
- 43.71%
- DSCR
- 2.94
- GRM
- 4.0
CMA / ARV
- ARV (on-the-fly)
- $147,264
- Comps found
- 12
Show comp detail 12 sales within ~0.75 mi
| Address | Dist | Beds/Ba | Sqft | Sold | Price | $/sf | Match |
|---|---|---|---|---|---|---|---|
| 277 NE Conifer Blvd #18 | 0.00mi | 2/2.0 | 1,152 (-8%) | 10mo | $88,500 | $77 | 79 |
| 277 NE Conifer Blvd #24 | 0.00mi | 3/2.0 (+1) | 1,344 (+8%) | 7mo | $97,900 | $73 | 76 |
| 277 NE Conifer Blvd #90 | 0.00mi | 2/2.0 | 1,428 (+14%) | 2mo | $94,000 | $66 | 74 |
| 277 NE Conifer Blvd #67 | 0.00mi | 2/2.0 | 1,120 (-10%) | 12mo | $112,000 | $100 | 73 |
| 277 NE Conifer Blvd #7 | 0.00mi | 2/2.0 | 1,100 (-12%) | 21mo | $86,000 | $78 | 63 |
| 2601 NE Jack London St #103 | 0.53mi | 3/2.0 (+1) | 1,296 (+4%) | 3mo | $192,000 | $148 | 61 |
| 2601 NE Jack London St #86 | 0.53mi | 2/2.0 | 1,309 (+5%) | 10mo | $159,000 | $121 | 59 |
| 2601 NE Jack London St #136 | 0.53mi | 3/2.0 (+1) | 1,188 (-5%) | 15mo | $140,000 | $118 | 50 |
| 2601 NE Jack London St #71 | 0.53mi | 3/2.0 (+1) | 1,404 (+12%) | 3mo | $162,000 | $115 | 47 |
| 2601 NE Jack London St #119 | 0.53mi | 3/2.0 (+1) | 1,352 (+8%) | 12mo | $230,000 | $170 | 46 |
| 2601 NE Jack London St #169 | 0.55mi | 2/2.0 | 1,080 (-14%) | 8mo | $142,900 | $132 | 46 |
| 2601 NE Jack London St Unit (94) | 0.53mi | 3/2.0 (+1) | 1,120 (-10%) | 11mo | $175,000 | $156 | 44 |
Match score weights: distance 35% · size 25% · config 20% · recency 20%. Top-matched comps best support the ARV.
Projected returns pro-forma
-3.0% appreciation · 5.74% rent growth · sell at horizon
- IRR
- 20.6%
- Equity multiple
- 1.88×
- Total profit
- $22,173
- Equity at exit
- $13,404
- IRR
- 31.2%
- Equity multiple
- 4.31×
- Total profit
- $83,385
- Equity at exit
- $7,773
Cash invested: $25,172 (down + closing). Projections, not guarantees.
Landlord ↔ Tenant lean methodology
- Overall (STATE)
- 28 Tenant-Leaning
- State Oregon
- 28 Tenant-Leaning · D+6
- County
- — inherits STATE
- City
- — inherits STATE
ZIP-level market 97330
- Rents YoY
- 5.7%
- Active inventory
- 229
- Price-to-rent
- 4.0×
Monthly cashflow live
- Estimated rent
- $1,859 high interval (Pro) →
- Mortgage (P&I)
- −$471
- Tax from tax record
- −$43 /mo · $518/yr
- Insurance
- −$37
- Flood insurance flood zone
- −$427 /mo · $5,118/yr
- HOA
- −$0
- Vacancy / Maint / Mgmt
- −$390
- Net cashflow
- $490
Break-even live
UW: 25.0% down · 7.5% · 30yr · 1.5% tax · 5.0% vac · 8.0% maint · 8.0% mgmt
Financing live
Cash to close
- Down payment
- $22,475
- Closing costs
- $2,697
- Reserves months
- —
- Total cash needed
- —
Loan-product check · same deal, 3 products live
Conventional
25% down · 7.5% · 30yr
- Down + closing
- —
- Monthly P&I
- —
- Monthly cashflow
- —
- DSCR
- —
- Eligible?
- —
Personal DTI + credit; lowest rate.
DSCR
20% down · 8.5% · 30yr
- Down + closing
- —
- Monthly P&I
- —
- Monthly cashflow
- —
- DSCR
- —
- Eligible?
- —
No personal income docs; deal must DSCR.
Hard money
10% down · 12.0% · 12mo
- Down + closing
- —
- Monthly P&I
- —
- Monthly cashflow
- —
- DSCR
- —
- Eligible?
- —
Short-term bridge; refi at stabilization.
Rent comps 16 comps
| Address | Beds | Baths | Sqft | Rent | $/sqft | DOM | Units | Dist |
|---|---|---|---|---|---|---|---|---|
| 3312 NE Lancaster St Unit 1 Corvallis, OR | 2.0 | 1.0 | 750 | $1,450 | $1.93 | 43d | 1 | 0.09mi |
| 3113 NE Flintlock Pl Corvallis, OR | 3.0 | 1.5 | 1472 | $1,995 | $1.36 | 43d | 1 | 0.18mi |
| 213 NE Conifer Blvd Corvallis, OR | 1.0–3.0 | 1.0–2.5 | 1020 | $1,899 | $1.86 | 43d | 7 | 0.27mi |
| 1126 NE Conser Pl Corvallis, OR | 2.0 | 2.0 | 1026 | $2,200 | $2.14 | 43d | 1 | 0.56mi |
| 2675 NE Lancaster St Corvallis, OR | 2.0 | 1.0 | 846 | $1,730 | $2.04 | 43d | 17 | 0.59mi |
| 3424 NW Satinwood St Corvallis, OR | 3.0 | 1.5 | 1173 | $2,395 | $2.04 | 43d | 1 | 0.64mi |
| 2418 NW 9th St Unit 2420 Corvallis, OR | 3.0 | 1.5 | 1050 | $1,895 | $1.80 | 43d | 1 | 0.76mi |
| 720 NW Walnut Blvd Corvallis, OR | 3.0 | 1.5 | 1304 | $2,300 | $1.76 | 43d | 1 | 0.84mi |
| 958 NW Sycamore Ave Corvallis, OR | 1.0 | 1.0 | 750 | $1,425 | $1.90 | 43d | 1 | 1.09mi |
| 2145 NW Highland Dr Apt 2 Corvallis, OR | 2.0 | 1.5 | 918 | $1,795 | $1.96 | 43d | 1 | 1.20mi |
| 991 NW Circle Blvd Corvallis, OR | 2.0 | 1.0 | 1020 | $1,395 | $1.37 | 43d | 1 | 1.22mi |
| 935 NW Hobart Ave Apt 37 Corvallis, OR | 2.0 | 1.5 | 750 | $1,395 | $1.86 | 43d | 1 | 1.31mi |
| 2232 NW 14th St Corvallis, OR | 3.0 | 1.0 | 1444 | $2,295 | $1.59 | 43d | 1 | 1.43mi |
| 2380 NW Green Cir Corvallis, OR | 3.0 | 1.0 | 1062 | $2,195 | $2.07 | 44d | 1 | 1.44mi |
| 2380 NW Rolling Green Dr Corvallis, OR | 2.0 | 1.0–1.5 | 746 | $1,845 | $2.47 | 43d | 8 | 1.47mi |
| 1635 NW Division St Apt 1 Corvallis, OR | 2.0 | 1.0 | 773 | $1,195 | $1.55 | 43d | 1 | 1.49mi |
Listing history 12 events
-
2026-06-19days on market $89,900 Active 16 DOM
-
2026-06-18days on market $89,900 Active 15 DOM
-
2026-06-17days on market $89,900 Active 14 DOM
-
2026-06-16days on market $89,900 Active 13 DOM
-
2026-06-15days on market $89,900 Active 12 DOM
-
2026-06-14days on market $89,900 Active 10 DOM
-
2026-06-10days on market $89,900 Active 7 DOM
-
2026-06-09days on market $89,900 Active 6 DOM
-
2026-06-08days on market $89,900 Active 5 DOM
-
2026-06-07days on market $89,900 Active 4 DOM
-
2026-06-05remarks 515-char remark
-
2026-06-05$89,900 Active 1 DOM
ⓘ Source: listings_history table (triggers on properties + properties_extension) + one-shot
backfill from property_details.listing_events for pre-trigger history.
Tax reassessment forecast OR · Resets to sale price
- Current annual tax
- $518 · $43/mo
- Projected year-2 tax
- $872 · $73/mo
- Expected delta
- +$354/yr (+$30/mo · 68.4%)
ⓘ Screening estimate from a state-policy table — verify with the county assessor before closing.
Climate risk First Street
- Flood 3/10 Moderate FEMA zone AE · 10% chance over 30 yrs
- Wildfire 4/10 Moderate
- Heat 4/10 Moderate 7 d/yr ≥91°F today · 14 d/yr by 30 yrs out
- Wind 1/10 Low
- Air quality 9/10 Extreme 12 unhealthy d/yr today · 12 by 30 yrs out
Nearby sold comps map
Loading sold comps map…
Walkable amenities ~0.75 mi
Loading nearby amenities…
Taxation est. · year 1
- Rental income
- $22,312
- − Mortgage interest
- −$5,036
- − Property taxes
- −$518
- − Insurance
- −$5,568
- − Repairs & maintenance
- −$1,785
- − Management
- −$1,785
- − Depreciation
- −$2,615
- Taxable income
- $5,005
- Est. tax owed @ 24.0%
- −$1,201
- After-tax cash flow
- $4,682/yr
For passive investors: Depreciation is non-cash, so a rental often shows a tax loss while cash-flowing — sheltering income. Rental losses are passive: they offset passive income freely, and up to $25,000/yr can offset ordinary (W-2) income if you actively participate and your MAGI is under $100k (phasing out to $0 by $150k); unused losses carry forward. On sale, claimed depreciation is recaptured at up to 25%, and gains may owe capital-gains tax (a 1031 exchange can defer both). Figures are a year-1 estimate at your 24.0% rate — not tax advice; consult a CPA.
Schools (NCES district)
- District
- Corvallis SD 509J
- NCES district ID
- 4103480
- Math proficiency
- 49% ▼ -3.00%
- Reading proficiency
- 62% ▼ -1.00%
- Median HH income
- $44,820
- Composite
- 48.62/100
- National rank
- #4584
- State rank
- #15 of 183 in OR
Livability — Corvallis
- Score
- 82/100
- State rank
- #45
- US rank
- #1113
Category grades
Schools grade is shown separately in the Schools card above.
Census & demographics
- Census place
- Corvallis, OR
- County
- Benton County · 98,484 people
- City population
- 67,812
- Metro
- Corvallis, OR
- Population (ZIP)
- 43,878
- Household income
- $70,742
- Rent vs Own
- Severe rent burden
- 3416.0
Population outlook (Benton County) Hauer SSP2
- Today (2025)
- 96,963 people
- By 2030
- 101,658 · +4.8%
- By 2040
- 110,157 · +13.6%
- By 2050
- 119,275 · +23.0%
- By 2075
- 145,172 · +49.7%
- By 2100
- 165,349 · +70.5%
Race, ethnicity, and origin ACS 2023
- Neighborhood character
- Predominantly White (75%)
- Race & ethnicity
- White 75% Hispanic / Latino 9% Asian 9% Two or more races 7% Black 2%
- Hispanic origin (detail)
- Mexican 6%
- Common ancestry
- Italian 4% Portuguese 4% Slovak 3%
- Foreign-born
- 13% · Canada, China, South Korea
- Languages at home
- 84% English-only · Spanish 6% Chinese 3% Korean 2%
Political lean MEDSL · Benton
- 2024 margin
- Solid D (+39.6) · D 68.1% · R 28.5% · Other 3.5%
- 2008→2024 swing
- +8.1pp toward D · 2008: 31.5pp · 2024: 39.6pp
- All cycles
- 2024: D+39.6 2020: D+39.7 2016: D+33.8 2012: D+28.8 2008: D+31.5
Not yet ingested
- Civics
- —
Market trends
- HPI YoY
- ▼ -420.12%
- Current HPI
- 298.7746
- Rent YoY
- ▲ 5.74%
- Metro
- Corvallis, OR
- State GDP YoY
- ▲ 2.05%
- F500 in state
- 2
Industry mix (Fortune 500 HQ in OR)
| Industry | F500 HQs | Revenue |
|---|---|---|
| Consumer Goods | 1 | $51B |
|
||
Price history
+200.7% since first listed7 events — show timeline
- 2026-06-04 Listed $89,900 WVMLS
- 2017-08-24 Sold (MLS) $29,900 WVMLS
- 2017-08-23 Pending — WVMLS
- 2017-07-26 Contingent — WVMLS
- 2017-07-20 Relisted — WVMLS
- 2017-07-19 Contingent — WVMLS
- 2017-07-11 Listed $29,900 WVMLS
Property tax history
+8.4%/yrLatest (2025): $518 · +1.3% YoY. Source: county tax records.
Cash-flow waterfall
monthlySold comps — $/sqft
last 12 mo · ≤1 miLoading sold comps…