20403 36th Ave #397 · New York, NY
Flood risk 6/10 · Moderate
- FEMA flood zone
- X (unshaded)
- Chance of flooding over 30 yrs
- 0.69%
- Est. flood insurance / yr
- $507 – $1,088
Fire risk 1/10 · Minimal
- Est. fire insurance / yr
- $691 – $1,283
Heat risk 6/10 · Moderate
- Hot days now (above 99°F)
- 7 days/yr
- Hot days in 30 yrs
- 15 days/yr
Wind risk 6/10 · Moderate
- Chance of severe wind over 30 yrs
- 27.0%
Air-quality risk 4/10 · Minor
- Unhealthy air days now
- 6 days/yr
- Unhealthy air days in 30 yrs
- 6 days/yr
Risk factors via First Street. Map © Google.
Why this score? — see what drove the C+ grade
The composite is a weighted blend of 9 inputs, each scored 0–100. Each bar is that input's sub-score; the figure is the points it added to the 100-point composite (weight × sub-score).
- Cash flow +25.9/30.0
- DSCR +8.7/10.0
- 1% rule +7.5/10.0
- ARV discount +7.5/15.0
- Schools +5.0/10.0
- Rent growth +3.9/5.0
- Livability +3.8/5.0
- Condition / age +2.5/5.0
- Appreciation +0.0/10.0
$195,000
🖨 Deal sheet (PDF) 📄 Offer letter ✓ Due diligence
Listing remarks
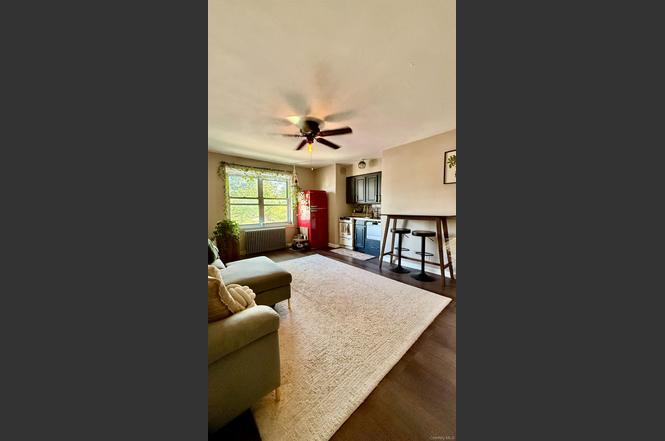
Welcome to Baydale Cooperative—a classic brick garden-style community set on a quiet, tree-lined street in beautiful Bayside New York. This bright sun-drenched one-bedroom corner unit is located on the second floor of a well-maintained building and offers efficient living space with modern updates. A great starter home or home base for someone with a vacation home. Low maintenance! The open-concept layout combines a comfortable living area and compact kitchen. Interior improvements include new flooring, fresh paint, and bathroom updates. Large windows invite natural light throughout the day, giving the home a bright airy feel. The laundry facility, located within the development have
Key facts
- Built 1950
- Listed 277 days
Property features AI
Finance
- HOA & community: Managed by Andrews Property Management
Exterior
- Parking: On-street parking with waitlist; Parking fee required ($150)
- Utilities: Electric service by Con-Edison; Public sewer; Natural gas available; Private trash collection
- Home design: Stock cooperative; Two-story building; One level unit
- Construction: Brick construction
- Exterior features: Brick construction; Not waterfront
Interior
- Kitchen: Other appliances
- Bedrooms: 3 total rooms (includes bedrooms and living areas)
- Bathrooms: 1 full bathroom
- Heating & cooling: Hot water heating; Wall/window air conditioning units
- Interior features: Other interior features; Common basement
- Laundry & utility: Common area laundry
Neighborhood map
What this means for you Summary
Snapshot
- This is a 1-bed/1.0-bath condo listed at $195k.
Deal economics
- At list price, monthly cash flow is $478 ($6k/yr) — positive.
- The deal already cash-flows at list — no discount required.
- Meets the 1% rule at list price ($2k rent vs $195k).
- Recommended offer: $172k (12.0% below list) — sets the bar for market timing.
- Cap rate 9.2% vs local median 2.6% in New York — top-decile yield for the area; either an underpriced asset or a hidden risk that comps aren't pricing in. Stress-test before assuming the spread holds.
Location & tenants
- Location reads 75/100 on livability (#268 in NY, #4,188 nationally) — a middle-class / working-renter tenant base. Strengths: amenities A+, commute A+, health & safety A; Watch: crime F, cost of living F.
- Zoned schools: Elm Tree Elementary School (math 27% / reading 52%, grade F, #1,444 of 2,108 statewide, top 71%, 806 students, 94% FRL); Is 227 Louis Armstrong (math 52% / reading 69%, grade B+, #153 of 729 statewide, top 21%, 1,528 students, 68% FRL); Midwood High School (math 94% / reading 96%, grade A+, #83 of 1,100 statewide, top 8%, 4,062 students, 73% FRL).
- Market conditions: Rents rising fast (+5.4%/yr); 168 active listings in the ZIP; 11 comparable units currently listed for rent nearby; rentals at typical pace (median 21d on market — plan ~3-4 weeks tenant-placement turnaround); solid renter incomes; 5,302 units permitted in Queens County in 2024 (4,918 in 5+ unit buildings).
Forward outlook
- Local home prices are declining (-3.0%/yr); year-one equity from $1k of loan paydown is wiped out by about $6k of value loss. Plan a longer hold.
- Queens County population projected at +16% by 2050 — long-run rental-demand tailwind backs the buy-and-hold thesis.
- At projected returns (-3.0% appreciation + 5.4% rent growth), your $55k cash investment doubles in ~9 years — after that, you're playing with house money.
Negotiation context
- It's been on market 277 days — a 12% lower offer ($172k) is reasonable based on typical stale-listing flexibility.
- 5 sale attempts since 7y ago with the ask held roughly flat each time — persistent listings suggest the price (not the market) is what's stuck; bring a comps-based counter.
Risks & watch-outs
- Watch-outs: built in 1950 — expect roof / HVAC / electrical / plumbing capex.
- Climate carrying-cost: major flood risk; major wind risk, 27% chance of damaging wind over 30y; extreme-heat days projected 7→15/yr by 2055 (HVAC capex compounding) — expect insurance premiums to compound above CPI over the hold.
Questions for the listing agent
- It's been on market 277 days. Have you received any prior offers? Is the seller open to a 12% concession, seller financing, or rate buy-down credit?
- Built in 1950 — when were the roof, HVAC, electrical panel, plumbing, and water heater last replaced?
- What does the HOA fee cover, when was the last increase, and are there any pending special assessments or reserve-fund shortfalls?
- Any open or pending special assessments — roof, HVAC, plumbing, elevator, façade? What's the per-unit balance and payoff schedule, and is the seller paying it off at close or rolling it to the buyer?
- Why hasn't it sold? Are there any deal-killer items the seller is aware of (foundation, flood, title, zoning, code violations)?
- Is there a deadline driving the sale (1031 exchange, divorce, estate, relocation)? That informs how much negotiation room exists.
- Schools are B-rated — typically a magnet for longer-tenancy family renters. What's the average tenant stay here, and is there a school-zone premium baked into asking?
- Crime grade is F in this area — have there been break-ins, vandalism, or insurance claims at this property in the last 3 years? What carrier currently insures it and at what premium?
- What's the average days-on-market for RENTAL listings here right now (not sales)? A rising rental-DOM trend means longer vacancies and softer asking-rent achievability than the comps imply.
- What's the recent tenant-quality profile in this submarket — average credit score on applications, eviction rate, late-payment / NSF rate, and stable-employment percentage? A property-management company in the area should have these aggregated.
- How much new apartment / multifamily construction is in the pipeline within 1–3 miles? Heavy new supply (>2% of stock underway) typically softens rents 12–24 months out; light construction supports rent growth.
Investment metrics
- 1% rule
- 1.25% ✓
- Cap rate
- 9.23%
- Cash-on-cash
- 10.50%
- DSCR
- 1.47
- GRM
- 6.7
CMA / ARV
No comps found within radius.
Projected returns pro-forma
-3.0% appreciation · 5.41% rent growth · sell at horizon
- IRR
- 2.3%
- Equity multiple
- 1.09×
- Total profit
- $4,970
- Equity at exit
- $29,075
- IRR
- 14.2%
- Equity multiple
- 2.28×
- Total profit
- $69,921
- Equity at exit
- $16,860
Cash invested: $54,600 (down + closing). Projections, not guarantees.
Landlord ↔ Tenant lean methodology
- Overall (CITY)
- 0 Strongly Tenant-Friendly
- State New York
- 15 Strongly Tenant-Friendly · D+10
- County
- — inherits STATE
- City New York
- 0 Strongly Tenant-Friendly · D+34
ZIP-level market 11361
- Rents YoY
- 5.4%
- Active inventory
- 168
- Price-to-rent
- 6.7×
Monthly cashflow live
- Estimated rent
- $2,430 high interval (Pro) →
- Mortgage (P&I)
- −$1,023
- Tax est. 1.5%
- −$244 /mo · $2,925/yr
- Insurance
- −$81
- HOA est. from 1 same-building comp
- −$94
- Vacancy / Maint / Mgmt
- −$510
- Net cashflow
- $478
Break-even live
Sensitivity live
| Price | -10% $613 | -5% $545 | +0% $478 | +5% $411 | +10% $343 |
|---|---|---|---|---|---|
| Rent | -10% $286 | -5% $382 | +0% $478 | +5% $574 | +10% $670 |
| Rate | -1.0pp $576 | -0.5pp $528 | base $478 | +0.5pp $427 | +1.0pp $376 |
UW: 25.0% down · 7.5% · 30yr · 1.5% tax · 5.0% vac · 8.0% maint · 8.0% mgmt
Financing live
Cash to close
- Down payment
- $48,750
- Closing costs
- $5,850
- Reserves months
- —
- Total cash needed
- —
Loan-product check · same deal, 3 products live
Conventional
25% down · 7.5% · 30yr
- Down + closing
- —
- Monthly P&I
- —
- Monthly cashflow
- —
- DSCR
- —
- Eligible?
- —
Personal DTI + credit; lowest rate.
DSCR
20% down · 8.5% · 30yr
- Down + closing
- —
- Monthly P&I
- —
- Monthly cashflow
- —
- DSCR
- —
- Eligible?
- —
No personal income docs; deal must DSCR.
Hard money
10% down · 12.0% · 12mo
- Down + closing
- —
- Monthly P&I
- —
- Monthly cashflow
- —
- DSCR
- —
- Eligible?
- —
Short-term bridge; refi at stabilization.
Rent comps 11 comps
| Address | Beds | Baths | Sqft | Rent | $/sqft | DOM | Units | Dist |
|---|---|---|---|---|---|---|---|---|
| 29-04 204th St Unit 1Floor Flushing, NY | 1.0 | 1.0 | 700 | $2,600 | $3.71 | 21d | 1 | 0.51mi |
| 196-42 44th Ave #2 Flushing, NY | 1.0 | 1.0 | 600 | $2,000 | $3.33 | 1d | 1 | 0.56mi |
| 40-11 214th Pl Unit 2R Bayside, NY | 1.0 | 1.0 | 650 | $2,800 | $4.31 | 7d | 1 | 0.72mi |
| 168-10 Crocheron Ave Unit 1A Flushing, NY | 1.0 | 1.0 | 750 | $2,250 | $3.00 | 21d | 1 | 0.78mi |
| 3620 168th St Flushing, NY | 1.0 | 1.0 | 700 | $2,350 | $3.36 | 9d | 2 | 0.80mi |
| 4531 163rd St Unit 1 Flushing, NY | 1.0 | 1.0 | 600 | $2,250 | $3.75 | 9d | 1 | 1.26mi |
| 16-66 Bell Blvd Unit 736 Bayside, NY | — | 1.0 | 600 | $2,350 | $3.92 | 26d | 1 | 1.32mi |
| 1670 Bell Blvd Bayside, NY | 2.0 | 1.0–1.5 | 600 | $2,600 | $4.33 | 1d | 5 | 1.35mi |
| 16-05 Bell Blvd Unit 1st Floor Flushing, NY | 1.0 | 1.0 | 700 | $2,400 | $3.43 | 26d | 1 | 1.43mi |
| 1785 215th St Unit 15J Bayside, NY | 1.0 | 1.0 | 620 | $3,500 | $5.65 | 26d | 1 | 1.45mi |
| 5839 196th Pl Fresh Meadows, NY | 2.0 | 1.0 | 750 | $2,750 | $3.67 | 26d | 1 | 1.50mi |
HOA detail condo
- Monthly dues
- $0 · $0/yr
- Assessments
- None detected in remarks — confirm with the listing agent.
Listing history 11 events
-
2026-06-21days on market $195,000 Active 277 DOM
-
2026-06-18days on market $195,000 Active 274 DOM
-
2026-06-17days on market $195,000 Active 273 DOM
-
2026-06-15days on market $195,000 Active 271 DOM
-
2026-06-13days on market $195,000 Active 269 DOM
-
2026-06-10days on market $195,000 Active 265 DOM
-
2026-06-08days on market $195,000 Active 264 DOM
-
2026-06-03days on market $195,000 Active 259 DOM
-
2026-06-01days on market $195,000 Active 257 DOM
-
2026-05-31remarks 693-char remark
-
2026-05-31$195,000 Active 256 DOM
ⓘ Source: listings_history table (triggers on properties + properties_extension) + one-shot
backfill from property_details.listing_events for pre-trigger history.
Climate risk First Street
- Flood 6/10 Major FEMA zone X (unshaded) · 69% chance over 30 yrs
- Wildfire 1/10 Low
- Heat 6/10 Major 7 d/yr ≥99°F today · 15 d/yr by 30 yrs out
- Wind 6/10 Major 27% chance of damaging wind over 30 yrs
- Air quality 4/10 Moderate 6 unhealthy d/yr today · 6 by 30 yrs out
Nearby sold comps map
Loading sold comps map…
Walkable amenities ~0.75 mi
Loading nearby amenities…
Taxation est. · year 1
- Rental income
- $29,158
- − Mortgage interest
- −$10,923
- − Property taxes
- −$2,925
- − Insurance
- −$975
- − Repairs & maintenance
- −$2,333
- − Management
- −$2,333
- − HOA
- −$1,128
- − Depreciation
- −$5,673
- Taxable income
- $2,869
- Est. tax owed @ 24.0%
- −$688
- After-tax cash flow
- $5,047/yr
For passive investors: Depreciation is non-cash, so a rental often shows a tax loss while cash-flowing — sheltering income. Rental losses are passive: they offset passive income freely, and up to $25,000/yr can offset ordinary (W-2) income if you actively participate and your MAGI is under $100k (phasing out to $0 by $150k); unused losses carry forward. On sale, claimed depreciation is recaptured at up to 25%, and gains may owe capital-gains tax (a 1031 exchange can defer both). Figures are a year-1 estimate at your 24.0% rate — not tax advice; consult a CPA.
Schools (NCES district)
No district data.
Livability — New York
- Score
- 75/100
- State rank
- #268
- US rank
- #4188
Category grades
Schools grade is shown separately in the Schools card above.
Census & demographics
- Census place
- New York, NY
- County
- Queens County · 1,914,869 people
- City population
- 7,731,280
- Metro
- New York-Newark-Jersey City, NY-NJ-PA
- Population (ZIP)
- 30,127
- Household income
- $105,932
- Rent vs Own
- Severe rent burden
- 1087.0
Population outlook (Queens County) Hauer SSP2
- Today (2025)
- 2,546,320 people
- By 2030
- 2,643,059 · +3.8%
- By 2040
- 2,815,563 · +10.6%
- By 2050
- 2,944,423 · +15.6%
- By 2075
- 3,123,338 · +22.7%
- By 2100
- 3,098,688 · +21.7%
Race, ethnicity, and origin ACS 2023
- Neighborhood character
- Diverse neighborhood (Simpson 0.67)
- Race & ethnicity
- Asian 42% White 37% Hispanic / Latino 15% Two or more races 7% Black 4%
- Hispanic origin (detail)
- Puerto Rican 3% Dominican 2%
- Common ancestry
- Romanian 2% Scotch-Irish 1% Lithuanian 1%
- Foreign-born
- 40% · China, South Korea, Canada
- Languages at home
- 47% English-only · Chinese 22% Korean 11% Spanish 9%
Political lean MEDSL · Queens
- 2024 margin
- Strong D (+24.6) · D 62.3% · R 37.7%
- 2008→2024 swing
- -26.2pp toward R · 2008: 50.8pp · 2024: 24.6pp
- All cycles
- 2024: D+24.6 2020: D+45.2 2016: D+53.4 2012: D+58.5 2008: D+50.8
Not yet ingested
- Civics
- —
Market trends
- HPI YoY
- ▼ -190.52%
- Current HPI
- 317.8526
- Rent YoY
- ▲ 5.41%
- Metro
- New York-Newark-Jersey City, NY-NJ-PA
- State GDP YoY
- ▲ 2.60%
- F500 in state
- 92
Industry mix (Fortune 500 HQ in NY)
| Industry | F500 HQs | Revenue |
|---|---|---|
| Financial Services | 10 | $950B |
|
||
| Consumer Goods | 9 | $162B |
|
||
| Insurance | 4 | $225B |
|
||
| Telecommunications | 2 | $144B |
|
||
| Pharmaceuticals | 2 | $112B |
|
||
| Media / Entertainment | 2 | $69B |
|
||
Price history
+5.4% since first listed15 events — show timeline
- 2026-05-26 Price Changed $195,000 OneKey® MLS as Distributed by MLS Grid
- 2026-05-26 Relisted — OneKey® MLS as Distributed by MLS Grid
- 2026-05-18 Listing Removed — OneKey® MLS as Distributed by MLS Grid
- 2025-09-10 Listed $199,000 OneKey® MLS as Distributed by MLS Grid
- 2025-09-05 Coming Soon $199,000 OneKey® MLS as Distributed by MLS Grid
- 2020-05-17 Pending — OneKey® MLS as Distributed by MLS Grid
- 2020-05-11 Listing Removed — OneKey® MLS as Distributed by MLS Grid
- 2020-02-14 Price Changed $175,000 OneKey® MLS as Distributed by MLS Grid
- 2020-01-31 Relisted — OneKey® MLS as Distributed by MLS Grid
- 2019-11-29 Pending — OneKey® MLS as Distributed by MLS Grid
- 2019-10-04 Price Changed $185,000 OneKey® MLS as Distributed by MLS Grid
- 2019-08-30 Relisted — OneKey® MLS as Distributed by MLS Grid
- 2019-05-19 Pending — OneKey® MLS as Distributed by MLS Grid
- 2019-05-17 Price Changed $195,000 OneKey® MLS as Distributed by MLS Grid
- 2019-04-11 Listed $185,000 OneKey® MLS as Distributed by MLS Grid
Cash-flow waterfall
monthlySold comps — $/sqft
last 12 mo · ≤1 miLoading sold comps…