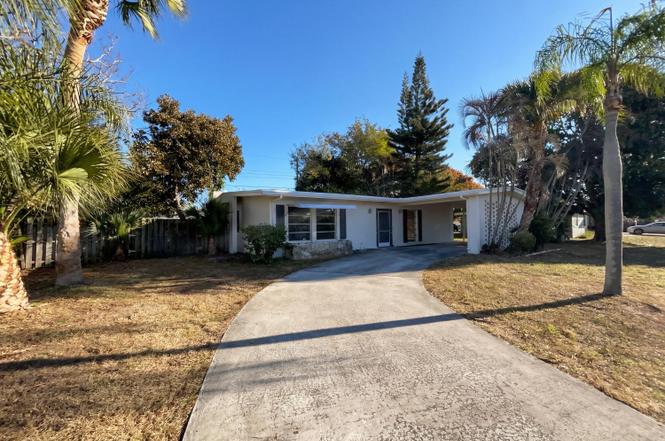
141 SE Calmoso Dr · River Park, FL
Flood risk 1/10 · Minimal
- FEMA flood zone
- X (unshaded)
- Chance of flooding over 30 yrs
- 0.0%
- Est. flood insurance / yr
- $507 – $1,088
Fire risk 1/10 · Minimal
- Est. fire insurance / yr
- $947 – $1,759
Heat risk 10/10 · Severe
- Hot days now (above 106°F)
- 7 days/yr
- Hot days in 30 yrs
- 25 days/yr
Wind risk 10/10 · Severe
- Chance of severe wind over 30 yrs
- 99.0%
Air-quality risk 2/10 · Minimal
- Unhealthy air days now
- 1 days/yr
- Unhealthy air days in 30 yrs
- 1 days/yr
Risk factors via First Street. Map © Google.
Why this score? — see what drove the D grade
The composite is a weighted blend of 9 inputs, each scored 0–100. Each bar is that input's sub-score; the figure is the points it added to the 100-point composite (weight × sub-score).
- Cash flow +14.0/30.0
- ARV discount +10.2/15.0
- DSCR +4.3/10.0
- 1% rule +3.8/10.0
- Schools +3.7/10.0
- Livability +3.5/5.0
- Rent growth +2.9/5.0
- Condition / age +2.5/5.0
- Appreciation +0.0/10.0
$260,000
🖨 Deal sheet (PDF) 📄 Offer letter ✓ Due diligence
Listing remarks
Welcome to 141 SE Calmoso Dr, a home that has been meticulously updated for modern living. The kitchen is a chef's dream, boasting stainless steel appliances that are brand new and ready for use. Step outside to enjoy the patio, perfect for entertaining or simply relaxing. The fenced in backyard provides privacy and a space for outdoor activities. Inside, fresh interior paint gives the home a clean, bright feel. The exterior of the home also features fresh paint, enhancing its curb appeal. New flooring throughout the home adds a touch of elegance and durability. With new appliances included, this home is ready for you to move in and start making memories. Included 100-Day Home Warranty wit
Key facts
- Fenced in backyard
- New flooring
- Fresh interior paint
Tags
Property features AI
Finance
- Financial info: Pets allowed
Exterior
- Parking: Carport (1 covered space)
- Utilities: Three-phase electric service; Public sewer; Water available; Sewer available
- Home design: Single-family home; Resale property; Single-story; Faces south
- Construction: Concrete and stucco construction
- Exterior features: Not waterfront
Interior
- Kitchen: Dishwasher; Electric range; Microwave; Electric water heater
- Bedrooms: 2 bedrooms on the main level
- Flooring: Laminate flooring
- Bathrooms: 2 full bathrooms on the main level
- Heating & cooling: Central electric heating; Central air conditioning
- Interior features: No special interior features listed
Neighborhood map
What this means for you Summary
Snapshot
- This is a 2-bed/1.0-bath single-family listed at $260k.
Deal economics
- At list price, monthly cash flow is $35 ($420/yr) — positive.
- The deal already cash-flows at list — no discount required.
- To meet the 1% rule (rent ≥ 1% of price), the offer needs to be $228k (12.3% below list).
- Recommended offer: $228k (12.3% below list) — sets the bar for 1% rule.
Location & tenants
- Location reads 69/100 on livability (#451 in FL) — a middle-class / working-renter tenant base. Strengths: cost of living A+, housing A+, commute A-; Watch: amenities F, employment F, health & safety D-.
- St. Lucie (urban): math 40% / reading 48% proficiency, ranked #51 of 73 in FL (top 70%) — families likely to look elsewhere, expect single-tenant / working-renter base with shorter leases.
- Zoned schools: Savanna Ridge Elementary School (math 40% / reading 45%, grade F, #1,383 of 2,144 statewide, top 65%, 452 students, 75% FRL); Southern Oaks Middle School (math 39% / reading 43%, grade F, #353 of 571 statewide, top 63%, 894 students, 76% FRL); St. Lucie West Centennial High (math 26% / reading 47%, grade F, #351 of 667 statewide, top 54%, 2,766 students, 59% FRL).
- Market conditions: Rents rising (+1.5%/yr); 358 active listings in the ZIP; 27 comparable units currently listed for rent nearby; rentals at typical pace (median 23d on market — plan ~3-4 weeks tenant-placement turnaround); solid renter incomes; 4,868 units permitted in St. Lucie County in 2024 (268 in 5+ unit buildings).
- This rent runs 36% of the median local income ($75k/yr) — at the standard rent-burdened threshold; future hikes will face affordability resistance.
Forward outlook
- Local home prices are declining (-3.0%/yr); year-one equity from $2k of loan paydown is wiped out by about $8k of value loss. Plan a longer hold.
- St. Lucie County population projected at +20% by 2050 — long-run rental-demand tailwind backs the buy-and-hold thesis.
Negotiation context
- It's been on market 84 days — a 6% lower offer ($244k) is reasonable based on typical stale-listing flexibility.
- 6 sale attempts since 26y ago; this cycle's ask is 17881% above the opening price — seller raised mid-cycle; expect resistance to lowballs.
Risks & watch-outs
- Climate carrying-cost: severe wind risk, 99% chance of damaging wind over 30y; extreme-heat days projected 7→25/yr by 2055 (HVAC capex compounding) — expect insurance premiums to compound above CPI over the hold.
Questions for the listing agent
- It's been on market 84 days. Have you received any prior offers? Is the seller open to a 12% concession, seller financing, or rate buy-down credit?
- Built in 1969 — when were the roof, HVAC, electrical panel, plumbing, and water heater last replaced?
- Why hasn't it sold? Are there any deal-killer items the seller is aware of (foundation, flood, title, zoning, code violations)?
- Is there a deadline driving the sale (1031 exchange, divorce, estate, relocation)? That informs how much negotiation room exists.
- Schools are F-rated, which usually means shorter tenancies and higher turnover. Who's the typical renter profile here, and what's been the actual vacancy rate?
- The area grade is low — what's the realistic commute time and amenity access for the typical tenant pool here? Any planned neighborhood developments (good or bad) we should know about?
- What's the average days-on-market for RENTAL listings here right now (not sales)? A rising rental-DOM trend means longer vacancies and softer asking-rent achievability than the comps imply.
- What's the recent tenant-quality profile in this submarket — average credit score on applications, eviction rate, late-payment / NSF rate, and stable-employment percentage? A property-management company in the area should have these aggregated.
- How much new for-sale + rental construction is in the pipeline within 1–3 miles? Heavy new supply typically softens prices + rents 12–24 months out; constrained supply supports both.
Investment metrics
- 1% rule
- 0.88% ✗
- Cap rate
- 6.45%
- Cash-on-cash
- 0.58%
- DSCR
- 1.03
- GRM
- 9.5
CMA / ARV
- ARV (on-the-fly)
- $276,777
- Comps found
- 12
Show comp detail 12 sales within ~0.75 mi
| Address | Dist | Beds/Ba | Sqft | Sold | Price | $/sf | Match |
|---|---|---|---|---|---|---|---|
| 131 SE Lucero Dr | 0.16mi | 2/2.0 | 1,145 (+0%) | 2mo | $290,000 | $253 | 86 |
| 821 SE Solaz Ave | 0.13mi | 3/2.0 (+1) | 1,136 (-0%) | 5mo | $275,000 | $242 | 80 |
| 175 SE El Sito Ct | 0.28mi | 2/1.0 | 1,082 (-5%) | 5mo | $185,800 | $172 | 74 |
| 775 SW Goodrich St | 0.23mi | 3/2.0 (+1) | 1,166 (+2%) | 9mo | $352,000 | $302 | 69 |
| 109 SE Lucero Dr | 0.16mi | 3/2.0 (+1) | 1,256 (+10%) | 6mo | $265,000 | $211 | 61 |
| 216 SE Fallon Dr | 0.65mi | 2/2.0 | 1,152 (+1%) | 9mo | $339,000 | $294 | 56 |
| 180 NE Lobster Rd | 0.62mi | 2/1.0 | 1,078 (-5%) | 12mo | $250,000 | $232 | 52 |
| 325 SE Bayview Ter | 0.33mi | 2/2.0 | 1,000 (-12%) | 11mo | $270,000 | $270 | 51 |
| 543 SE Calmoso Dr | 0.64mi | 2/2.0 | 1,218 (+7%) | 4mo | $296,500 | $243 | 51 |
| 802 SW Curry St | 0.61mi | 2/2.0 | 1,040 (-9%) | 5mo | $200,000 | $192 | 49 |
| 175 SE Floresta Dr | 0.66mi | 3/2.0 (+1) | 1,257 (+10%) | 6mo | $260,000 | $207 | 38 |
| 1174 SW Hutchins St | 0.69mi | 3/3.0 (+1) | 1,248 (+10%) | 8mo | $335,000 | $268 | 32 |
Match score weights: distance 35% · size 25% · config 20% · recency 20%. Top-matched comps best support the ARV.
Projected returns pro-forma
-3.0% appreciation · 1.53% rent growth · sell at horizon
- IRR
- -17.0%
- Equity multiple
- 0.41×
- Total profit
- $-43,208
- Equity at exit
- $38,767
- IRR
- -11.8%
- Equity multiple
- 0.34×
- Total profit
- $-47,926
- Equity at exit
- $22,480
Cash invested: $72,800 (down + closing). Projections, not guarantees.
Landlord ↔ Tenant lean methodology
- Overall (STATE)
- 87 Strongly Landlord-Friendly
- State Florida
- 87 Strongly Landlord-Friendly · R+3
- County
- — inherits STATE
- City
- — inherits STATE
ZIP-level market 34983
- Home prices YoY
- -33.9%
- Rents YoY
- 1.5%
- Active inventory
- 358
- Price-to-rent
- 9.5×
Monthly cashflow live
- Estimated rent
- $2,279 high interval (Pro) →
- Mortgage (P&I)
- −$1,363
- Tax from tax record
- −$294 /mo · $3,523/yr
- Insurance
- −$108
- HOA
- −$0
- Vacancy / Maint / Mgmt
- −$479
- Net cashflow
- $35
Break-even live
Sensitivity live
| Price | -10% $182 | -5% $109 | +0% $35 | +5% $-39 | +10% $-112 |
|---|---|---|---|---|---|
| Rent | -10% $-145 | -5% $-55 | +0% $35 | +5% $125 | +10% $215 |
| Rate | -1.0pp $166 | -0.5pp $101 | base $35 | +0.5pp $-32 | +1.0pp $-101 |
UW: 25.0% down · 7.5% · 30yr · 1.5% tax · 5.0% vac · 8.0% maint · 8.0% mgmt
Financing live
Cash to close
- Down payment
- $65,000
- Closing costs
- $7,800
- Reserves months
- —
- Total cash needed
- —
Loan-product check · same deal, 3 products live
Conventional
25% down · 7.5% · 30yr
- Down + closing
- —
- Monthly P&I
- —
- Monthly cashflow
- —
- DSCR
- —
- Eligible?
- —
Personal DTI + credit; lowest rate.
DSCR
20% down · 8.5% · 30yr
- Down + closing
- —
- Monthly P&I
- —
- Monthly cashflow
- —
- DSCR
- —
- Eligible?
- —
No personal income docs; deal must DSCR.
Hard money
10% down · 12.0% · 12mo
- Down + closing
- —
- Monthly P&I
- —
- Monthly cashflow
- —
- DSCR
- —
- Eligible?
- —
Short-term bridge; refi at stabilization.
Rent comps 27 comps
| Address | Beds | Baths | Sqft | Rent | $/sqft | DOM | Units | Dist |
|---|---|---|---|---|---|---|---|---|
| 107 SE Lucero Dr Port Saint Lucie, FL | 3.0 | 2.0 | 1326 | $2,150 | $1.62 | 23d | 1 | 0.20mi |
| 151 SE Castana Ct Port Saint Lucie, FL | 3.0 | 2.0 | 1382 | $2,500 | $1.81 | 25d | 1 | 0.25mi |
| 738 SW Ravenswood Ln Port St Lucie, FL | 2.0 | 2.0 | 894 | $2,100 | $2.35 | 23d | 1 | 0.31mi |
| 642 SW Bolin Ct Port Saint Lucie, FL | 3.0 | 2.0 | 1166 | $2,150 | $1.84 | 23d | 1 | 0.40mi |
| 121 SE Juper Ave Port Saint Lucie, FL | 2.0 | 2.0 | 1450 | $2,500 | $1.72 | 25d | 1 | 0.42mi |
| 116 Prima Vista Blvd Unit A Port St. Lucie, FL | 3.0 | 1.0 | 1314 | $2,600 | $1.98 | 25d | 1 | 0.44mi |
| 213 NE Prima Vista Blvd Port Saint Lucie, FL | 2.0 | 1.0 | 1012 | $2,000 | $1.98 | 25d | 1 | 0.54mi |
| 491 SW Curtis St Port Saint Lucie, FL | 1.0 | 1.0 | 750 | $1,800 | $2.40 | 25d | 1 | 0.58mi |
| 336 SE Tranquilla Ave Port Saint Lucie, FL | 3.0 | 3.0 | 1412 | $2,700 | $1.91 | 15d | 1 | 0.72mi |
| 160 NE Bracken Rd Port Saint Lucie, FL | 3.0 | 2.0 | 1166 | $2,200 | $1.89 | 25d | 1 | 0.80mi |
| 160 NE Bracken Rd Port Saint Lucie, FL | 3.0 | 2.0 | 1166 | $2,200 | $1.89 | 23d | 1 | 0.80mi |
| 173 SE Fallon Dr Port Saint Lucie, FL | 3.0 | 2.0 | 1281 | $2,400 | $1.87 | 15d | 1 | 0.81mi |
| 201 NE Midfield Ln Port Saint Lucie, FL | 2.0 | 2.0 | 1389 | $2,500 | $1.80 | 25d | 1 | 0.84mi |
| 351 SW Buswell Ave Port Saint Lucie, FL | 2.0 | 2.0 | 1234 | $2,200 | $1.78 | 15d | 1 | 0.84mi |
| 1382 SE Sandia Dr Port Saint Lucie, FL | 2.0 | 1.0 | 945 | $1,000 | $1.06 | 25d | 1 | 0.87mi |
| 456 SW Prado Ave Port Saint Lucie, FL | 3.0 | 2.0 | 1376 | $2,100 | $1.53 | 15d | 1 | 0.88mi |
| 1189 SW Broadview St Port Saint Lucie, FL | 2.0 | 2.0 | 988 | $2,200 | $2.23 | 15d | 1 | 0.89mi |
| 730 SE White Ave Port Saint Lucie, FL | 2.0 | 2.0 | 1386 | $10,000 | $7.22 | 25d | 1 | 1.05mi |
| 554 SW Lakehurst Dr Port Saint Lucie, FL | 3.0 | 2.0 | 1054 | $2,100 | $1.99 | 15d | 1 | 1.06mi |
| 507 NW Billiar Ave Port St Lucie, FL | 3.0 | 2.0 | 1249 | $2,350 | $1.88 | 23d | 1 | 1.06mi |
| 650 SE Evergreen Ter Port Saint Lucie, FL | 2.0 | 2.0 | 974 | $2,095 | $2.15 | 15d | 1 | 1.06mi |
| 326 SW Ray Ave Port Saint Lucie, FL | 3.0 | 2.0 | 1350 | $2,350 | $1.74 | 23d | 1 | 1.07mi |
| 326 SW Ray Ave Port Saint Lucie, FL | 3.0 | 2.0 | 1350 | $2,400 | $1.78 | 25d | 1 | 1.07mi |
| 385 NW Broadview St Port Saint Lucie, FL | 2.0 | 2.0 | 1500 | $2,300 | $1.53 | 25d | 1 | 1.21mi |
| 325 NW Ferris Dr Port Saint Lucie, FL | 2.0 | 2.0 | 1100 | $1,900 | $1.73 | 15d | 1 | 1.23mi |
| 385 SW Fairway Ave Port Saint Lucie, FL | 3.0 | 2.0 | 1440 | $2,800 | $1.94 | 25d | 1 | 1.23mi |
| 434 SW Whitmore Dr Port Saint Lucie, FL | 1.0 | 1.0 | 750 | $2,150 | $2.87 | 25d | 1 | 1.49mi |
Listing history 17 events
-
2026-05-19status Pending
-
2026-05-19status Active
-
2026-05-13status Pending
-
2026-04-30price $260,000
-
2026-04-13status Active
-
2026-04-06historical
-
2026-03-19status Active
-
2026-03-18historical
-
2026-02-18historical $1,446
-
2026-02-14$1,446
-
2026-02-09$265,000 Active
-
2026-01-30soldstatus $245,600
-
2000-10-03historical
-
2000-09-14soldstatus $68,000
-
2000-08-22$68,500
-
1990-10-15soldstatus $61,500
-
1989-07-18soldstatus $58,000
ⓘ Source: listings_history table (triggers on properties + properties_extension) + one-shot
backfill from property_details.listing_events for pre-trigger history.
Tax reassessment forecast FL · Resets to sale price
- Current annual tax
- $3,523 · $294/mo
- Projected year-2 tax
- $3,523 · $294/mo
- Expected delta
- $0/yr ($0/mo · 0.0%)
ⓘ Screening estimate from a state-policy table — verify with the county assessor before closing.
Climate risk First Street
- Flood 1/10 Low FEMA zone X (unshaded) · 0% chance over 30 yrs
- Wildfire 1/10 Low
- Heat 10/10 Extreme 7 d/yr ≥106°F today · 25 d/yr by 30 yrs out
- Wind 10/10 Extreme 99% chance of damaging wind over 30 yrs
- Air quality 2/10 Low 1 unhealthy d/yr today · 1 by 30 yrs out
Nearby sold comps map
Loading sold comps map…
Walkable amenities ~0.75 mi
Loading nearby amenities…
Taxation est. · year 1
- Rental income
- $27,347
- − Mortgage interest
- −$14,564
- − Property taxes
- −$3,523
- − Insurance
- −$1,300
- − Repairs & maintenance
- −$2,188
- − Management
- −$2,188
- − Depreciation
- −$7,564
- Taxable loss
- −$3,978
- Est. tax savings @ 24.0%
- +$955
- After-tax cash flow
- $1,375/yr
For passive investors: Depreciation is non-cash, so a rental often shows a tax loss while cash-flowing — sheltering income. Rental losses are passive: they offset passive income freely, and up to $25,000/yr can offset ordinary (W-2) income if you actively participate and your MAGI is under $100k (phasing out to $0 by $150k); unused losses carry forward. On sale, claimed depreciation is recaptured at up to 25%, and gains may owe capital-gains tax (a 1031 exchange can defer both). Figures are a year-1 estimate at your 24.0% rate — not tax advice; consult a CPA.
Schools (NCES district)
- District
- St. Lucie
- NCES district ID
- 1201770
- Math proficiency
- 40% ▼ -11.00%
- Reading proficiency
- 48% ▼ -4.00%
- Median HH income
- $44,737
- Composite
- 37.28/100
- National rank
- #4449
- State rank
- #51 of 73 in FL
Livability — River Park
- Score
- 69/100
- State rank
- #451
- US rank
- #8159
Category grades
Schools grade is shown separately in the Schools card above.
Census & demographics
- Census place
- River Park, FL
- County
- Saint Lucie County · 337,150 people
- Metro
- Port St. Lucie, FL
- Population (ZIP)
- 49,001
- Household income
- $75,489
- Rent vs Own
- Severe rent burden
- 843.0
Population outlook (St. Lucie County) Hauer SSP2
- Today (2025)
- 338,016 people
- By 2030
- 355,687 · +5.2%
- By 2040
- 385,521 · +14.1%
- By 2050
- 406,106 · +20.1%
- By 2075
- 441,054 · +30.5%
- By 2100
- 436,885 · +29.2%
Race, ethnicity, and origin ACS 2023
- Neighborhood character
- Diverse neighborhood (Simpson 0.65)
- Race & ethnicity
- White 51% Hispanic / Latino 23% Black 18% Two or more races 13% Asian 3%
- Hispanic origin (detail)
- Mexican 3% Puerto Rican 9% Cuban 3%
- Common ancestry
- Hispanic 3% Romanian 2% Italian 1%
- Foreign-born
- 19% · Canada, Guatemala, Jamaica
- Languages at home
- 74% English-only · Spanish 15% French/Haitian/Cajun 4% Other Indo-European 2%
Political lean MEDSL · St. Lucie
- 2024 margin
- Lean R (+9.1) · D 45.1% · R 54.2%
- 2008→2024 swing
- -21.2pp toward R · 2008: 12.1pp · 2024: -9.1pp
- All cycles
- 2024: R+9.1 2020: R+1.6 2016: R+2.5 2012: D+7.9 2008: D+12.1
Not yet ingested
- Civics
- —
Market trends
- HPI YoY
- ▼ -209.28%
- Current HPI
- 407.6341
- Rent YoY
- ▲ 1.53%
- Metro
- Port St. Lucie, FL
- State GDP YoY
- ▲ 3.28%
- F500 in state
- 36
Industry mix (Fortune 500 HQ in FL)
| Industry | F500 HQs | Revenue |
|---|---|---|
| Industrial Technology | 2 | $29B |
|
||
| Insurance | 2 | $17B |
|
||
| Retail | 1 | $60B |
|
||
| Technology Distribution | 1 | $58B |
|
||
| Homebuilding | 1 | $35B |
|
||
| Technology Manufacturing | 1 | $35B |
|
||
Price history
+348.3% since first listed17 events — show timeline
- 2026-05-19 Pending — Beaches MLS
- 2026-05-19 Relisted — Beaches MLS
- 2026-05-13 Pending — Beaches MLS
- 2026-04-30 Price Changed $260,000 Beaches MLS
- 2026-04-13 Relisted — Beaches MLS
- 2026-04-06 Listing Removed — Beaches MLS
- 2026-03-19 Relisted — Beaches MLS
- 2026-03-18 Listing Removed — Beaches MLS
- 2026-02-18 Rental Removed $1,446 RENTSPREE
- 2026-02-14 Listed for Rent $1,446 RENTSPREE
- 2026-02-09 Listed $265,000 Beaches MLS
- 2026-01-30 Sold (Public Records) $245,600 Public Records
- 2000-10-03 Listing Removed — Beaches MLS
- 2000-09-14 Sold (Public Records) $68,000 Public Records
- 2000-08-22 Listed $68,500 Beaches MLS
- 1990-10-15 Sold (Public Records) $61,500 Public Records
- 1989-07-18 Sold (Public Records) $58,000 Public Records
Property tax history
+10.5%/yrLatest (2025): $3,523 · +9.1% YoY. Source: county tax records.
Cash-flow waterfall
monthlySold comps — $/sqft
last 12 mo · ≤1 miLoading sold comps…