 17-Plex
4831 Sycamore Ave #16 · Pasadena, TX
Flood risk 4/10 · Minor
- FEMA flood zone
- X (unshaded)
- Chance of flooding over 30 yrs
- 0.22%
- Est. flood insurance / yr
- $507 – $1,088
Fire risk 1/10 · Minimal
- Est. fire insurance / yr
- $1,222 – $2,270
Heat risk 9/10 · Severe
- Hot days now (above 109°F)
- 7 days/yr
- Hot days in 30 yrs
- 22 days/yr
Wind risk 9/10 · Severe
- Chance of severe wind over 30 yrs
- 99.0%
Air-quality risk 2/10 · Minimal
- Unhealthy air days now
- 2 days/yr
- Unhealthy air days in 30 yrs
- 2 days/yr
Risk factors via First Street. Map © Google.
Why this score? — see what drove the C+ grade
The composite is a weighted blend of 9 inputs, each scored 0–100. Each bar is that input's sub-score; the figure is the points it added to the 100-point composite (weight × sub-score).
- Cash flow +27.9/30.0
- DSCR +9.9/10.0
- ARV discount +7.5/15.0
- 1% rule +6.7/10.0
- Livability +3.3/5.0
- Schools +2.6/10.0
- Condition / age +2.5/5.0
- Rent growth +0.1/5.0
- Appreciation +0.0/10.0
$1,360,000
🖨 Deal sheet (PDF) 📄 Offer letter ✓ Due diligence
Multi-family units
County records classify this as Multi-Family (5+ Unit). Listing-text estimate: 17 units. confirmed
5+ unit building — per-unit beds/baths from public records are typically unavailable; the breakdown below (if shown) is an estimate from the listing text.
Listing remarks MLS
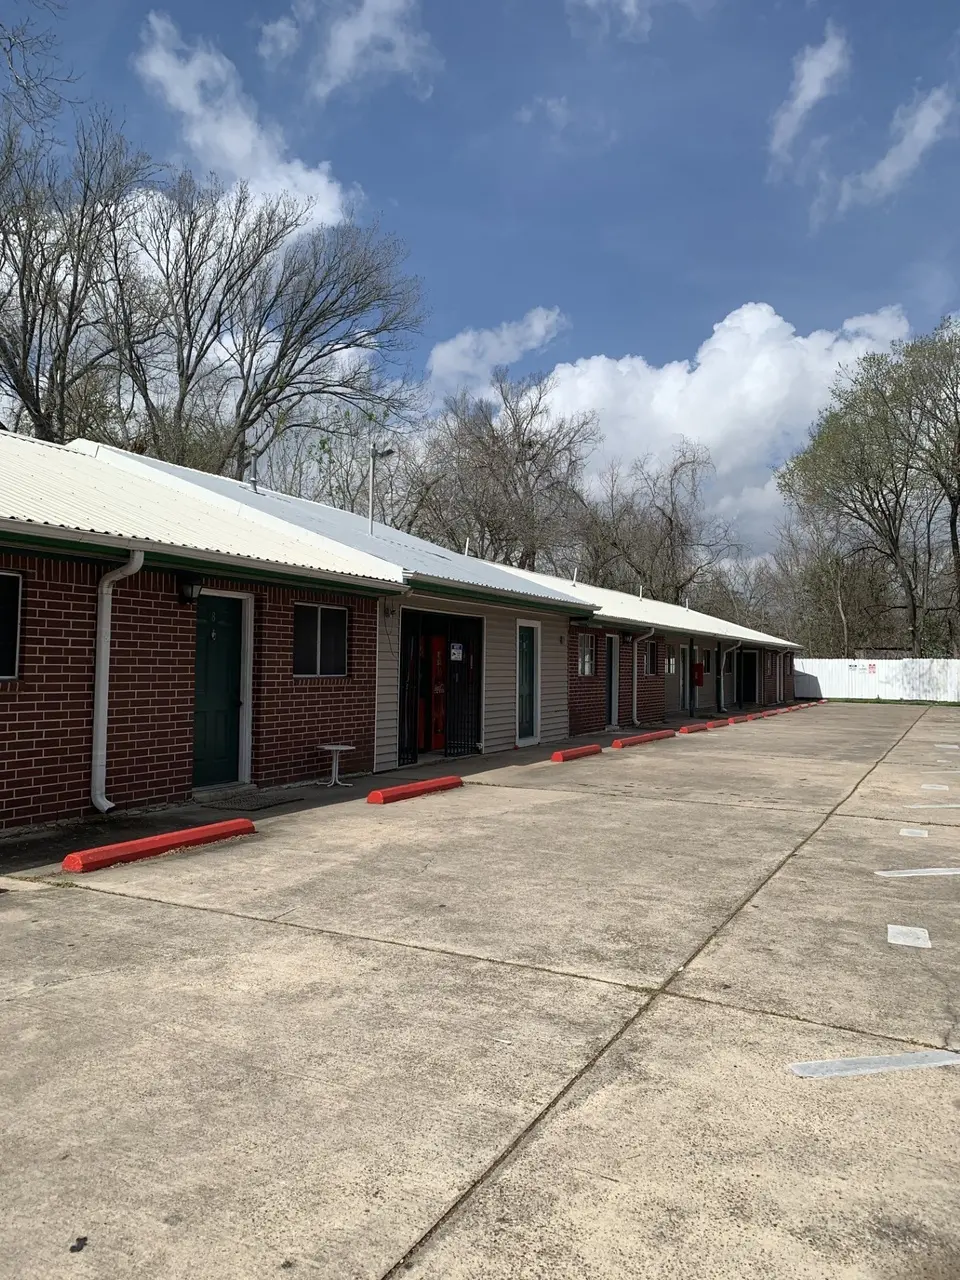
Sycamore Flats is a 17-unit multifamily asset built in 1963 and underwent an extensive renovation in 2022-23. Strategically located just 20 miles southeast of downtown Houston, this property offers exceptional access to major employment centers, highways, and airports. The recent renovations have transformed Sycamore Flats into a modern and desirable living space, featuring modernized interiors, durable metal roofing, and virtually no deferred maintenance. This turnkey investment provides immediate growth potential, allowing investors to capitalize on a 5-year hold by maximizing rents and addressing loss to lease. Don't miss out on this incredible opportunity! Sycamore Flats is a rare find in today's market, offering a combination of strong location, recent renovations, and immediate growth potential. Contact us today to learn more and secure your investment.
Key facts
- Extensive renovation
- Modernized interiors
- Strong location
Tags
Neighborhood map
What this means for you Summary
Snapshot
- This is a 17 × 1-bed/?-bath units multifamily listed at $1.36M.
Deal economics
- At list price, monthly cash flow is $4k ($50k/yr) — positive. Per door: $248/mo.
- The deal already cash-flows at list — no discount required.
- Meets the 1% rule at list price ($16k rent vs $1.36M).
- Recommended offer: $1.20M (12.0% below list) — sets the bar for market timing.
- Cap rate 10.0% vs local median 3.5% in Pasadena — top-decile yield for the area; either an underpriced asset or a hidden risk that comps aren't pricing in. Stress-test before assuming the spread holds.
Location & tenants
- Location reads 66/100 on livability (#600 in TX) — a middle-class / working-renter tenant base. Strengths: cost of living A+, housing A+; Watch: employment D+, crime F, amenities F.
- Pasadena ISD (suburban): math 29% / reading 32% proficiency, ranked #612 of 826 in TX (top 74%) — families likely to look elsewhere, expect single-tenant / working-renter base with shorter leases; 71% free/reduced lunch — lower-income household profile, screen leases tightly.
- Zoned schools: Golden Acres El (math 17% / reading 22%, grade F, #3,583 of 4,322 statewide, top 86%, 382 students, 90% FRL); Bondy Int (math 44% / reading 45%, grade D, #491 of 1,662 statewide, top 31%, 966 students, 75% FRL); Sam Rayburn H S (math 52% / reading 36%, grade F, #697 of 1,632 statewide, top 43%, 2,645 students, 86% FRL).
- Market conditions: Rents falling (-9.4%/yr); 82 active listings in the ZIP; 29,883 units permitted in Harris County in 2024 (8,621 in 5+ unit buildings).
- At $15,977/mo this rent would consume 287% of the median local household income ($67k/yr) (locally 1101% of renters already pay >50% of income on rent) — very limited rent-growth headroom before tenants either downsize or default.
Forward outlook
- Local home prices are declining (-3.0%/yr); year-one equity from $9k of loan paydown is wiped out by about $41k of value loss. Plan a longer hold.
- Harris County population projected at +47% by 2050 — long-run rental-demand tailwind backs the buy-and-hold thesis.
Negotiation context
- It's been on market 362 days — a 12% lower offer ($1.20M) is reasonable based on typical stale-listing flexibility.
- 3 sale attempts since 6y ago with the ask held roughly flat each time — persistent listings suggest the price (not the market) is what's stuck; bring a comps-based counter.
Risks & watch-outs
- Climate carrying-cost: severe wind risk, 99% chance of damaging wind over 30y; extreme-heat days projected 7→22/yr by 2055 (HVAC capex compounding) — expect insurance premiums to compound above CPI over the hold.
Questions for the listing agent
- It's been on market 362 days. Have you received any prior offers? Is the seller open to a 12% concession, seller financing, or rate buy-down credit?
- Can we see the unit-by-unit rent roll, current vacancy, and any below-market leases? What's the average tenancy length?
- What capital expenditures (roof, boiler, parking lot, exteriors) have been made in the last 5 years, and what's planned in the next 2?
- Built in 1963 — when were the roof, HVAC, electrical panel, plumbing, and water heater last replaced?
- Why hasn't it sold? Are there any deal-killer items the seller is aware of (foundation, flood, title, zoning, code violations)?
- Is there a deadline driving the sale (1031 exchange, divorce, estate, relocation)? That informs how much negotiation room exists.
- Schools are D-rated, which usually means shorter tenancies and higher turnover. Who's the typical renter profile here, and what's been the actual vacancy rate?
- Crime grade is F in this area — have there been break-ins, vandalism, or insurance claims at this property in the last 3 years? What carrier currently insures it and at what premium?
- What's the average days-on-market for RENTAL listings here right now (not sales)? A rising rental-DOM trend means longer vacancies and softer asking-rent achievability than the comps imply.
- What's the recent tenant-quality profile in this submarket — average credit score on applications, eviction rate, late-payment / NSF rate, and stable-employment percentage? A property-management company in the area should have these aggregated.
- How much new apartment / multifamily construction is in the pipeline within 1–3 miles? Heavy new supply (>2% of stock underway) typically softens rents 12–24 months out; light construction supports rent growth.
Investment metrics
- 1% rule
- 1.17% ✓
- Cap rate
- 10.01%
- Cash-on-cash
- 13.26%
- DSCR
- 1.59
- GRM
- 7.1
CMA / ARV
No comps found within radius.
Projected returns pro-forma
-3.0% appreciation · 0.0% rent growth · sell at horizon
- IRR
- 0.0%
- Equity multiple
- 1.00×
- Total profit
- $425
- Equity at exit
- $202,780
- IRR
- 6.6%
- Equity multiple
- 1.43×
- Total profit
- $163,021
- Equity at exit
- $117,588
Cash invested: $380,800 (down + closing). Projections, not guarantees.
Landlord ↔ Tenant lean methodology
- Overall (STATE)
- 87 Strongly Landlord-Friendly
- State Texas
- 87 Strongly Landlord-Friendly · R+5
- County
- — inherits STATE
- City
- — inherits STATE
ZIP-level market 77503
- Home prices YoY
- -13.7%
- Rents YoY
- -9.4%
- Active inventory
- 82
- Price-to-rent
- 120.6×
Monthly cashflow live
- Estimated rent
- $15,977 high interval (Pro) →
- Mortgage (P&I)
- −$7,132
- Tax from tax record
- −$715 /mo · $8,586/yr
- Insurance
- −$567
- HOA
- −$0
- Vacancy / Maint / Mgmt
- −$3,355
- Net cashflow
- $4,208
Break-even live
Sensitivity live
| Price | -10% $4,978 | -5% $4,593 | +0% $4,208 | +5% $3,823 | +10% $3,438 |
|---|---|---|---|---|---|
| Rent | -10% $2,945 | -5% $3,577 | +0% $4,208 | +5% $4,839 | +10% $5,470 |
| Rate | -1.0pp $4,893 | -0.5pp $4,554 | base $4,208 | +0.5pp $3,855 | +1.0pp $3,497 |
17-unit breakdown (identical units grouped — click to expand)
| Units | Beds | Baths | Est. rent |
|---|---|---|---|
| 17× units | 1 | — | $15,980 |
| #1 | 1 | — | $940 |
| #2 | 1 | — | $940 |
| #3 | 1 | — | $940 |
| #4 | 1 | — | $940 |
| #5 | 1 | — | $940 |
| #6 | 1 | — | $940 |
| #7 | 1 | — | $940 |
| #8 | 1 | — | $940 |
| #9 | 1 | — | $940 |
| #10 | 1 | — | $940 |
| #11 | 1 | — | $940 |
| #12 | 1 | — | $940 |
| #13 | 1 | — | $940 |
| #14 | 1 | — | $940 |
| #15 | 1 | — | $940 |
| #16 | 1 | — | $940 |
| #17 | 1 | — | $940 |
| Total (17 units) | $15,977 | ||
UW: 25.0% down · 7.5% · 30yr · 1.5% tax · 5.0% vac · 8.0% maint · 8.0% mgmt
Financing live
Cash to close
- Down payment
- $340,000
- Closing costs
- $40,800
- Reserves months
- —
- Total cash needed
- —
Loan-product check · same deal, 3 products live
Conventional
25% down · 7.5% · 30yr
- Down + closing
- —
- Monthly P&I
- —
- Monthly cashflow
- —
- DSCR
- —
- Eligible?
- —
Personal DTI + credit; lowest rate.
DSCR
20% down · 8.5% · 30yr
- Down + closing
- —
- Monthly P&I
- —
- Monthly cashflow
- —
- DSCR
- —
- Eligible?
- —
No personal income docs; deal must DSCR.
Hard money
10% down · 12.0% · 12mo
- Down + closing
- —
- Monthly P&I
- —
- Monthly cashflow
- —
- DSCR
- —
- Eligible?
- —
Short-term bridge; refi at stabilization.
Listing history 24 events
-
2026-06-21days on market $1,360,000 Active 362 DOM
-
2026-06-18days on market $1,360,000 Active 359 DOM
-
2026-06-17days on market $1,360,000 Active 358 DOM
-
2026-06-16days on market $1,360,000 Active 357 DOM
-
2026-06-15days on market $1,360,000 Active 356 DOM
-
2026-06-13days on market $1,360,000 Active 354 DOM
-
2026-06-10days on market $1,360,000 Active 350 DOM
-
2026-06-08days on market $1,360,000 Active 349 DOM
-
2026-06-07days on market $1,360,000 Active 348 DOM
-
2026-06-04days on market $1,360,000 Active 345 DOM
-
2026-06-03days on market $1,360,000 Active 344 DOM
-
2026-06-02days on market $1,360,000 Active 343 DOM
-
2026-06-01days on market $1,360,000 Active 342 DOM
-
2026-05-31days on market $1,360,000 Active 341 DOM
-
2026-02-15historical
-
2025-07-08
-
2025-06-24$1,360,000 Active 877-char remark
Show marketing remark (877 chars)
Sycamore Flats is a 17-unit multifamily asset built in 1963 and underwent an extensive renovation in 2022-23. Strategically located just 20 miles southeast of downtown Houston, this property offers exceptional access to major employment centers, highways, and airports. The recent renovations have transformed Sycamore Flats into a modern and desirable living space, featuring modernized interiors, durable metal roofing, and virtually no deferred maintenance. This turnkey investment provides immediate growth potential, allowing investors to capitalize on a 5-year hold by maximizing rents and addressing loss to lease. Don't miss out on this incredible opportunity! Sycamore Flats is a rare find in today's market, offering a combination of strong location, recent renovations, and immediate growth potential. Contact us today to learn more and secure your investment.
-
2020-12-11soldstatus Sold 166-char remark
Show marketing remark (166 chars)
Great opportunity to build on your own lot. No metal buildings- all structures must be 25 feet away from any property lines per city. Call for more information today!
-
2020-11-21status Pending 166-char remark
Show marketing remark (166 chars)
Great opportunity to build on your own lot. No metal buildings- all structures must be 25 feet away from any property lines per city. Call for more information today!
-
2020-11-11status Option Pending 166-char remark
Show marketing remark (166 chars)
Great opportunity to build on your own lot. No metal buildings- all structures must be 25 feet away from any property lines per city. Call for more information today!
-
2020-09-22$83,000 Active 166-char remark
Show marketing remark (166 chars)
Great opportunity to build on your own lot. No metal buildings- all structures must be 25 feet away from any property lines per city. Call for more information today!
-
2018-12-18soldstatus
-
2013-09-20soldstatus
-
2005-01-11soldstatus
ⓘ Source: listings_history table (triggers on properties + properties_extension) + one-shot
backfill from property_details.listing_events for pre-trigger history.
Tax reassessment forecast TX · Resets to sale price
- Current annual tax
- $8,586 · $715/mo
- Projected year-2 tax
- $24,888 · $2,074/mo
- Expected delta
- +$16,302/yr (+$1,359/mo · 189.9%)
ⓘ Screening estimate from a state-policy table — verify with the county assessor before closing.
Climate risk First Street
- Flood 4/10 Moderate FEMA zone X (unshaded) · 22% chance over 30 yrs
- Wildfire 1/10 Low
- Heat 9/10 Extreme 7 d/yr ≥109°F today · 22 d/yr by 30 yrs out
- Wind 9/10 Extreme 99% chance of damaging wind over 30 yrs
- Air quality 2/10 Low 2 unhealthy d/yr today · 2 by 30 yrs out
Nearby sold comps map
Loading sold comps map…
Walkable amenities ~0.75 mi
Loading nearby amenities…
Taxation est. · year 1
- Rental income
- $191,724
- − Mortgage interest
- −$76,181
- − Property taxes
- −$8,586
- − Insurance
- −$6,800
- − Repairs & maintenance
- −$15,338
- − Management
- −$15,338
- − Depreciation
- −$39,564
- Taxable income
- $29,917
- Est. tax owed @ 24.0%
- −$7,180
- After-tax cash flow
- $43,312/yr
For passive investors: Depreciation is non-cash, so a rental often shows a tax loss while cash-flowing — sheltering income. Rental losses are passive: they offset passive income freely, and up to $25,000/yr can offset ordinary (W-2) income if you actively participate and your MAGI is under $100k (phasing out to $0 by $150k); unused losses carry forward. On sale, claimed depreciation is recaptured at up to 25%, and gains may owe capital-gains tax (a 1031 exchange can defer both). Figures are a year-1 estimate at your 24.0% rate — not tax advice; consult a CPA.
Schools (NCES district)
- District
- Pasadena ISD
- NCES district ID
- 4834320
- Math proficiency
- 29% ▼ -17.00%
- Reading proficiency
- 32% ▼ -9.00%
- Median HH income
- $45,163
- Composite
- 26.15/100
- National rank
- #7275
- State rank
- #612 of 826 in TX
Livability — Pasadena
- Score
- 66/100
- State rank
- #600
- US rank
- #11438
Category grades
Schools grade is shown separately in the Schools card above.
Census & demographics
- Census place
- Pasadena, TX
- County
- Harris County · 4,702,590 people
- City population
- 109,190
- Metro
- Houston-The Woodlands-Sugar Land, TX
- Population (ZIP)
- 23,866
- Household income
- $66,797
- Rent vs Own
- Severe rent burden
- 1101.0
Population outlook (Harris County) Hauer SSP2
- Today (2025)
- 5,571,493 people
- By 2030
- 6,089,821 · +9.3%
- By 2040
- 7,142,806 · +28.2%
- By 2050
- 8,185,864 · +46.9%
- By 2075
- 10,574,329 · +89.8%
- By 2100
- 12,109,958 · +117.4%
Race, ethnicity, and origin ACS 2023
- Neighborhood character
- Predominantly Hispanic (75%)
- Race & ethnicity
- Hispanic / Latino 75% Two or more races 34% White 20% Native American 2% Black 2%
- Hispanic origin (detail)
- Mexican 62% Puerto Rican 3%
- Common ancestry
- Italian 3% Romanian 1% Lithuanian 1%
- Foreign-born
- 25% · Canada
- Languages at home
- 50% English-only · Spanish 49%
Political lean MEDSL · Harris
- 2024 margin
- Lean D (+5.5) · D 52.0% · R 46.4% · Other 1.6%
- 2008→2024 swing
- +3.9pp toward D · 2008: 1.6pp · 2024: 5.5pp
- All cycles
- 2024: D+5.5 2020: D+13.3 2016: D+12.4 2012: D+0.1 2008: D+1.6
Not yet ingested
- Civics
- —
Market trends
- HPI YoY
- ▼ -46.01%
- Current HPI
- 288.9079
- Rent YoY
- ▼ -9.41%
- Metro
- Houston-The Woodlands-Sugar Land, TX
- State GDP YoY
- ▲ 3.95%
- F500 in state
- 110
Industry mix (Fortune 500 HQ in TX)
| Industry | F500 HQs | Revenue |
|---|---|---|
| Energy | 16 | $1,198B |
|
||
| Technology | 5 | $198B |
|
||
| Engineering / Construction | 4 | $72B |
|
||
| Energy Services | 3 | $60B |
|
||
| Utilities | 3 | $41B |
|
||
| Healthcare | 2 | $330B |
|
||
Price history
+1538.6% since first listed10 events — show timeline
- 2026-02-15 Rental Removed — HARMLS
- 2025-07-08 Listed for Rent — HARMLS
- 2025-06-24 Listed $1,360,000 HARMLS
- 2020-12-11 Sold (MLS) — HARMLS
- 2020-11-21 Pending — HARMLS
- 2020-11-11 Pending — HARMLS
- 2020-09-22 Listed $83,000 HARMLS
- 2018-12-18 Sold (Public Records) — Public Records
- 2013-09-20 Sold (Public Records) — Public Records
- 2005-01-11 Sold (Public Records) — Public Records
Property tax history
+4.8%/yrLatest (2025): $8,586 · -48.1% YoY. Source: county tax records.
Cash-flow waterfall
monthlySold comps — $/sqft
last 12 mo · ≤1 miLoading sold comps…